

Question: Optimal extraction over the long term The diagram below is used for the next 5 questions. It depicts the optimal path of price and quantity
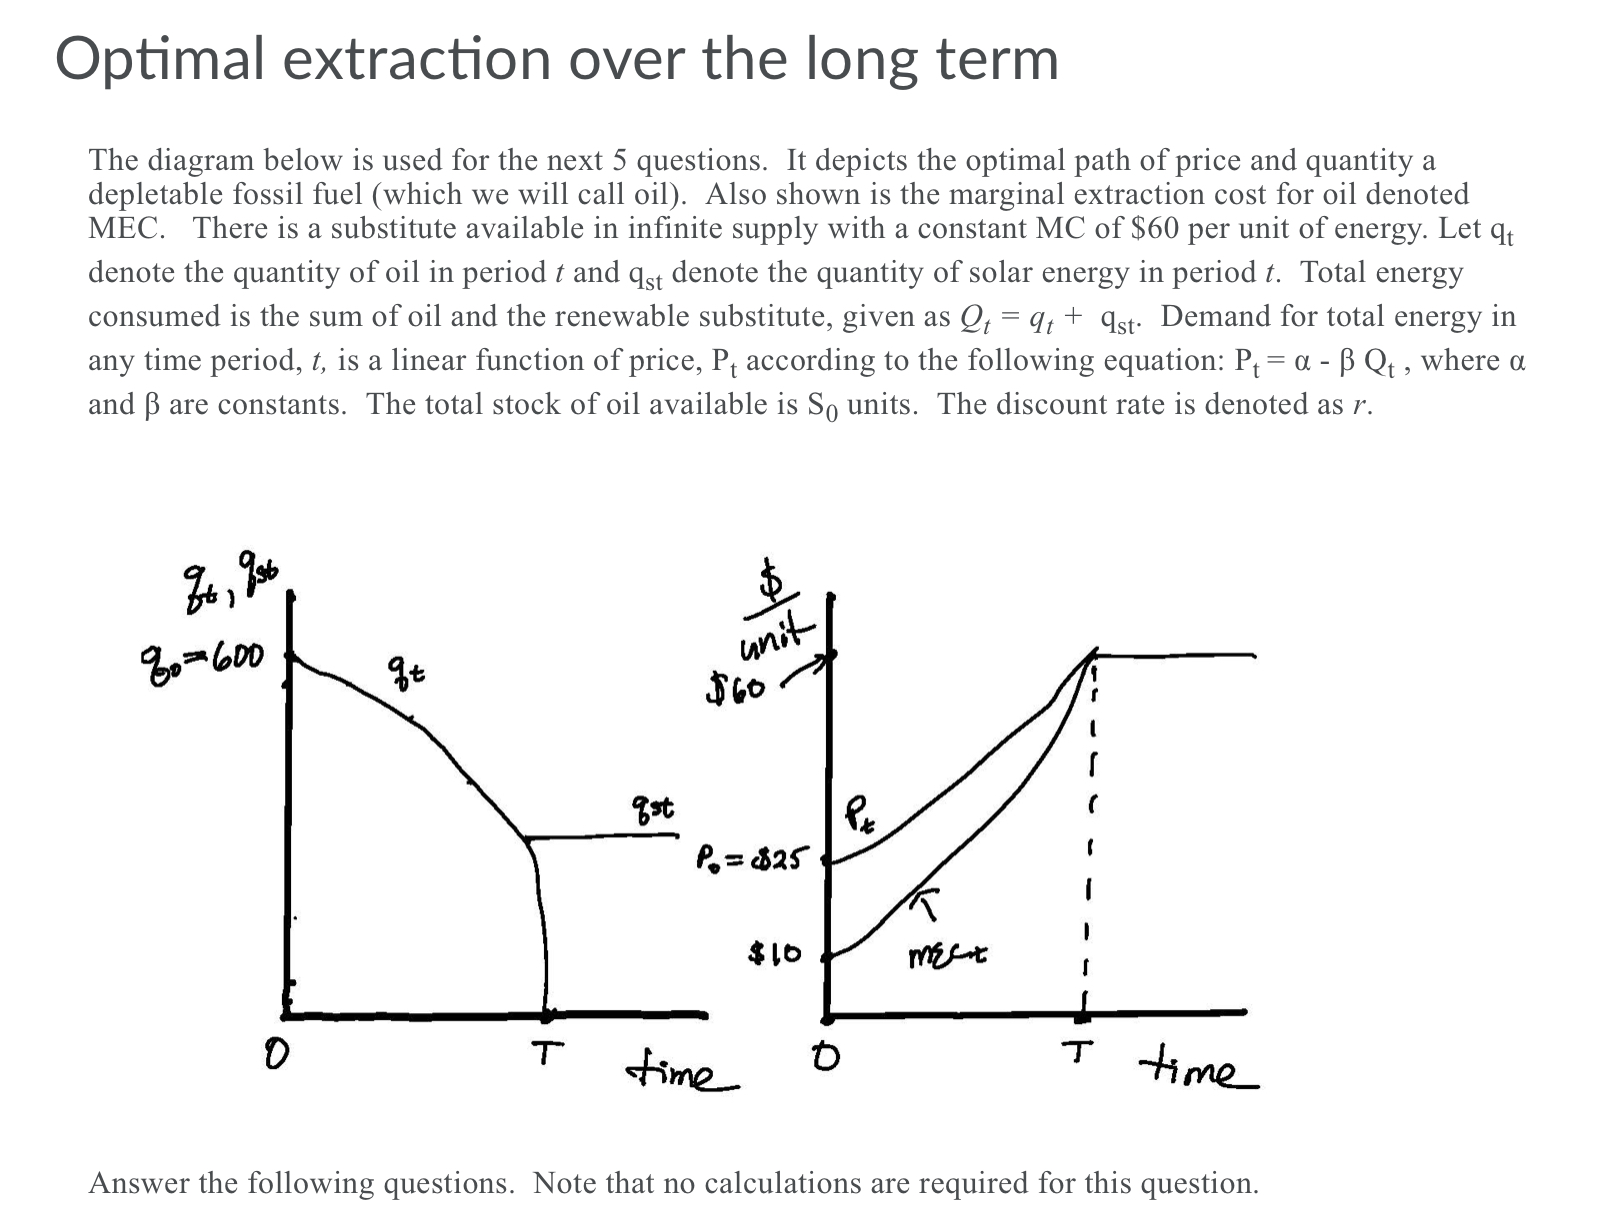
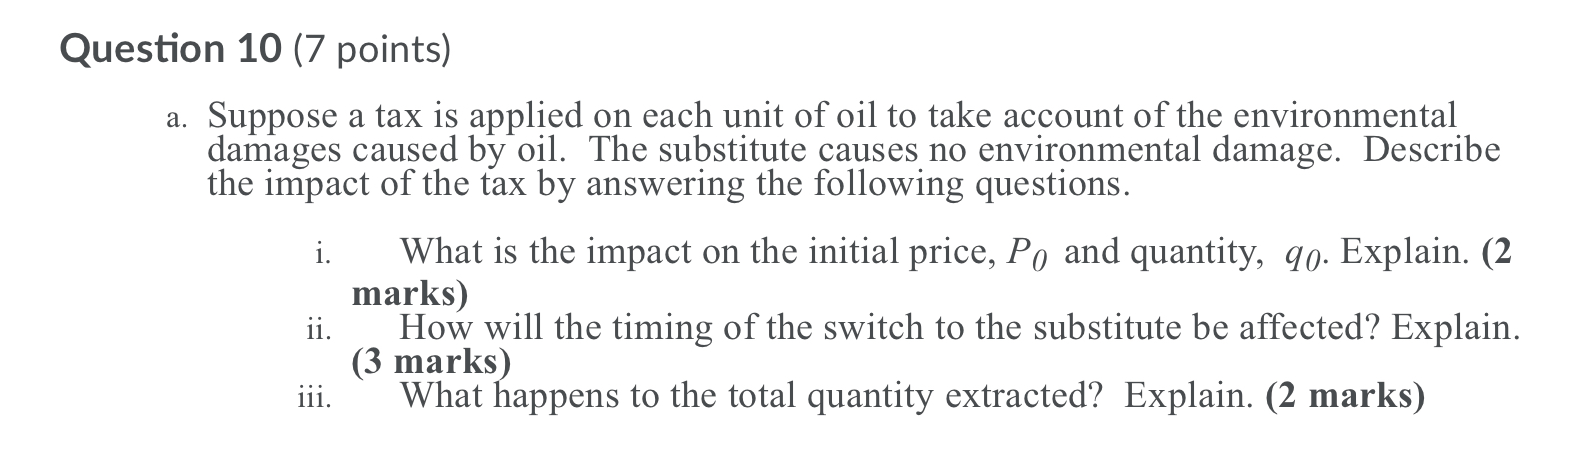
Optimal extraction over the long term The diagram below is used for the next 5 questions. It depicts the optimal path of price and quantity a depletable fossil fuel (which we will call oil). Also shown is the marginal extraction cost for oil denoted MEC. There is a substitute available in innite supply with a constant MC of $60 per unit of energy. Let qt denote the quantity of oil in period t and qst denote the quantity of solar energy in period t. Total energy consumed is the sum of oil and the renewable substitute, given as Q = qrif + qst. Demand for total energy in any time period, t, is a linear function of price, Pt according to the following equation: Pt = or - B Qt , where a and [3 are constants. The total stock of oil available is So units. The discount rate is denoted as r. a 3* 1,9699 1* Answer the following questions. Note that no calculations are required for this question. Question 10 (7 points) a. Suppose a tax is applied on each unit of oil to take account of the environmental damages caused by oil. The substitute causes no environmental damage. Describe the impact of the tax by answering the following questions. What is the impact on the initial price, Po and quantity, q0. Explain. (2 marks) ii. How will the timing of the switch to the substitute be affected? Explain. (3 marks) iii. What happens to the total quantity extracted? Explain. (2 marks)
Step by Step Solution
There are 3 Steps involved in it

Get step-by-step solutions from verified subject matter experts