

Question: Option C (this option focuses on numerical data in case you need more practice) Complete both I and II. I) The following statements were made
Option C (this option focuses on numerical data in case you need more practice)
Complete both I and II.
I) The following statements were made about the test results of Mr. Scarlet's class and Mr. Plum's class using the box-and-whisker plots in the attachment. Indicate whether each statement istrue,false, orcannot be determined, andexplainwhy using information displayed in the box-and-whisker plots.
1) More students in Mrs. Plum's class scored between 66.5% and 84% than between 84% AND 91% because the box is longer between 66.5% and 84% than between 84% AND 91%.
2) The range (i.e., Maximum minus Minimum) of scores in both classes is the same.
3) The median score in Mrs. Plum's class is higher than the median score in Mr. Scarlet's class.
4) Because about 50% of the scores in Mr. Scarlet's class are above 78 and about 50% of the scores in Mrs. Plum class are above 84, the mean score for Mrs. Plum's class must be higher than the mean score for Mr. Scarlet's class.
Box and Whisker Plots for Discussion Forum.pdfdownload
From the Mathematics GLE Resource Materials for Data, Statistics, and Probability. New Hampshire, Vermont, and Rhode Island Departments of Education.
II) Create your own data set (or find a small data set that you are interested in exploring). Tell us what the data represent. Demonstrate that you can determine the shape, center, and spread of the data "by hand." Then, verify using Fathom. Make certain to upload your work by hand and also the Fathom work. Use the shape of the data to determine if you should be working with the mean or median and quartiles or standard deviation. Explain your choices.
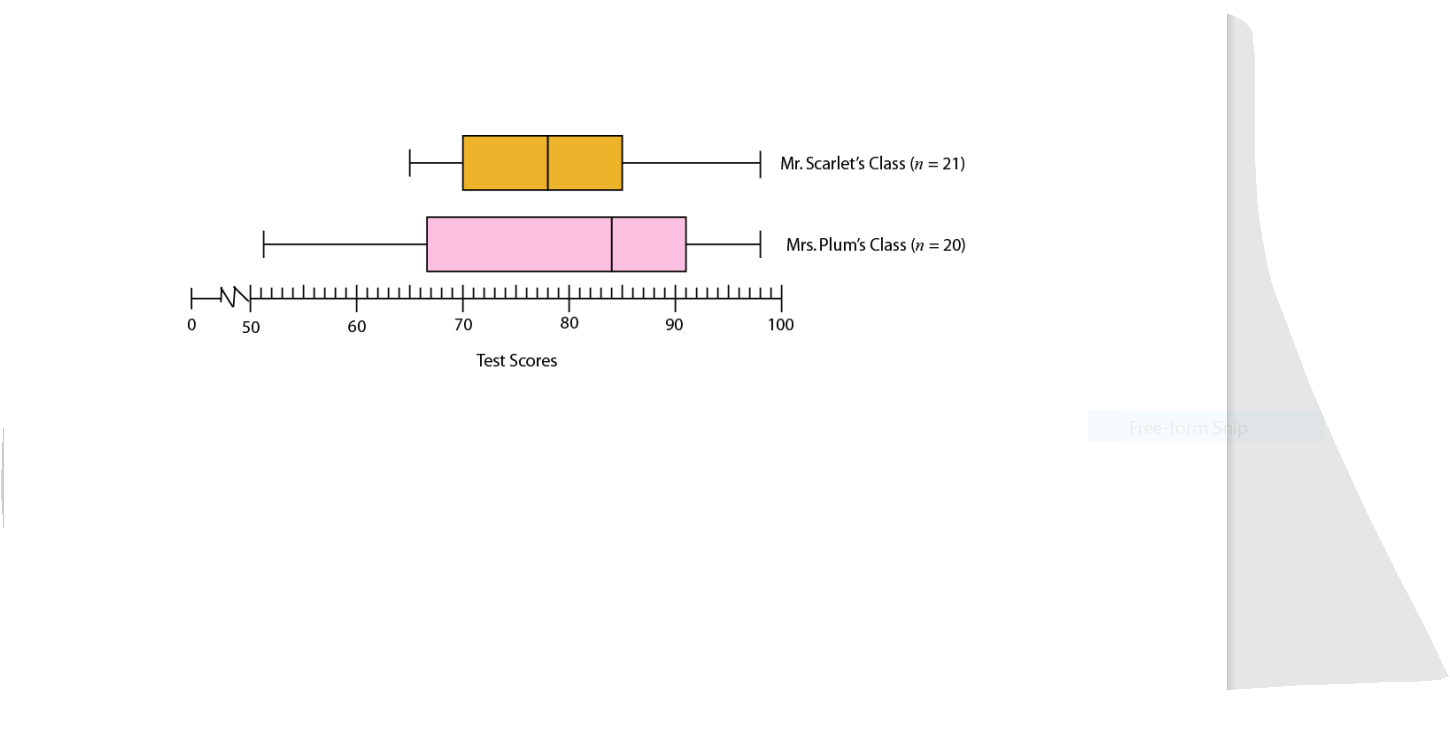
Mr. Scarlet's Class (n = 21) Mrs. Plum's Class (n = 20) 0 50 60 70 80 90 100 Test Scores Free-form Ship
Step by Step Solution
There are 3 Steps involved in it

Get step-by-step solutions from verified subject matter experts