

Question: Options are 5-year/10-year , increase/decrease, 5y/10y, 5y/10y, 5y/10y c. The increases more rapidly with in 1YrReturn than the does. In general, the seems more stable
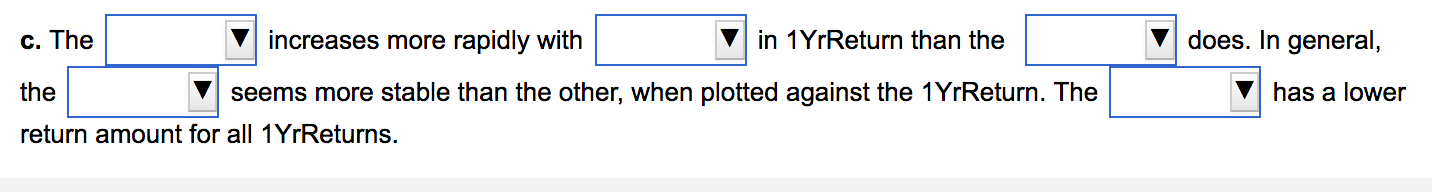
Options are 5-year/10-year , increase/decrease, 5y/10y, 5y/10y, 5y/10y
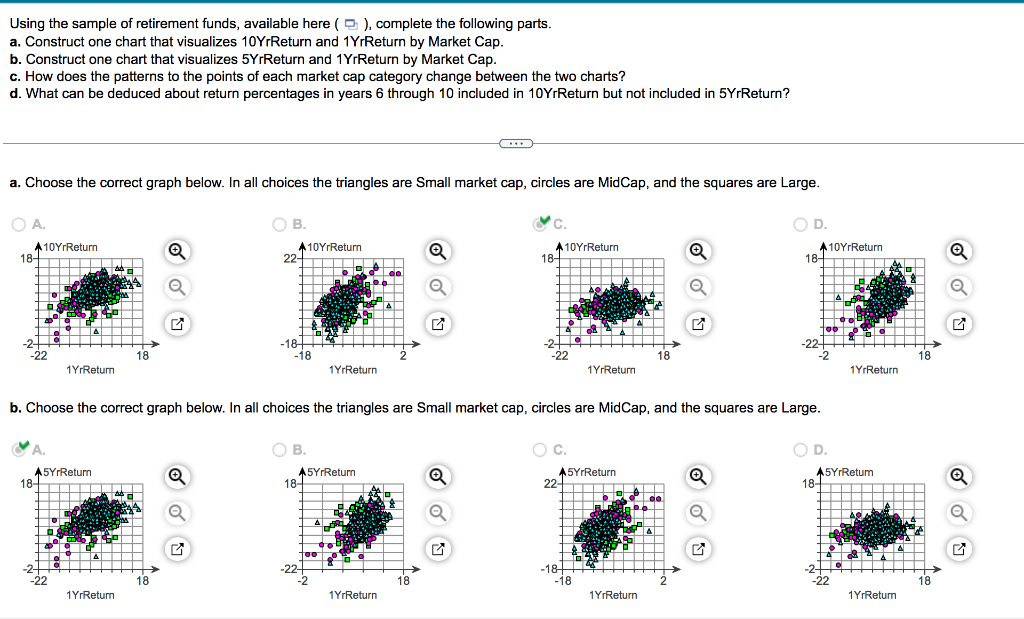
c. The increases more rapidly with in 1YrReturn than the does. In general, the seems more stable than the other, when plotted against the 1YrReturn. The has a lower return amount for all 1 YrReturns. Using the sample of retirement funds, available here ( ), complete the following parts. a. Construct one chart that visualizes 10 YrReturn and 1 YrReturn by Market Cap. b. Construct one chart that visualizes 5 YrReturn and 1 YrReturn by Market Cap. c. How does the patterns to the points of each market cap category change between the two charts? d. What can be deduced about return percentages in years 6 through 10 included in 10 YrReturn but not included in 5 YrReturn? a. Choose the correct graph below. In all choices the triangles are Small market cap, circles are MidCap, and the squares are Large. A. B. C. b. Choose the correct graph below. In all choices the triangles are Small market cap, circles are MidCap, and the squares are Large. A. B. C. c. The increases more rapidly with in 1YrReturn than the does. In general, the seems more stable than the other, when plotted against the 1YrReturn. The has a lower return amount for all 1 YrReturns. Using the sample of retirement funds, available here ( ), complete the following parts. a. Construct one chart that visualizes 10 YrReturn and 1 YrReturn by Market Cap. b. Construct one chart that visualizes 5 YrReturn and 1 YrReturn by Market Cap. c. How does the patterns to the points of each market cap category change between the two charts? d. What can be deduced about return percentages in years 6 through 10 included in 10 YrReturn but not included in 5 YrReturn? a. Choose the correct graph below. In all choices the triangles are Small market cap, circles are MidCap, and the squares are Large. A. B. C. b. Choose the correct graph below. In all choices the triangles are Small market cap, circles are MidCap, and the squares are Large. A. B. C
Step by Step Solution
There are 3 Steps involved in it

Get step-by-step solutions from verified subject matter experts