

Question: Options & volatility analysis Refer to supplement which contains data on call option prices and implied volatilities on the Nasdaq 100 index. The spot reference
Options & volatility analysis
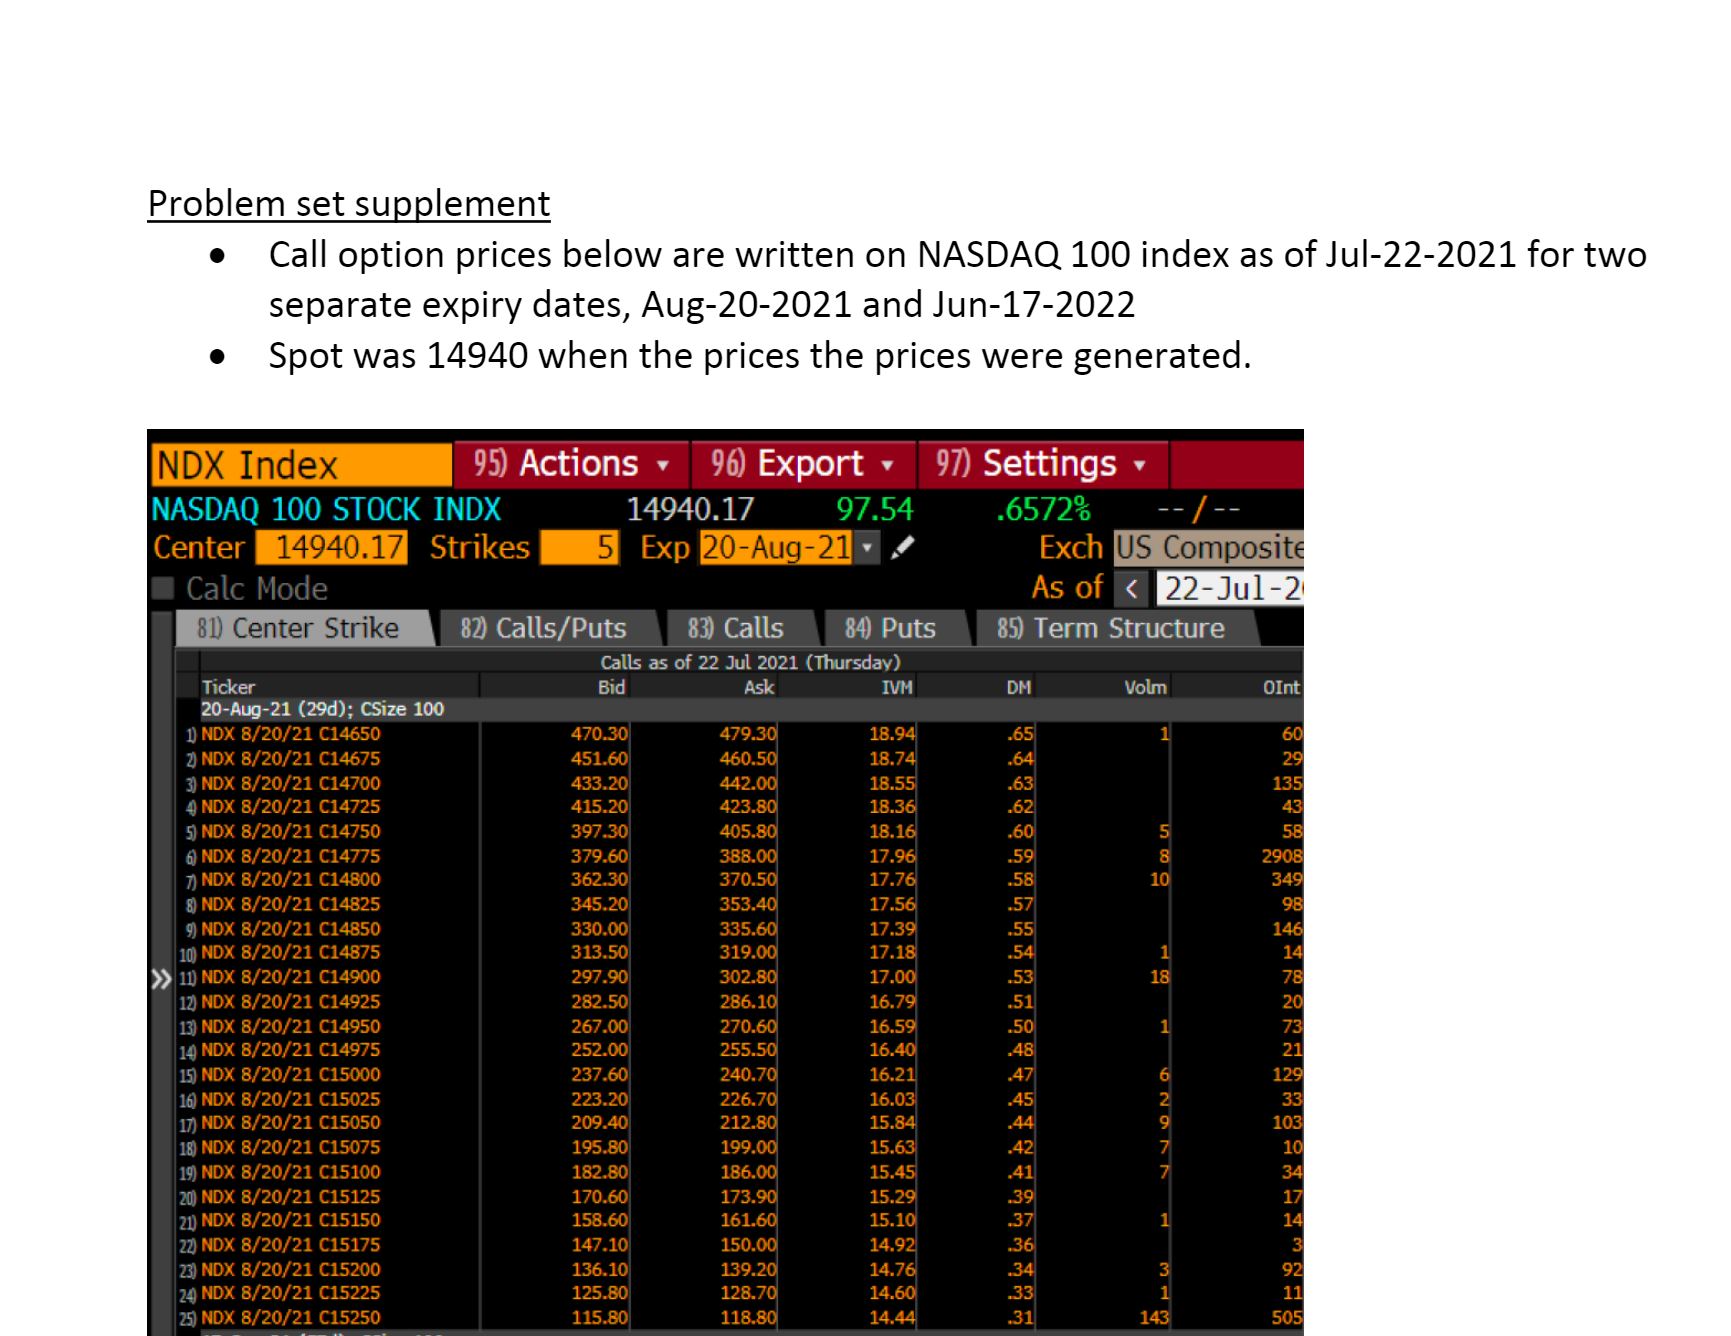
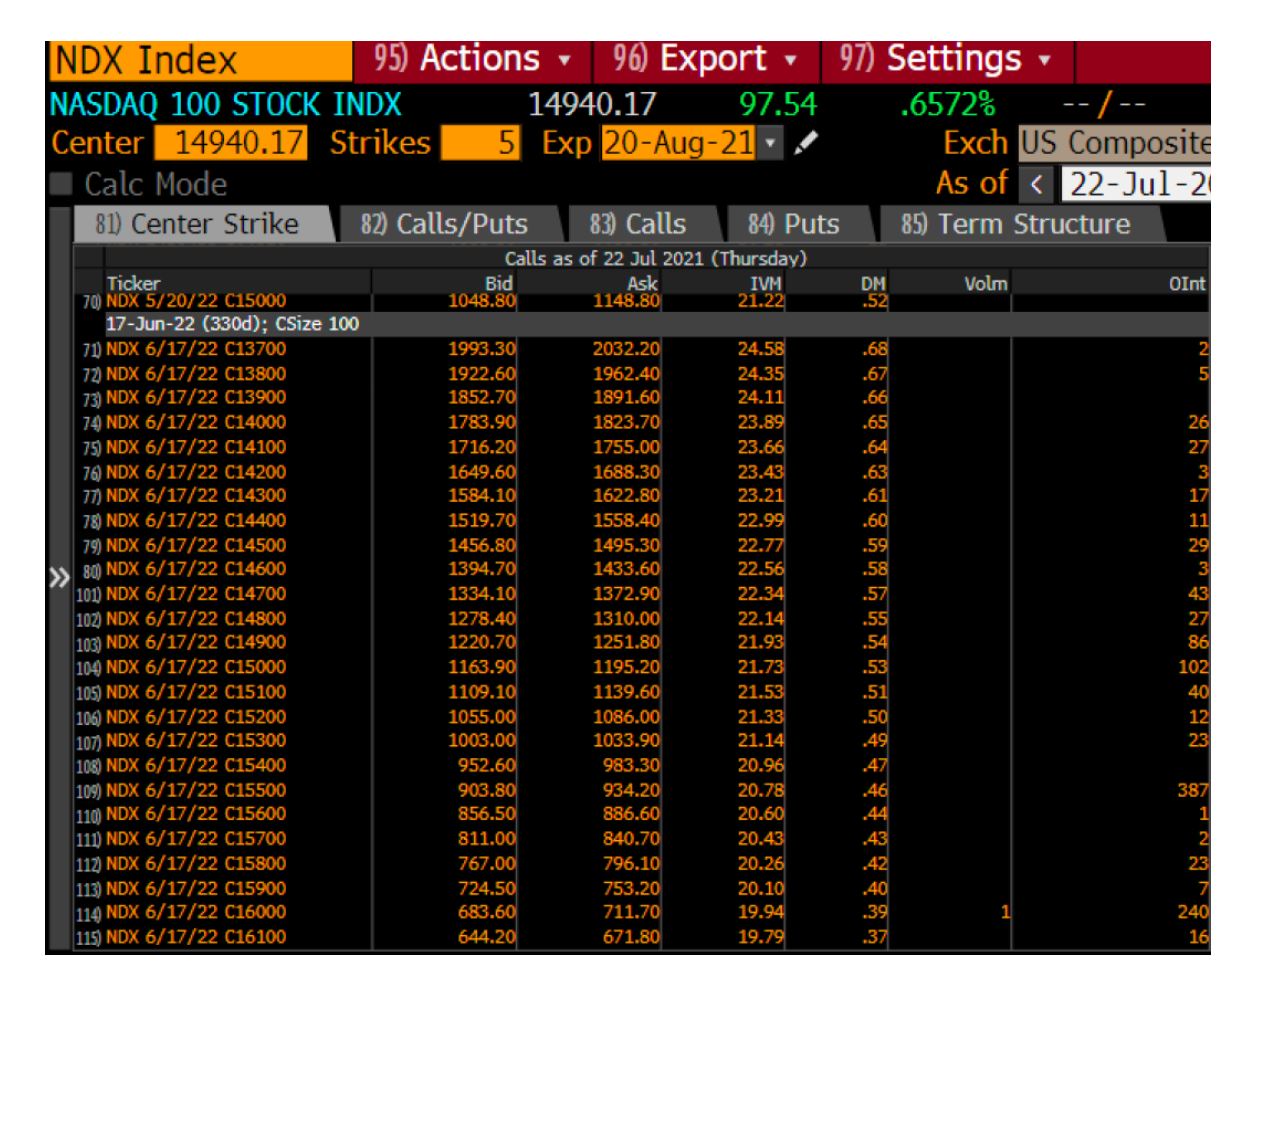
Refer to supplement which contains data on call option prices and implied volatilities on the Nasdaq 100 index. The spot reference rate for all prices is 14940. Each individual option contract is written on 100 shares of stock, at a set strike price, for a given expiration date. These are European-style options which can only be exercised at expiry.
A delta (DM) of 0.50 implies that for a 1% rise in the spot rate,the price of the call option is expected to rise by 0.50%. A delta of -0.50 implies that for a 1% rise in the spot rate, the price of the put option is expected to fall by 0.50%. Implied volatility (IVM), very much like interest rate yield, is always quoted in annualized percentage terms. A reading of 15.00 (i.e. 15%) is equivalent to a 1 standard deviation move on the underlying spot rate over a 1-year period. For interpreting implied volatility or expected standard deviation for a nominal 1-month period, however, the implied volatility must be de-annualized as follows IVd=IV M?112. Similarly, For interpreting implied volatility or expected standard deviation for a nominal 6-month period, however, the implied volatility must be de-annualized as follows IVd=IV M?612, and so on.
Step by Step Solution
There are 3 Steps involved in it

Get step-by-step solutions from verified subject matter experts