

Question: or school performance, a researcher collected data from 120 students. The two-way frequency table shows the number of students who passed and failed an
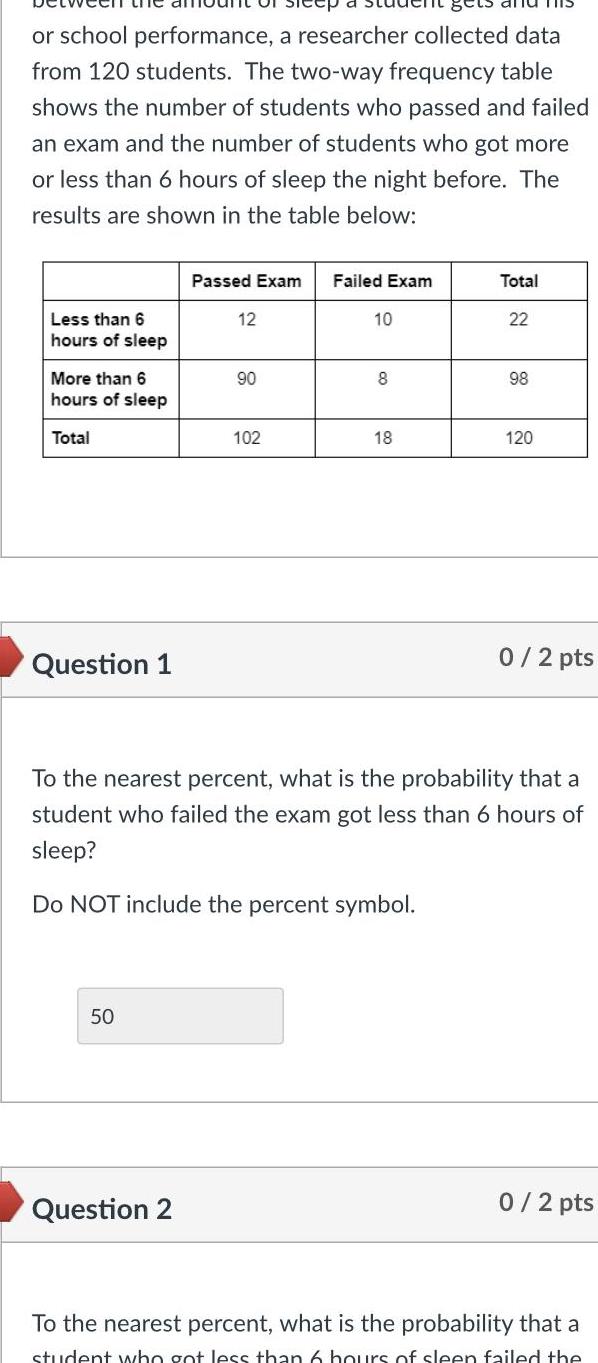
or school performance, a researcher collected data from 120 students. The two-way frequency table shows the number of students who passed and failed an exam and the number of students who got more or less than 6 hours of sleep the night before. The results are shown in the table below: Passed Exam Failed Exam Total Less than 6 12 10 22 hours of sleep More than 6 90 8 98 hours of sleep Total 102 18 120 Question 1 0/2 pts To the nearest percent, what is the probability that a student who failed the exam got less than 6 hours of sleep? Do NOT include the percent symbol. 50 Question 2 0/2 pts To the nearest percent, what is the probability that a student who got less than 6 hours of sleen failed the
Step by Step Solution
There are 3 Steps involved in it

Get step-by-step solutions from verified subject matter experts