

Question: Organic Grains LLC uses statistical process control to ensure that its health conscious, low-fat multigran sandwich loaves have the proper weight Over the past few
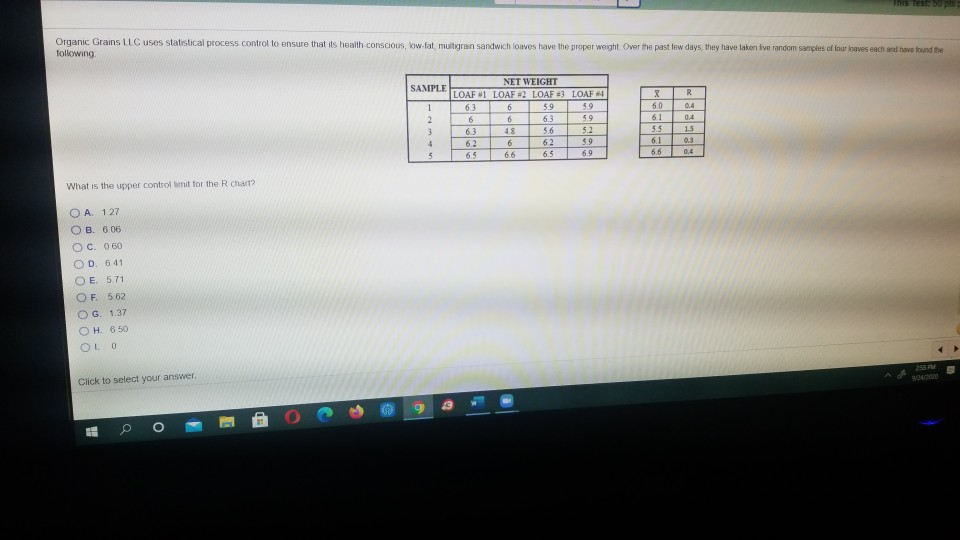
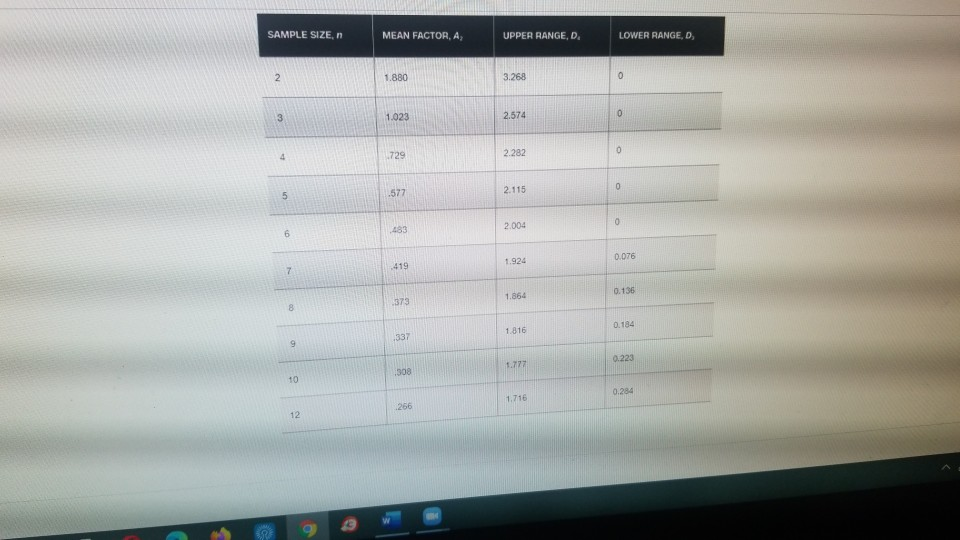
Organic Grains LLC uses statistical process control to ensure that its health conscious, low-fat multigran sandwich loaves have the proper weight Over the past few days, they have taken five random samples of four loaves each and have found the following SAMPLE 1 2 3 NET WEIGHT LOAF W LOAF #2 LOAF :3 LOAF #4 6.3 6 5.9 59 6 6 6.3 59 63 48 5.6 52 62 6 62 5.9 65 66 6.5 6.9 x 6.0 61 5.5 6.1 6.6 R 0.4 0.4 15 0.3 0,4 5 What is the upper controllimit for the R chart? O A 127 OB 6.06 OC 0 60 OD 641 OE 5.71 OF 562 OG 1.37 OH 650 OLD Click to select your answer. E O SAMPLE SIZE, n MEAN FACTOR, A UPPER RANGE, D. LOWER RANGE, D, 2 1.880 3.268 0 3 0 1.023 2.574 0 4 729 2.282 0 5 -577 2.115 0 6 483 2.004 0.076 .419 1.924 7 1.854 0.136 373 8 0.184 1.816 337 9 0.223 1.777 308 10 0.284 1.716 1266 12 2
Step by Step Solution
There are 3 Steps involved in it
1 Expert Approved Answer
Step: 1 Unlock

Question Has Been Solved by an Expert!
Get step-by-step solutions from verified subject matter experts
Step: 2 Unlock
Step: 3 Unlock