

Question: OTHER CONSUMPTION (Dollars per month) B + 10, 20 CB IC BC MILK (Gallons per month) (? OTHER CONSUMPTION (Dollars per month) 6, 32 +
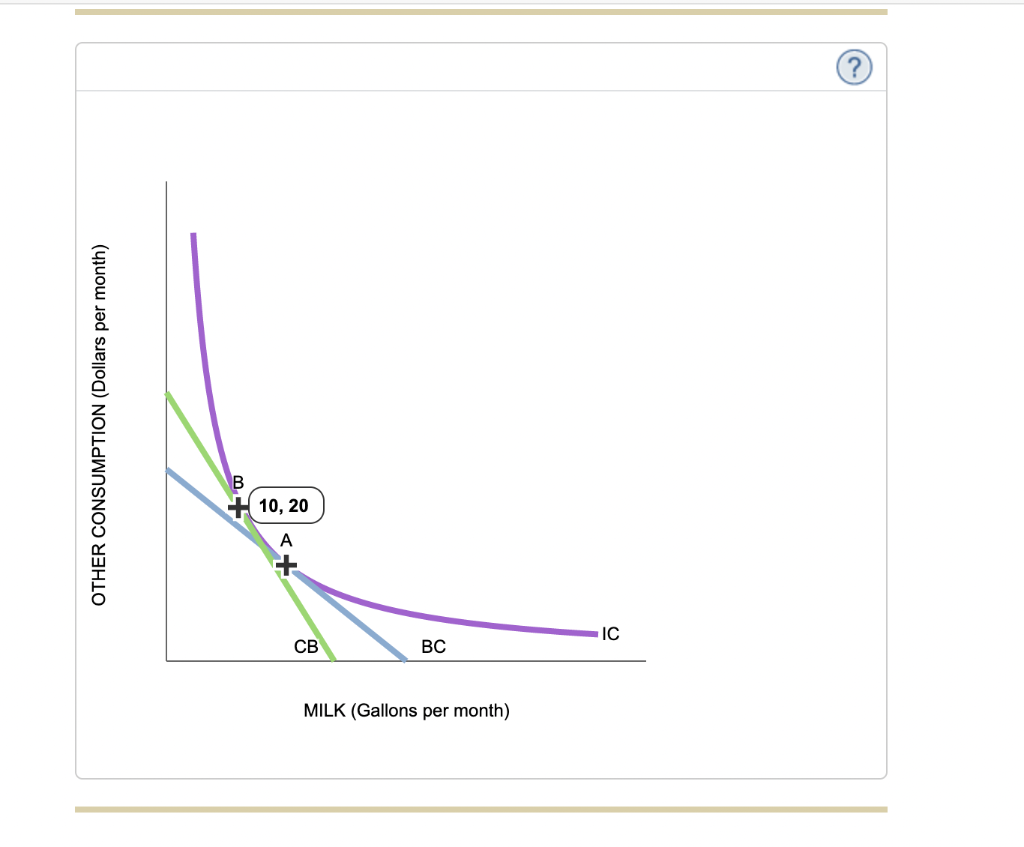
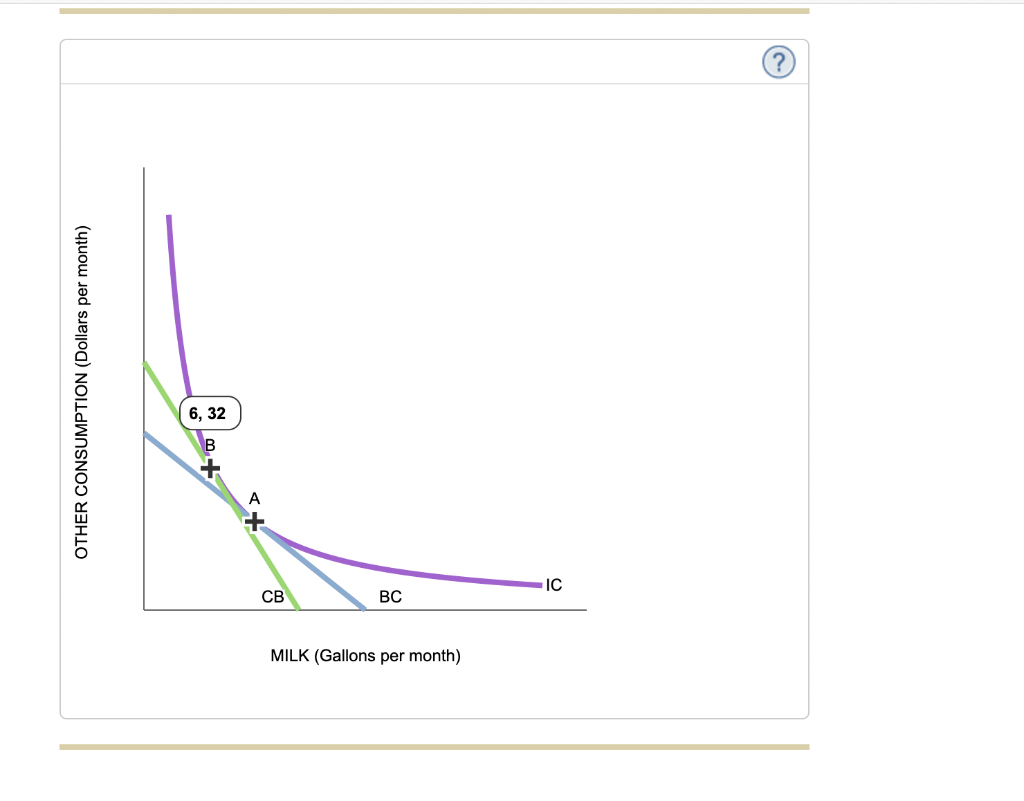
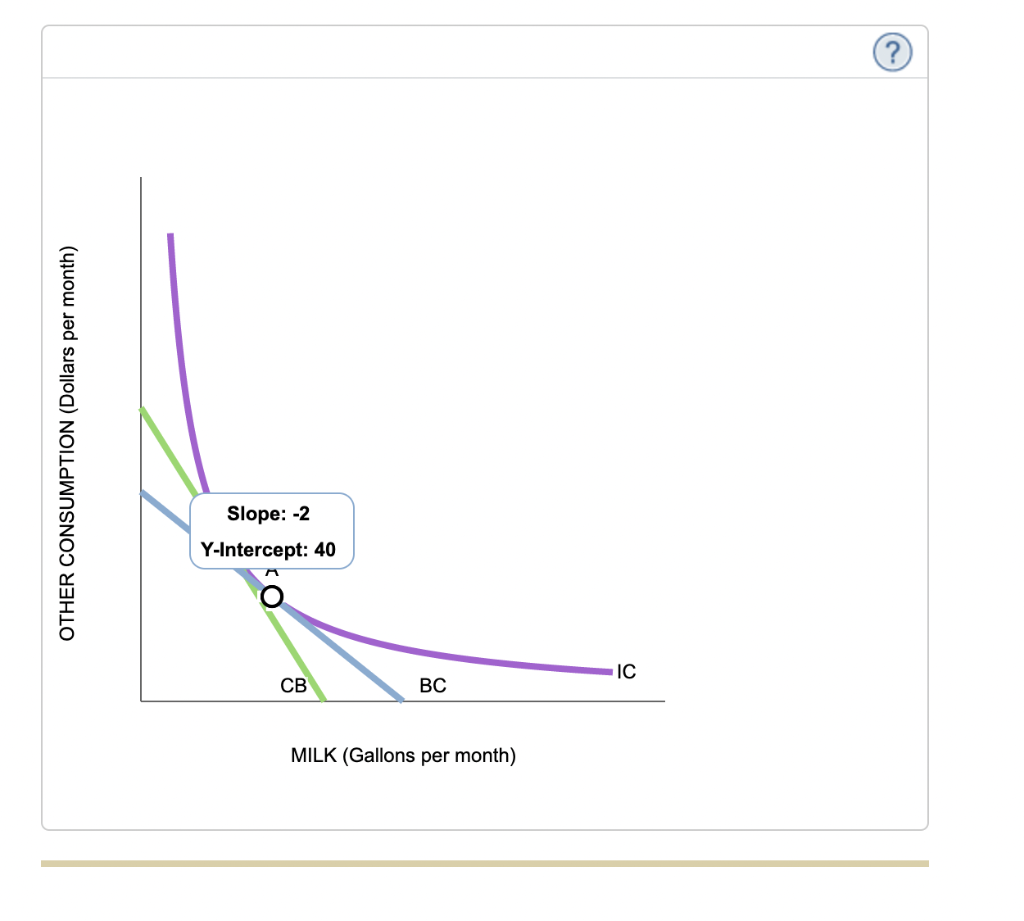
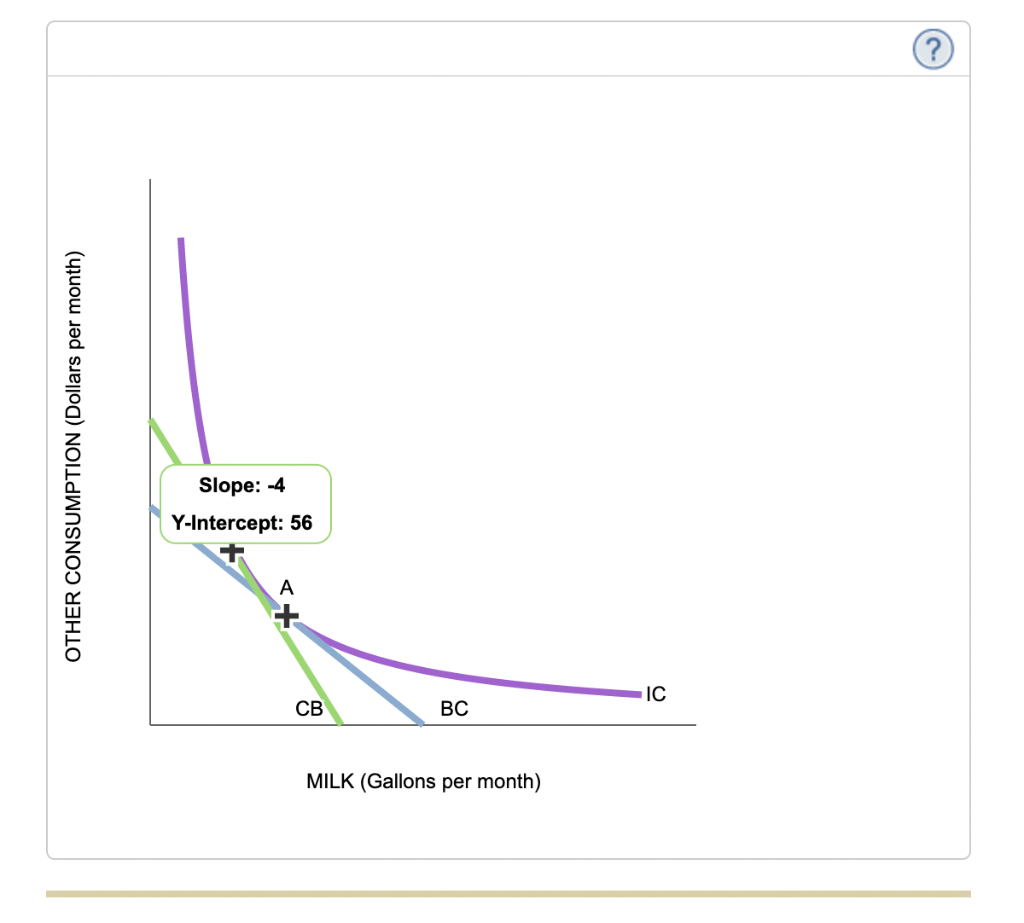
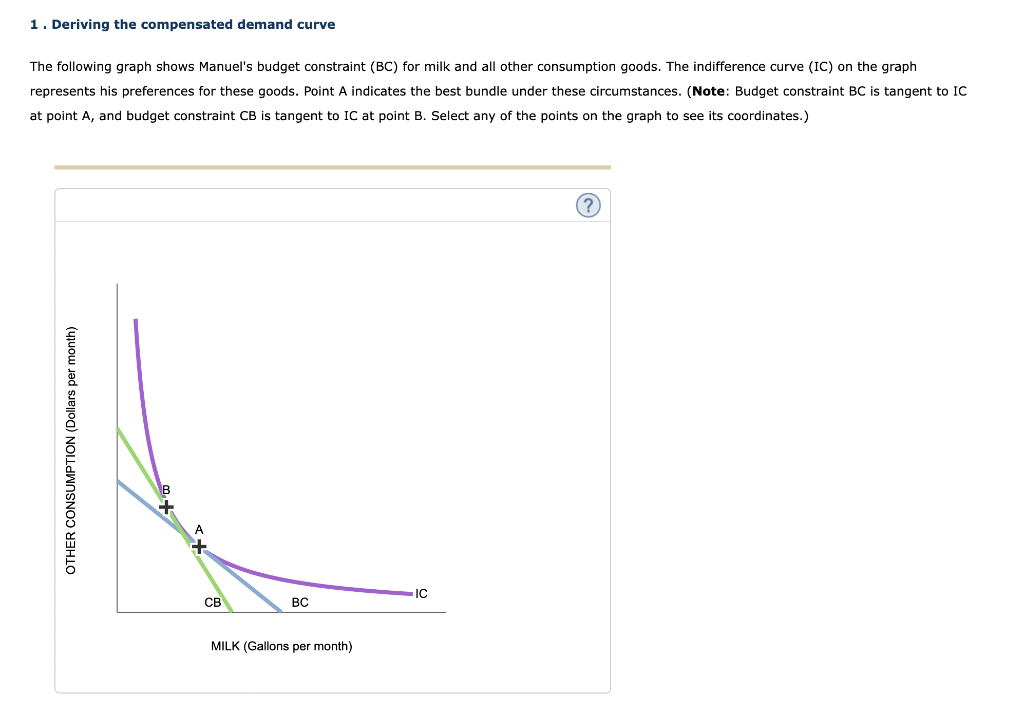
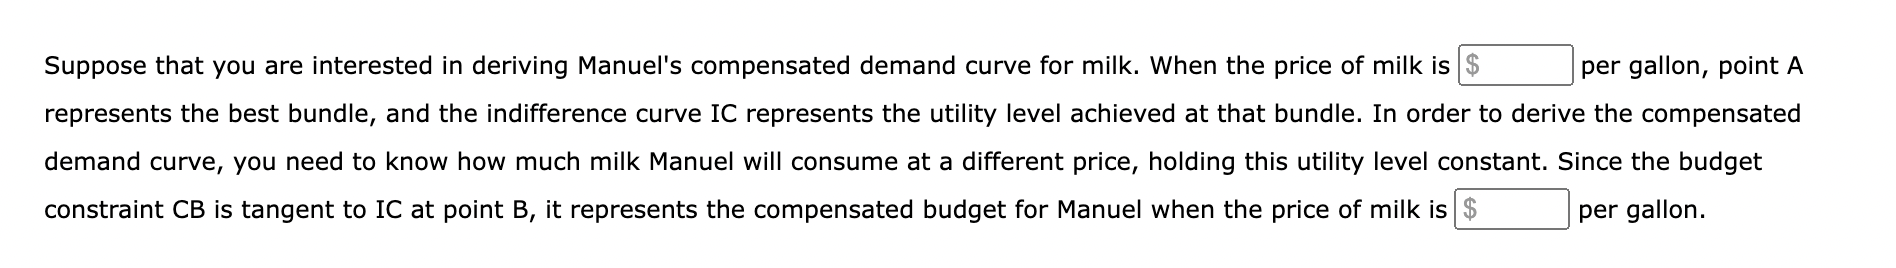
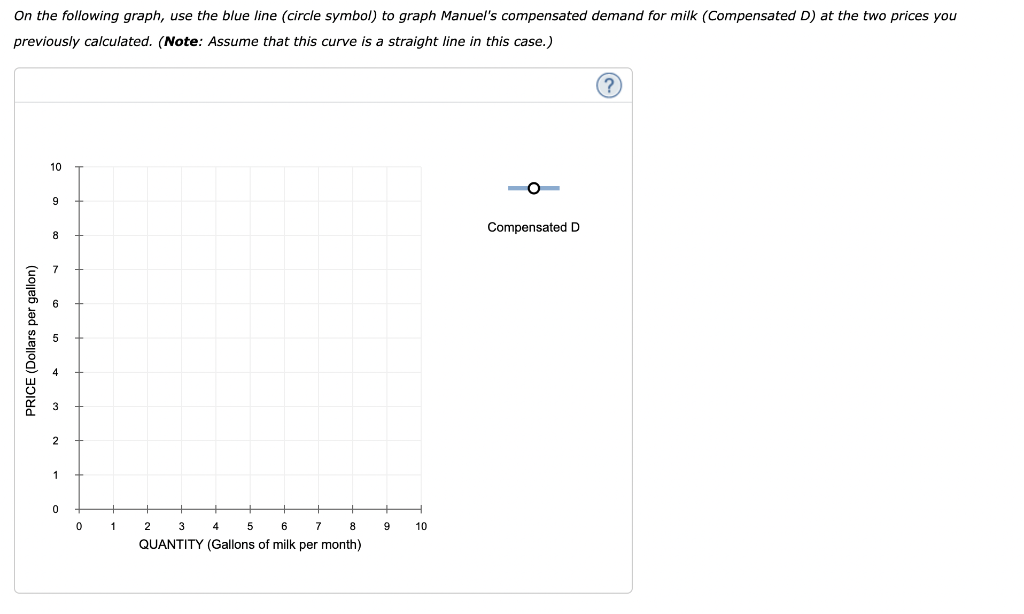

OTHER CONSUMPTION (Dollars per month) B + 10, 20 CB IC BC MILK (Gallons per month) (? OTHER CONSUMPTION (Dollars per month) 6, 32 + A IC CB BC MILK (Gallons per month) OTHER CONSUMPTION (Dollars per month) Slope: -2 Y-Intercept: 40 IC CB BC MILK (Gallons per month) OTHER CONSUMPTION (Dollars per month) Slope: -4 Y-Intercept: 56 A IC CB BC MILK (Gallons per month) 1. Deriving the compensated demand curve The following graph shows Manuel's budget constraint (BC) for milk and all other consumption goods. The indifference curve (IC) on the graph represents his preferences for these goods. Point A indicates the best bundle under these circumstances. (Note: Budget constraint BC is tangent to IC at point A, and budget constraint CB is tangent to IC at point B. Select any of the points on the graph to see its coordinates.) OTHER CONSUMPTION (Dollars per month) IC CB BC MILK (Gallons per month) Suppose that you are interested in deriving Manuel's compensated demand curve for milk. When the price of milk is $ per gallon, point A represents the best bundle, and the indifference curve IC represents the utility level achieved at that bundle. In order to derive the compensated demand curve, you need to know how much milk Manuel will consume at a different price, holding this utility level constant. Since the budget constraint CB is tangent to IC at point B, it represents the compensated budget for Manuel when the price of milk is $ per gallon. On the following graph, use the blue line (circle symbol) to graph Manuel's compensated demand for milk (Compensated D) at the two prices you previously calculated. (Note: Assume that this curve is a straight line in this case.) ? 10 9 Compensated D 8 7 PRICE (Dollars per gallon) 1 0 0 1 9 10 2 3 4 5 6 7 8 QUANTITY (Gallons of milk per month) True or False: Since the compensated demand curve for milk represents Manuel's marginal willingness to pay (MWTP) for milk given a utility level represented by IC, it might be the case the MWTP curve slopes upward. True False Suppose you wanted to derive the compensated demand curve for Manuel at a higher level of utility. On the following graph, show the effect this has on the compensated demand curve you previously derived if milk is a normal good. Compensated D Compensated D If milk is an inferior good, the uncompensated demand curve for milk is the compensated demand for milk
Step by Step Solution
There are 3 Steps involved in it

Get step-by-step solutions from verified subject matter experts