

Question: Other Regression Models Using your calculator or graph paper create a scatter plot of the following data X 4 2 3 5 6 1 4
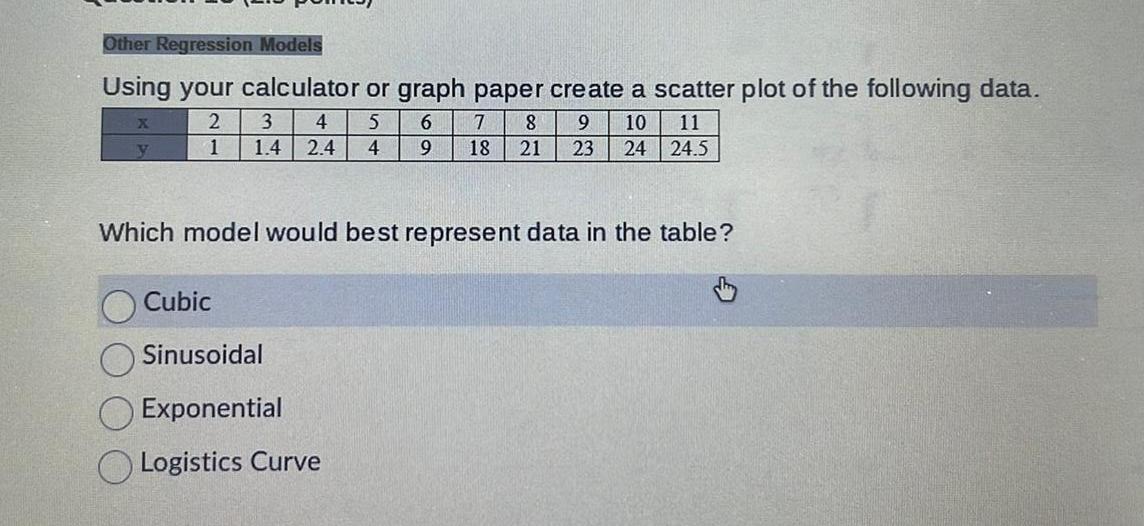

Other Regression Models Using your calculator or graph paper create a scatter plot of the following data X 4 2 3 5 6 1 4 2 4 4 9 1 Which model would best represent data in the table Cubic 7 8 9 10 11 18 21 23 24 24 5 Sinusoidal Exponential Logistics Curve
Step by Step Solution
There are 3 Steps involved in it
1 Expert Approved Answer
Step: 1 Unlock

Question Has Been Solved by an Expert!
Get step-by-step solutions from verified subject matter experts
Step: 2 Unlock
Step: 3 Unlock