

Question: Our course topics: Purpose of Case Study . Use quantitative concepts to perform trade-off analysis on future investment, considering profitability, net present value, and payback.
Our course topics:
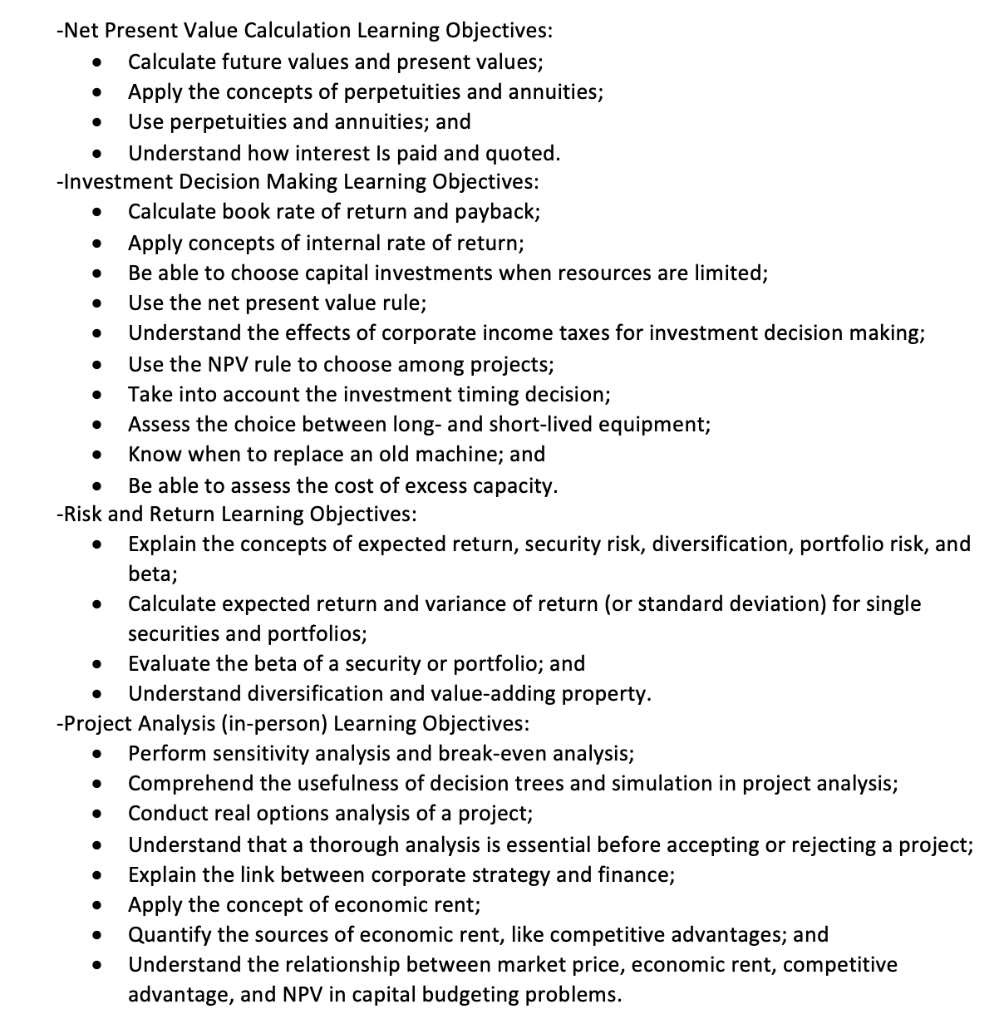
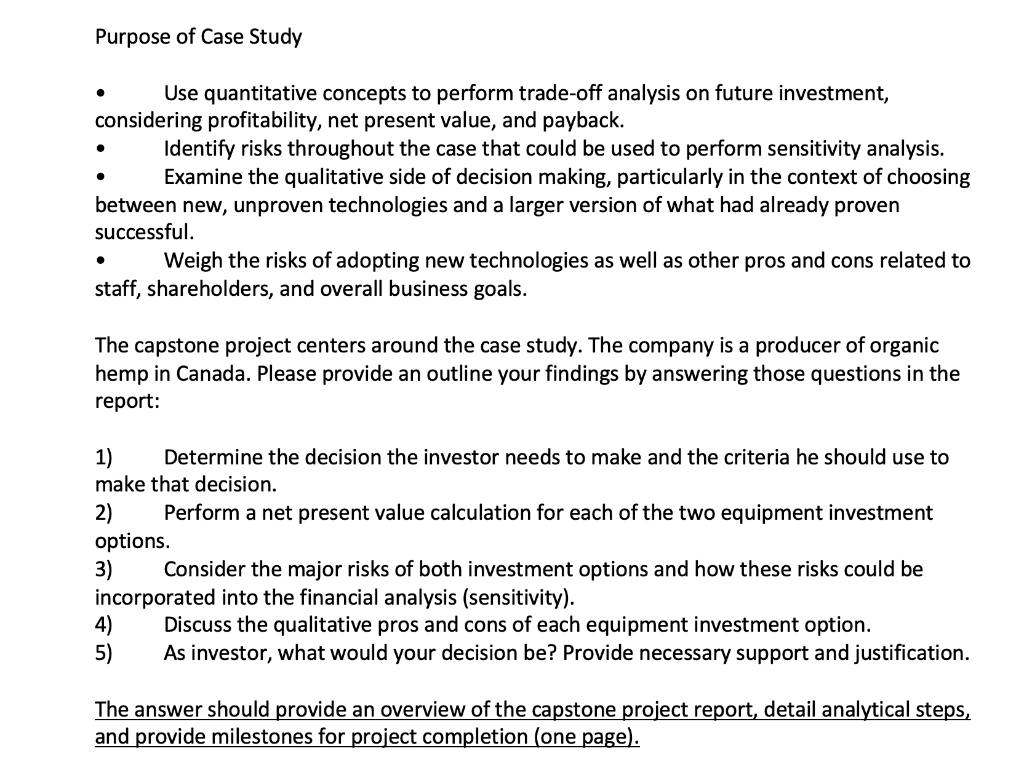
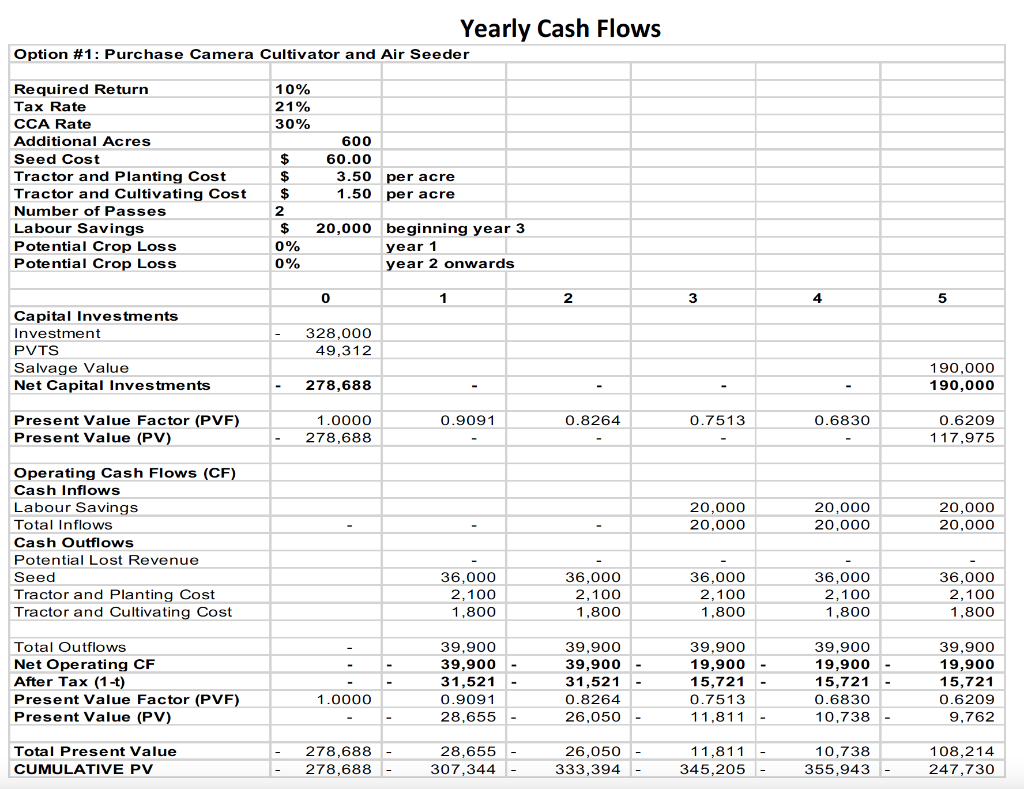
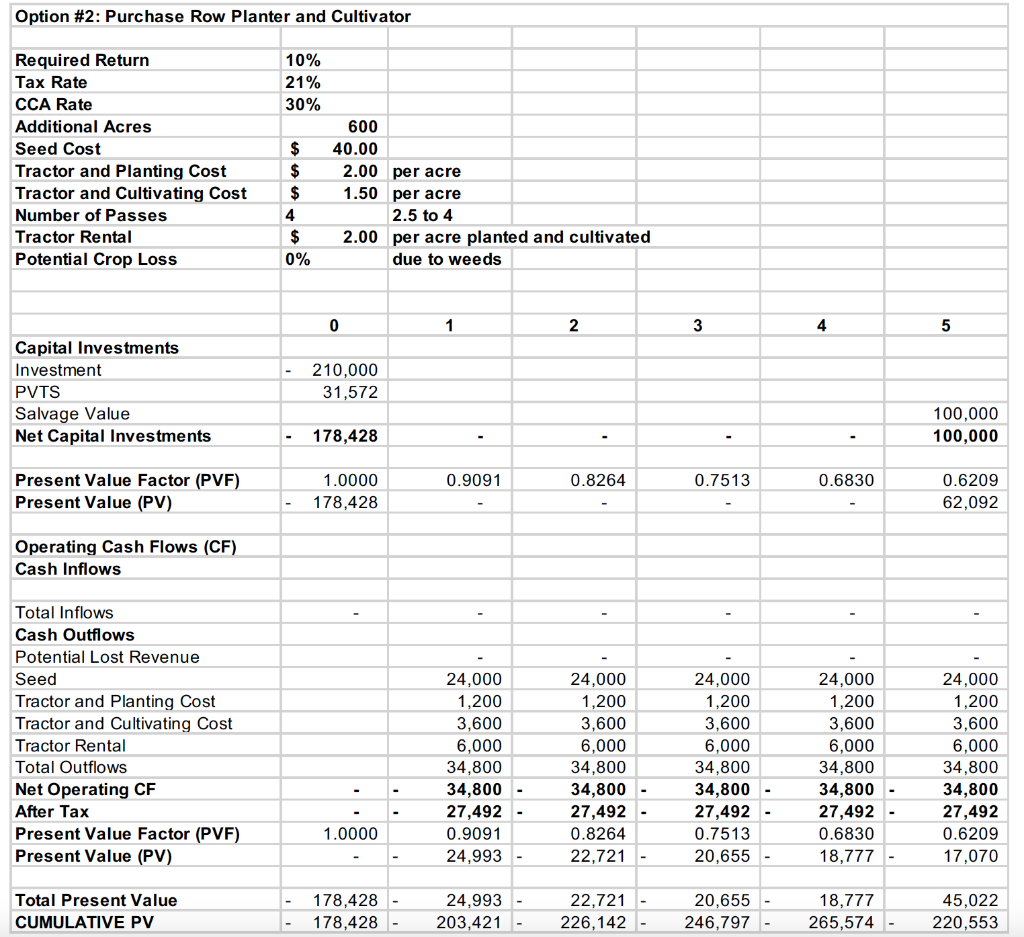
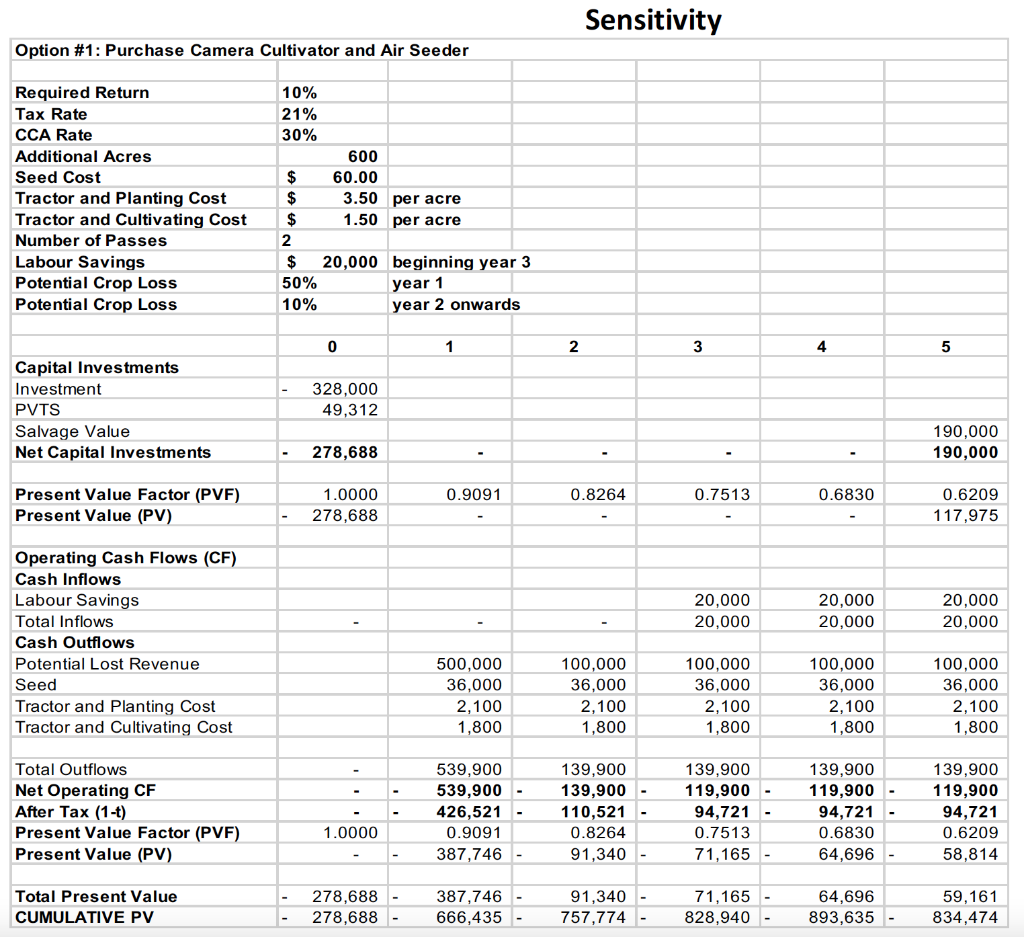
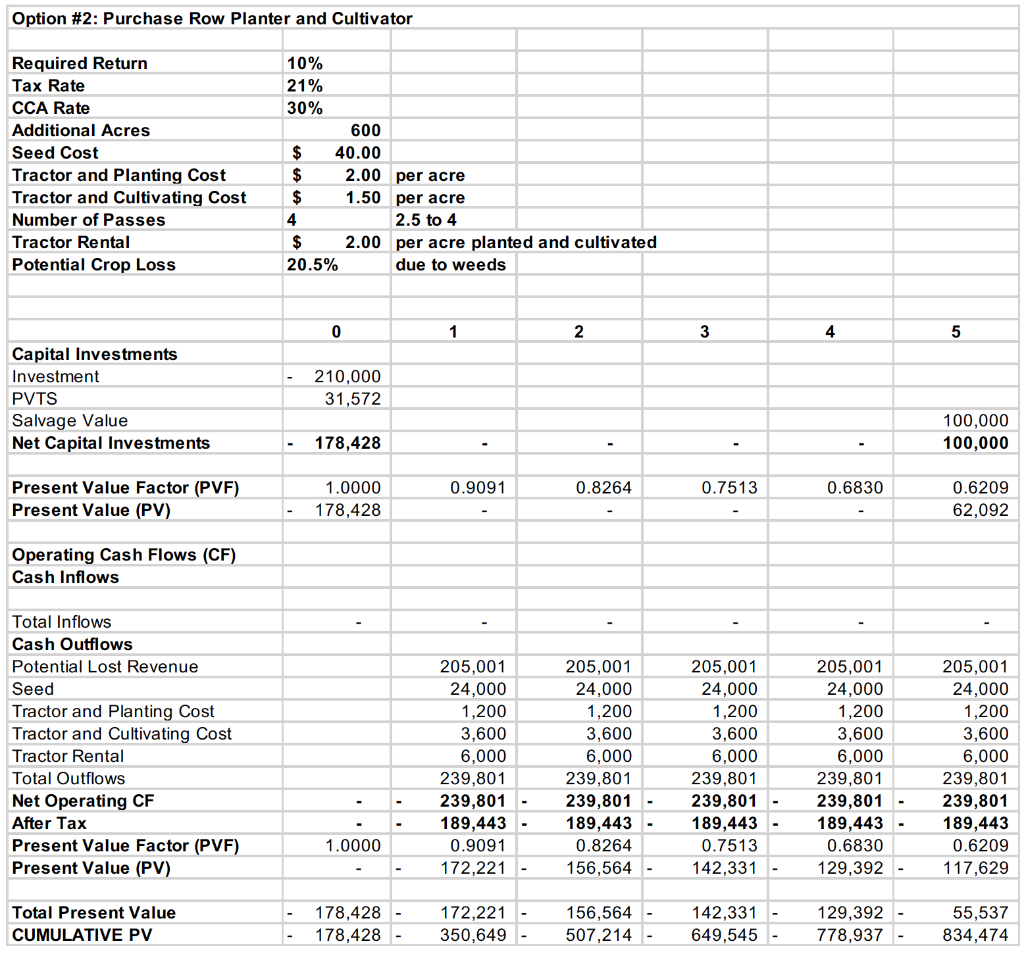
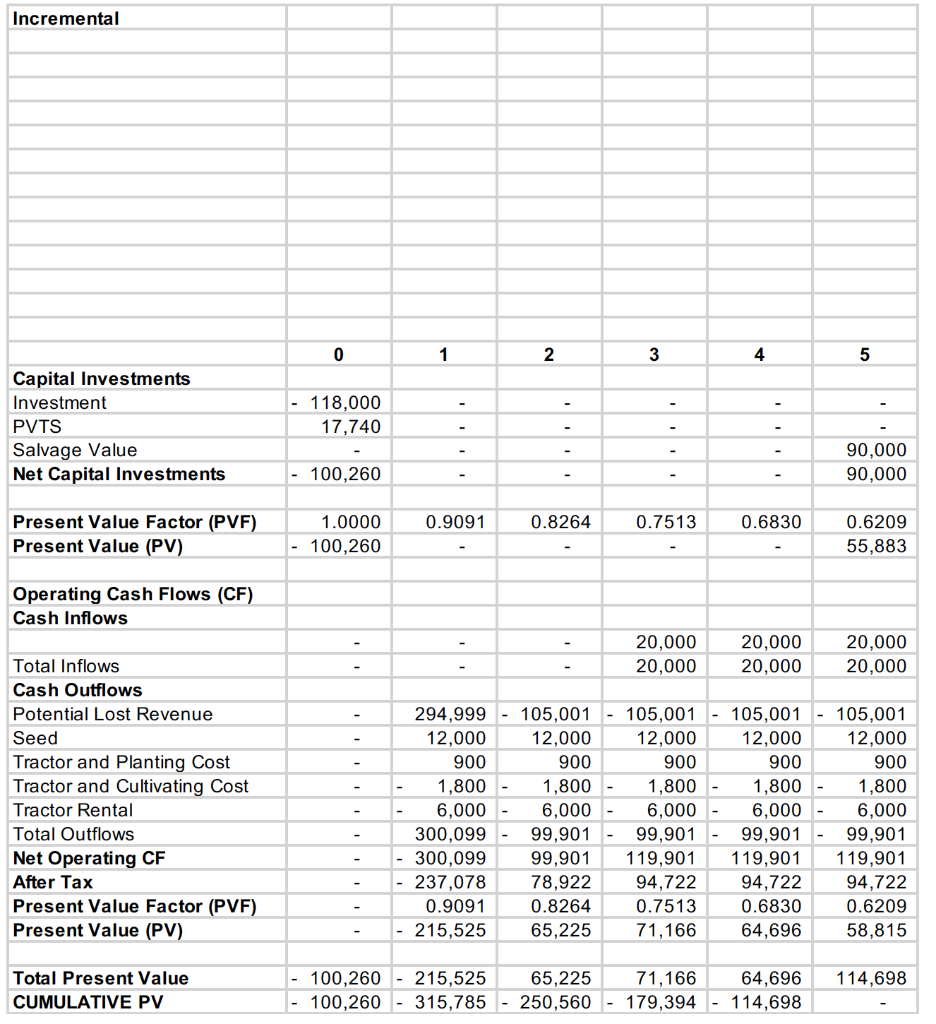
Purpose of Case Study . Use quantitative concepts to perform trade-off analysis on future investment, considering profitability, net present value, and payback. Identify risks throughout the case that could be used to perform sensitivity analysis. Examine the qualitative side of decision making, particularly in the context of choosing between new, unproven technologies and a larger version of what had already proven successful. Weigh the risks of adopting new technologies as well as other pros and cons related to staff, shareholders, and overall business goals. The capstone project centers around the case study. The company is a producer of organic hemp in Canada. Please provide an outline your findings by answering those questions in the report: 1) Determine the decision the investor needs to make and the criteria he should use to make that decision. 2) Perform a net present value calculation for each of the two equipment investment options. 3) Consider the major risks of both investment options and how these risks could be incorporated into the financial analysis (sensitivity). 4) Discuss the qualitative pros and cons of each equipment investment option. 5) As investor, what would your decision be? Provide necessary support and justification. The answer should provide an overview of the capstone project report, detail analytical steps, and provide milestones for project completion (one page). Yearly Cash Flows Option #1: Purchase Camera Cultivator and Air Seeder 10% 21% 30% Required Return Tax Rate CCA Rate Additional Acres Seed Cost Tractor and Planting Cost Tractor and Cultivating Cost Number of Passes Labour Savings Potential Crop Loss Potential Crop Loss 600 60.00 3.50 1.50 per acre per acre $ $ $ 2 $ 0% 0% 20,000 beginning year 3 year 1 year 2 onwards 0 1 2 3 4 5 Capital Investments Investment PVTS Salvage Value Net Capital Investments 328,000 49,312 190,000 190,000 278,688 0.9091 0.8264 0.7513 0.6830 Present Value Factor (PVF) Present Value (PV) 1.0000 278,688 0.6209 117,975 20,000 20,000 20,000 20,000 20,000 20,000 Operating Cash Flows (CF) Cash Inflows Labour Savings Total Inflows Cash Outflows Potential Lost Revenue Seed Tractor and Planting Cost Tractor and Cultivating Cost 36,000 2,100 1,800 36,000 2,100 1.800 36,000 2,100 1,800 36,000 2,100 1,800 36,000 2,100 1,800 Total Outflows Net Operating CF After Tax (1-t) Present Value Factor (PVF) Present Value (PV) 39,900 39,900 31,521 0.9091 28,655 39,900 39,900 31,521 0.8264 26,050 39,900 19,900 15,721 0.7513 11,811 39,900 19,900 15,721 0.6830 10.738 39,900 19,900 15,721 0.6209 9,762 1.0000 Total Present Value CUMULATIVE PV 278,688 278,688 28.655 307,344 26,050 333,394 11,811 345,205 10,738 355,943 108,214 247,730 Option #2: Purchase Row Planter and Cultivator 10% 21% 30% Required Return Tax Rate CCA Rate Additional Acres Seed Cost Tractor and Planting Cost Tractor and Cultivating Cost Number of Passes Tractor Rental Potential Crop Loss $ $ $ 4 $ 0% 600 40.00 2.00 per acre 1.50 per acre 2.5 to 4 2.00 per acre planted and cultivated due to weeds 0 1 2 3 4 5 Capital Investments Investment PVTS Salvage Value Net Capital Investments 210,000 31,572 100,000 100,000 178,428 0.9091 0.8264 0.7513 0.6830 Present Value Factor (PVF) Present Value (PV) 1.0000 178,428 0.6209 62,092 Operating Cash Flows (CF) Cash Inflows Total Inflows Cash Outflows Potential Lost Revenue Seed Tractor and Planting Cost Tractor and Cultivating Cost Tractor Rental Total Outflows Net Operating CF After Tax Present Value Factor (PVF) Present Value (PV) 24,000 1,200 3,600 6,000 34,800 34,800 27,492 0.9091 24,993 24,000 1,200 3,600 6,000 34,800 34,800 27,492 0.8264 22,721 24,000 1,200 3,600 6,000 34,800 34,800 27,492 0.7513 20,655 24,000 1,200 3,600 6,000 34,800 34,800 27,492 0.6830 18,777 24,000 1,200 3,600 6,000 34,800 34,800 27,492 0.6209 17,070 1.0000 Total Present Value CUMULATIVE PV 178,428 178,428 24,993 203,421 22,721 - 226,142 - 20,655 246,797 18,777 265,574 - 45,022 220,553 Incremental 0 1 2 3 4 5 Capital Investments Investment PVTS Salvage Value Net Capital Investments 118,000 17,740 I' 90,000 90,000 100,260 0.9091 0.8264 0.7513 0.6830 Present Value Factor (PVF) Present Value (PV) 1.0000 100,260 0.6209 55,883 Operating Cash Flows (CF) Cash Inflows 20,000 20,000 20,000 20,000 20,000 20,000 Total Inflows Cash Outflows Potential Lost Revenue Seed Tractor and Planting Cost Tractor and Cultivating Cost Tractor Rental Total Outflows Net Operating CF After Tax Present Value Factor (PVF) Present Value (PV) 12,000 900 1,800 6,000 5,100 5,100 4,029 0.9091 3,663 12,000 900 1,800 6,000 5,100 5,100 4,029 0.8264 3,330 12,000 900 1,800 6,000 - 5,100 14,900 11,771 0.7513 8,844 12,000 900 1,800 6,000 5,100 14,900 11,771 0.6830 8,040 12,000 900 1,800 6,000 5,100 14,900 11,771 0.6209 7,309 Total Present Value CUMULATIVE PV 100,260 3,663 3,330 8,844 100,260 - 103,923 - 107,252 - 98,409 8,040 90,369 63,192 27,177 Sensitivity Option #1: Purchase Camera Cultivator and Air Seeder Required Return Tax Rate CCA Rate Additional Acres Seed Cost Tractor and Planting Cost Tractor and Cultivating Cost Number of Passes Labour Savings Potential Crop Loss Potential Crop Loss 10% 21% 30% 600 $ 60.00 $ 3.50 per acre $ 1.50 per acre 2 $ 20,000 beginning year 3 50% year 1 10% year 2 onwards 0 1 2 3 4 5 Capital Investments Investment PVTS Salvage Value Net Capital Investments 328,000 49,312 190,000 190,000 278,688 0.9091 0.8264 0.7513 0.6830 Present Value Factor (PVF) Present Value (PV) 1.0000 278,688 0.6209 117,975 20,000 20,000 20,000 20,000 20.000 20,000 Operating Cash Flows (CF) Cash Inflows Labour Savings Total Inflows Cash Outflows Potential Lost Revenue Seed Tractor and Planting Cost Tractor and Cultivating Cost 500,000 36,000 2,100 1,800 100,000 36,000 2,100 1,800 100,000 36,000 2,100 1,800 100,000 36,000 2,100 1,800 100,000 36,000 2.100 1.800 Total Outflows Net Operating CF After Tax (1-t) Present Value Factor (PVF) Present Value (PV) 539,900 539,900 426,521 0.9091 387,746 139,900 139,900 - 110,521 0.8264 91,340 - 139,900 119,900 94,721 0.7513 71,165 - 139,900 119,900 94,721 0.6830 64,696 139,900 119,900 94,721 0.6209 58,814 1.0000 Total Present Value CUMULATIVE PV 278,688 278,688 387,746 666,435 91,340 757,774 - 71,165 828,940 64,696 893,635 59,161 834,474 Option #2: Purchase Row Planter and Cultivator Required Return Tax Rate CCA Rate Additional Acres Seed Cost Tractor and Planting Cost Tractor and Cultivating Cost Number of Passes Tractor Rental Potential Crop Loss 10% 21% 30% 600 $ 40.00 $ 2.00 per acre $ 1.50 per acre 4 2.5 to 4 $ 2.00 per acre planted and cultivated 20.5% due to weeds 0 1 2 4 5 Capital Investments Investment PVTS Salvage Value Net Capital Investments 210,000 31,572 100,000 100,000 178,428 0.9091 0.8264 0.7513 0.6830 Present Value Factor (PVF) Present Value (PV) 1.0000 178,428 0.6209 62,092 Operating Cash Flows (CF) Cash Inflows Total Inflows Cash Outflows Potential Lost Revenue Seed Tractor and Planting Cost Tractor and Cultivating Cost Tractor Rental Total Outflows Net Operating CF After Tax Present Value Factor (PVF) Present Value (PV) 205,001 24.000 1,200 3,600 6,000 239,801 239,801 189,443 0.9091 172,221 - 205,001 24,000 1,200 3,600 6,000 239,801 239,801 - 189,443 0.8264 156,564 205,001 24,000 1,200 3,600 6,000 239,801 239,801 - 189,443 0.7513 142,331 205,001 24,000 1,200 3,600 6,000 239,801 239,801 - 189,443 0.6830 129,392 205,001 24,000 1,200 3,600 6,000 239,801 239,801 189,443 0.6209 117,629 1.0000 Total Present Value CUMULATIVE PV 178,428 - 178,428 172,221 350,649 156,564 507,214 142,331 649,545 129,392 778,937 55,537 834,474 Incremental 0 1 N 3 4 5 Capital Investments Investment PVTS Salvage Value Net Capital Investments - 118,000 17,740 90,000 90,000 100,260 0.9091 0.8264 0.7513 0.6830 Present Value Factor (PVF) Present Value (PV) 1.0000 100,260 0.6209 55,883 Operating Cash Flows (CF) Cash Inflows 20,000 20,000 20,000 20,000 20,000 20,000 Total Inflows Cash Outflows Potential Lost Revenue Seed Tractor and Planting Cost Tractor and Cultivating Cost Tractor Rental Total Outflows Net Operating CF After Tax Present Value Factor (PVF) Present Value (PV) 294,999 12,000 900 1,800 6,000 300,099 300,099 237,078 0.9091 - 215,525 105,001 - 105,001 - 105,001 12,000 12,000 12,000 900 900 900 1,800 1,800 1,800 6,000 6,000 6,000 99,901 99,901 99,901 99,901 119,901 119,901 78,922 94,722 94,722 0.8264 0.7513 0.6830 65,225 71,166 64,696 105,001 12,000 900 1,800 6,000 99,901 119,901 94,722 0.6209 58,815 114,698 Total Present Value CUMULATIVE PV 100,260 - 215,525 - 100,260 - 315,785 65,225 250,560 71,166 64,696 179,394 - 114,698 . . . . -Net Present Value Calculation Learning Objectives: Calculate future values and present values; Apply the concepts of perpetuities and annuities; Use perpetuities and annuities; and Understand how interest is paid and quoted. -Investment Decision Making Learning Objectives: Calculate book rate of return and payback; Apply concepts of internal rate of return; Be able to choose capital investments when resources are limited; Use the net present value rule; Understand the effects of corporate income taxes for investment decision making; Use the NPV rule to choose among projects; Take into account the investment timing decision; Assess the choice between long- and short-lived equipment; Know when to replace an old machine; and Be able to assess the cost of excess capacity. -Risk and Return Learning Objectives: Explain the concepts of expected return, security risk, diversification, portfolio risk, and beta; Calculate expected return and variance of return (or standard deviation) for single securities and portfolios; Evaluate the beta of a security or portfolio; and Understand diversification and value-adding property. - Project Analysis (in-person) Learning Objectives: Perform sensitivity analysis and break-even analysis; Comprehend the usefulness of decision trees and simulation in project analysis; Conduct real options analysis of a project; Understand that a thorough analysis is essential before accepting or rejecting a project; Explain the link between corporate strategy and finance; Apply the concept of economic rent; Quantify the sources of economic rent, like competitive advantages; and Understand the relationship between market price, economic rent, competitive advantage, and NPV in capital budgeting problems. . Purpose of Case Study . Use quantitative concepts to perform trade-off analysis on future investment, considering profitability, net present value, and payback. Identify risks throughout the case that could be used to perform sensitivity analysis. Examine the qualitative side of decision making, particularly in the context of choosing between new, unproven technologies and a larger version of what had already proven successful. Weigh the risks of adopting new technologies as well as other pros and cons related to staff, shareholders, and overall business goals. The capstone project centers around the case study. The company is a producer of organic hemp in Canada. Please provide an outline your findings by answering those questions in the report: 1) Determine the decision the investor needs to make and the criteria he should use to make that decision. 2) Perform a net present value calculation for each of the two equipment investment options. 3) Consider the major risks of both investment options and how these risks could be incorporated into the financial analysis (sensitivity). 4) Discuss the qualitative pros and cons of each equipment investment option. 5) As investor, what would your decision be? Provide necessary support and justification. The answer should provide an overview of the capstone project report, detail analytical steps, and provide milestones for project completion (one page). Yearly Cash Flows Option #1: Purchase Camera Cultivator and Air Seeder 10% 21% 30% Required Return Tax Rate CCA Rate Additional Acres Seed Cost Tractor and Planting Cost Tractor and Cultivating Cost Number of Passes Labour Savings Potential Crop Loss Potential Crop Loss 600 60.00 3.50 1.50 per acre per acre $ $ $ 2 $ 0% 0% 20,000 beginning year 3 year 1 year 2 onwards 0 1 2 3 4 5 Capital Investments Investment PVTS Salvage Value Net Capital Investments 328,000 49,312 190,000 190,000 278,688 0.9091 0.8264 0.7513 0.6830 Present Value Factor (PVF) Present Value (PV) 1.0000 278,688 0.6209 117,975 20,000 20,000 20,000 20,000 20,000 20,000 Operating Cash Flows (CF) Cash Inflows Labour Savings Total Inflows Cash Outflows Potential Lost Revenue Seed Tractor and Planting Cost Tractor and Cultivating Cost 36,000 2,100 1,800 36,000 2,100 1.800 36,000 2,100 1,800 36,000 2,100 1,800 36,000 2,100 1,800 Total Outflows Net Operating CF After Tax (1-t) Present Value Factor (PVF) Present Value (PV) 39,900 39,900 31,521 0.9091 28,655 39,900 39,900 31,521 0.8264 26,050 39,900 19,900 15,721 0.7513 11,811 39,900 19,900 15,721 0.6830 10.738 39,900 19,900 15,721 0.6209 9,762 1.0000 Total Present Value CUMULATIVE PV 278,688 278,688 28.655 307,344 26,050 333,394 11,811 345,205 10,738 355,943 108,214 247,730 Option #2: Purchase Row Planter and Cultivator 10% 21% 30% Required Return Tax Rate CCA Rate Additional Acres Seed Cost Tractor and Planting Cost Tractor and Cultivating Cost Number of Passes Tractor Rental Potential Crop Loss $ $ $ 4 $ 0% 600 40.00 2.00 per acre 1.50 per acre 2.5 to 4 2.00 per acre planted and cultivated due to weeds 0 1 2 3 4 5 Capital Investments Investment PVTS Salvage Value Net Capital Investments 210,000 31,572 100,000 100,000 178,428 0.9091 0.8264 0.7513 0.6830 Present Value Factor (PVF) Present Value (PV) 1.0000 178,428 0.6209 62,092 Operating Cash Flows (CF) Cash Inflows Total Inflows Cash Outflows Potential Lost Revenue Seed Tractor and Planting Cost Tractor and Cultivating Cost Tractor Rental Total Outflows Net Operating CF After Tax Present Value Factor (PVF) Present Value (PV) 24,000 1,200 3,600 6,000 34,800 34,800 27,492 0.9091 24,993 24,000 1,200 3,600 6,000 34,800 34,800 27,492 0.8264 22,721 24,000 1,200 3,600 6,000 34,800 34,800 27,492 0.7513 20,655 24,000 1,200 3,600 6,000 34,800 34,800 27,492 0.6830 18,777 24,000 1,200 3,600 6,000 34,800 34,800 27,492 0.6209 17,070 1.0000 Total Present Value CUMULATIVE PV 178,428 178,428 24,993 203,421 22,721 - 226,142 - 20,655 246,797 18,777 265,574 - 45,022 220,553 Incremental 0 1 2 3 4 5 Capital Investments Investment PVTS Salvage Value Net Capital Investments 118,000 17,740 I' 90,000 90,000 100,260 0.9091 0.8264 0.7513 0.6830 Present Value Factor (PVF) Present Value (PV) 1.0000 100,260 0.6209 55,883 Operating Cash Flows (CF) Cash Inflows 20,000 20,000 20,000 20,000 20,000 20,000 Total Inflows Cash Outflows Potential Lost Revenue Seed Tractor and Planting Cost Tractor and Cultivating Cost Tractor Rental Total Outflows Net Operating CF After Tax Present Value Factor (PVF) Present Value (PV) 12,000 900 1,800 6,000 5,100 5,100 4,029 0.9091 3,663 12,000 900 1,800 6,000 5,100 5,100 4,029 0.8264 3,330 12,000 900 1,800 6,000 - 5,100 14,900 11,771 0.7513 8,844 12,000 900 1,800 6,000 5,100 14,900 11,771 0.6830 8,040 12,000 900 1,800 6,000 5,100 14,900 11,771 0.6209 7,309 Total Present Value CUMULATIVE PV 100,260 3,663 3,330 8,844 100,260 - 103,923 - 107,252 - 98,409 8,040 90,369 63,192 27,177 Sensitivity Option #1: Purchase Camera Cultivator and Air Seeder Required Return Tax Rate CCA Rate Additional Acres Seed Cost Tractor and Planting Cost Tractor and Cultivating Cost Number of Passes Labour Savings Potential Crop Loss Potential Crop Loss 10% 21% 30% 600 $ 60.00 $ 3.50 per acre $ 1.50 per acre 2 $ 20,000 beginning year 3 50% year 1 10% year 2 onwards 0 1 2 3 4 5 Capital Investments Investment PVTS Salvage Value Net Capital Investments 328,000 49,312 190,000 190,000 278,688 0.9091 0.8264 0.7513 0.6830 Present Value Factor (PVF) Present Value (PV) 1.0000 278,688 0.6209 117,975 20,000 20,000 20,000 20,000 20.000 20,000 Operating Cash Flows (CF) Cash Inflows Labour Savings Total Inflows Cash Outflows Potential Lost Revenue Seed Tractor and Planting Cost Tractor and Cultivating Cost 500,000 36,000 2,100 1,800 100,000 36,000 2,100 1,800 100,000 36,000 2,100 1,800 100,000 36,000 2,100 1,800 100,000 36,000 2.100 1.800 Total Outflows Net Operating CF After Tax (1-t) Present Value Factor (PVF) Present Value (PV) 539,900 539,900 426,521 0.9091 387,746 139,900 139,900 - 110,521 0.8264 91,340 - 139,900 119,900 94,721 0.7513 71,165 - 139,900 119,900 94,721 0.6830 64,696 139,900 119,900 94,721 0.6209 58,814 1.0000 Total Present Value CUMULATIVE PV 278,688 278,688 387,746 666,435 91,340 757,774 - 71,165 828,940 64,696 893,635 59,161 834,474 Option #2: Purchase Row Planter and Cultivator Required Return Tax Rate CCA Rate Additional Acres Seed Cost Tractor and Planting Cost Tractor and Cultivating Cost Number of Passes Tractor Rental Potential Crop Loss 10% 21% 30% 600 $ 40.00 $ 2.00 per acre $ 1.50 per acre 4 2.5 to 4 $ 2.00 per acre planted and cultivated 20.5% due to weeds 0 1 2 4 5 Capital Investments Investment PVTS Salvage Value Net Capital Investments 210,000 31,572 100,000 100,000 178,428 0.9091 0.8264 0.7513 0.6830 Present Value Factor (PVF) Present Value (PV) 1.0000 178,428 0.6209 62,092 Operating Cash Flows (CF) Cash Inflows Total Inflows Cash Outflows Potential Lost Revenue Seed Tractor and Planting Cost Tractor and Cultivating Cost Tractor Rental Total Outflows Net Operating CF After Tax Present Value Factor (PVF) Present Value (PV) 205,001 24.000 1,200 3,600 6,000 239,801 239,801 189,443 0.9091 172,221 - 205,001 24,000 1,200 3,600 6,000 239,801 239,801 - 189,443 0.8264 156,564 205,001 24,000 1,200 3,600 6,000 239,801 239,801 - 189,443 0.7513 142,331 205,001 24,000 1,200 3,600 6,000 239,801 239,801 - 189,443 0.6830 129,392 205,001 24,000 1,200 3,600 6,000 239,801 239,801 189,443 0.6209 117,629 1.0000 Total Present Value CUMULATIVE PV 178,428 - 178,428 172,221 350,649 156,564 507,214 142,331 649,545 129,392 778,937 55,537 834,474 Incremental 0 1 N 3 4 5 Capital Investments Investment PVTS Salvage Value Net Capital Investments - 118,000 17,740 90,000 90,000 100,260 0.9091 0.8264 0.7513 0.6830 Present Value Factor (PVF) Present Value (PV) 1.0000 100,260 0.6209 55,883 Operating Cash Flows (CF) Cash Inflows 20,000 20,000 20,000 20,000 20,000 20,000 Total Inflows Cash Outflows Potential Lost Revenue Seed Tractor and Planting Cost Tractor and Cultivating Cost Tractor Rental Total Outflows Net Operating CF After Tax Present Value Factor (PVF) Present Value (PV) 294,999 12,000 900 1,800 6,000 300,099 300,099 237,078 0.9091 - 215,525 105,001 - 105,001 - 105,001 12,000 12,000 12,000 900 900 900 1,800 1,800 1,800 6,000 6,000 6,000 99,901 99,901 99,901 99,901 119,901 119,901 78,922 94,722 94,722 0.8264 0.7513 0.6830 65,225 71,166 64,696 105,001 12,000 900 1,800 6,000 99,901 119,901 94,722 0.6209 58,815 114,698 Total Present Value CUMULATIVE PV 100,260 - 215,525 - 100,260 - 315,785 65,225 250,560 71,166 64,696 179,394 - 114,698 . . . . -Net Present Value Calculation Learning Objectives: Calculate future values and present values; Apply the concepts of perpetuities and annuities; Use perpetuities and annuities; and Understand how interest is paid and quoted. -Investment Decision Making Learning Objectives: Calculate book rate of return and payback; Apply concepts of internal rate of return; Be able to choose capital investments when resources are limited; Use the net present value rule; Understand the effects of corporate income taxes for investment decision making; Use the NPV rule to choose among projects; Take into account the investment timing decision; Assess the choice between long- and short-lived equipment; Know when to replace an old machine; and Be able to assess the cost of excess capacity. -Risk and Return Learning Objectives: Explain the concepts of expected return, security risk, diversification, portfolio risk, and beta; Calculate expected return and variance of return (or standard deviation) for single securities and portfolios; Evaluate the beta of a security or portfolio; and Understand diversification and value-adding property. - Project Analysis (in-person) Learning Objectives: Perform sensitivity analysis and break-even analysis; Comprehend the usefulness of decision trees and simulation in project analysis; Conduct real options analysis of a project; Understand that a thorough analysis is essential before accepting or rejecting a project; Explain the link between corporate strategy and finance; Apply the concept of economic rent; Quantify the sources of economic rent, like competitive advantages; and Understand the relationship between market price, economic rent, competitive advantage, and NPV in capital budgeting problems
Step by Step Solution
There are 3 Steps involved in it

Get step-by-step solutions from verified subject matter experts