

Question: Output and MatLAB code needed. Will give thumbs up for correct answers. Part B: Analyzing the Yearly Average Temperature Data Implement the first problem in
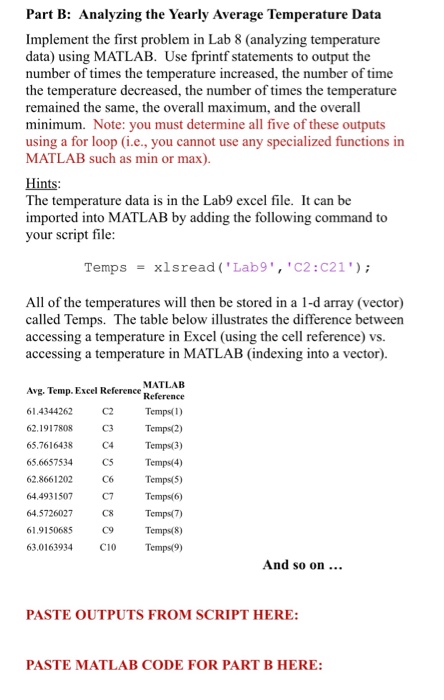
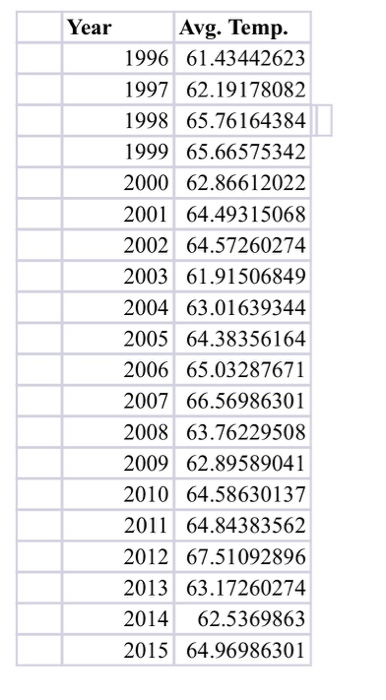
Part B: Analyzing the Yearly Average Temperature Data Implement the first problem in Lab 8 (analyzing temperature data) using MATLAB. Use fprintf statements to output the number of times the temperature i the temperature decreased, the number of times the temperature remained the same, the overall maximum, and the overall minimum. Note: you must determine all five of these outputs using a for loop (i.e., you cannot use any specialized functions in MATLAB such as min or max) Hints The temperature data is in the Lab9 excel file. It can be imported into MATLAB by adding the following command to your script file increased, the number of time Temps xls read ( ' Lab9" , ' C2 : C21" ) ; All of the temperatures will then be stored in a 1-d array (vector) called Temps. The table below illustrates the difference between accessing a temperature in accessing a temperature in MATLAB (indexing into a vector) Excel (using the cell reference) vs. Avg. Temp. Excel Reference 61.4344262 62.1917808 65.7616438 65.6657534 62.8661202 64.4931507 64.5726027 61,9150685 63.0163934 MATLAB Reference Temps(I) C3 Temps(2) C4 Temps(3) Temps(4) Temps(5) Temps/(6) C8 Temps(7) Temps(8) Temps(9) C2 C5 C6 C7 C9 C10 And so on PASTE OUTPUTS FROM SCRIPT HERE: PASTE MATLAB CODE FOR PART B HERE
Step by Step Solution
There are 3 Steps involved in it

Get step-by-step solutions from verified subject matter experts