

Question: Outrageous Bubbles, Inc., produces a multicolored bubble solution used for weddings and other events. Outrageous Bubbles' plant capacity is 62,500 kits. If the actual volume
Outrageous Bubbles, Inc., produces a multicolored bubble solution used for weddings and other events.
Outrageous Bubbles' plant capacity is 62,500 kits. If the actual volume exceeds 62,500 kits, the company must expand the plant. In that case, salaries will increase by 10%, depreciation by 15%, and rent by $4000. Fixed utilities will be unchanged by any volume increase.
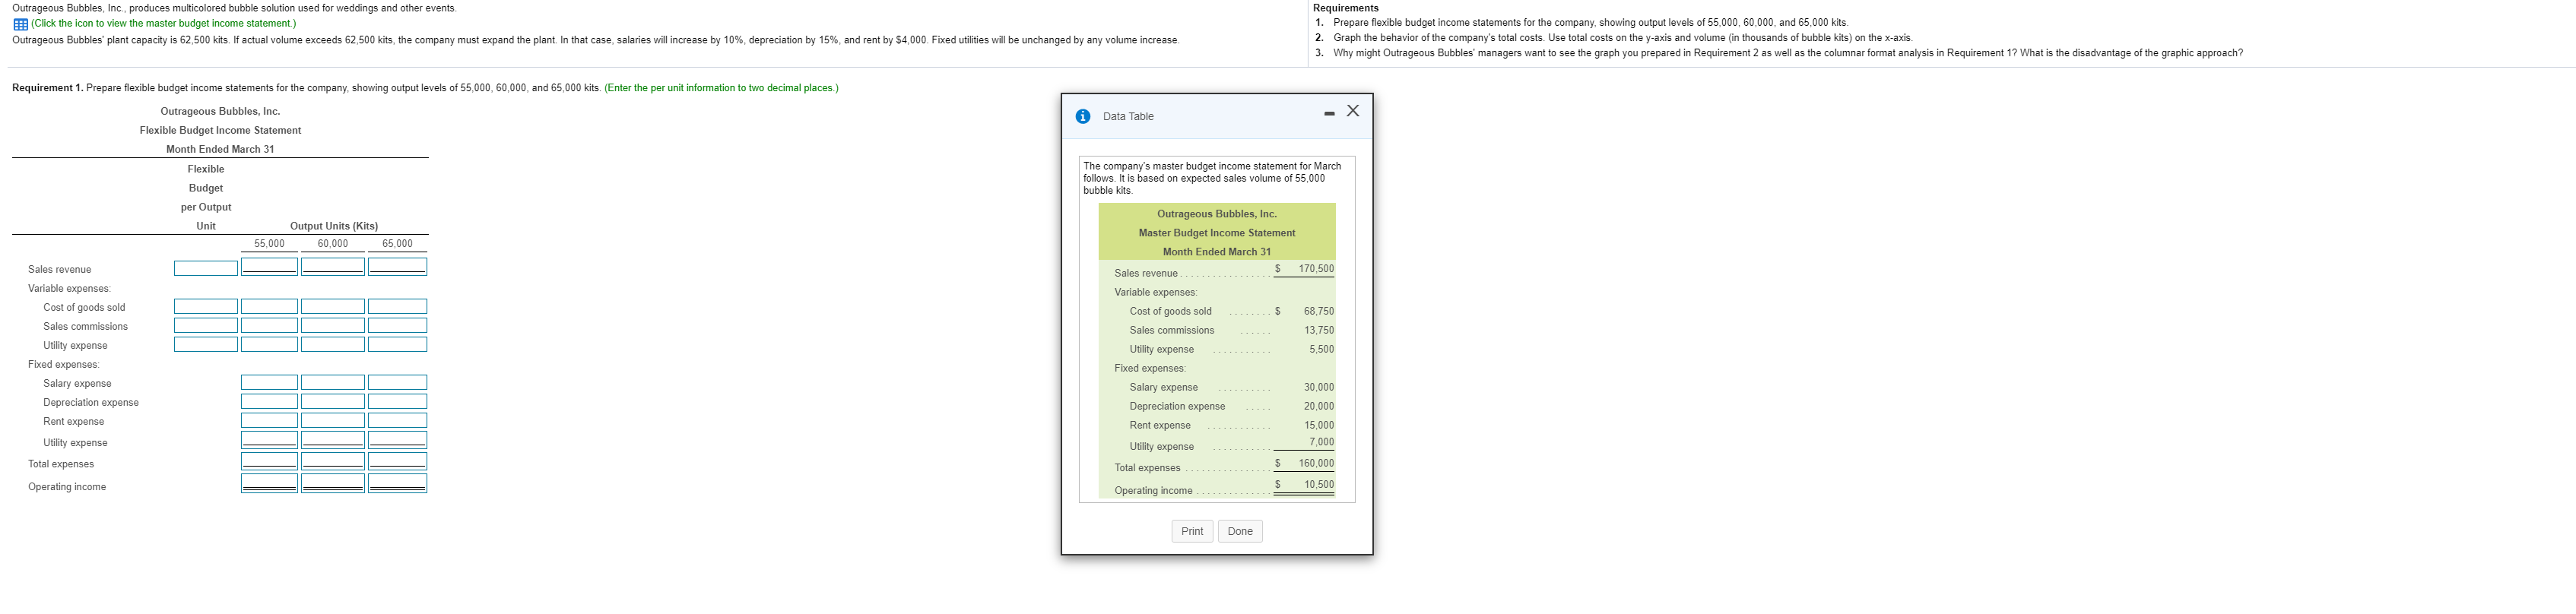
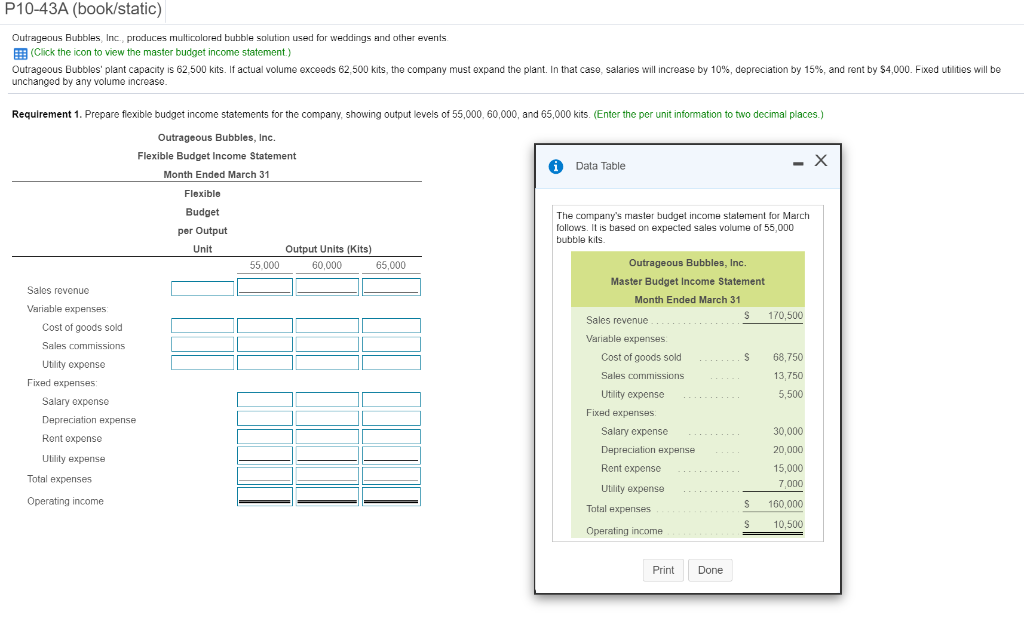
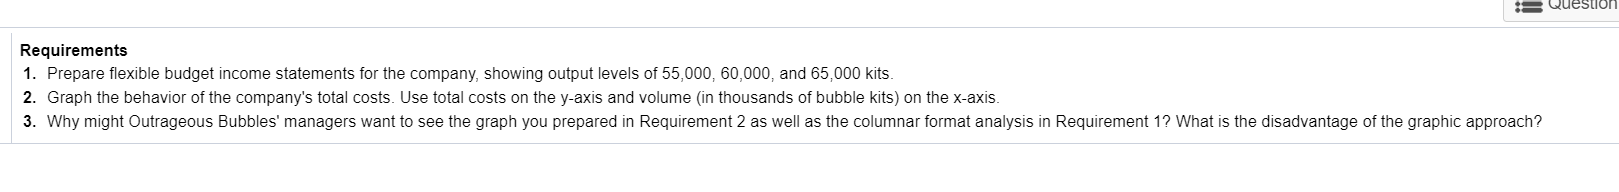
Outrageous Bubbles, Inc., produces multicolored bubble solution used for weddings and other events. Click the icon to view the master budget income statement.) Outrageous Bubbles' plant capacity is 62,500 kits. If actual volume exceeds 62,500 kits, the company must expand the plant. In that case, salaries will increase by 10%, depreciation by 15%, and rent by $4,000. Fixed utilities will be unchanged by any volume increase. Requirements 1. Prepare flexible budget income statements for the company, showing output levels of 55,000, 60,000, and 65,000 kits. 2. Graph the behavior of the company's total costs. Use total costs on the y-axis and volume (in thousands of bubble kits) on the x-axis. 3. Why might Outrageous Bubbles' managers want to see the graph you prepared in Requirement 2 as well as the columnar format analysis in Requirement 1? What is the disadvantage of the graphic approach? Requirement 1. Prepare flexible budget income statements for the company, showing output levels of 55,000, 60,000, and 65,000 kits. (Enter the per unit information to two decimal places.) Data Table x Outrageous Bubbles, Inc. Flexible Budget Income Statement Month Ended March 31 Flexible The company's master budget income statement for March follows. It is based on expected sales volume of 55,000 bubble kits Budget per Output Unit Output Units (Kits) 60,000 65,000 55.000 Outrageous Bubbles, Inc. Master Budget Income Statement Month Ended March 31 Sales revenue $ 170,500 Variable expenses Cost of goods sold $ 68,750 Sales commissions 13,750 Sales revenue Variable expenses: Cost of goods sold Sales commissions Utility expense Fixed expenses: Salary expense Depreciation expense Rent expense 5,500 30,000 Utility expense Fixed expenses Salary expense Depreciation expense Rent expense Utility expense 20,000 15,000 Utility expense 7,000 Total expenses $ Total expenses 160.000 Operating income $ 10,500 Operating income Print Done P10-43A (book/static) Outrageous Bubbles, Inc. produces multicolored bubble solution used for weddings and other events B (Click the icon to view the master budget income statement.) Outrageous Bubbles' plant capacity is 62,500 kits. If actual volume exceeds 62.500 kits, the company must expand the plant. In that case, salaries will increase by 10%, depreciation by 15%, and rent by $4,000. Fixed utilities will be unchanged by any volumo increase Requirement 1. Prepare flexible budget income statements for the company, showing output levels of 55,000, 60,000, and 65,000 kits. (Enter the per unit information to two decimal places.) Data Table X Outrageous Bubbles, Inc. Flexible Budget Income Statement Month Ended March 31 Flexible Budget per Output Unit Output Units (Kits) 55.000 60,000 65.000 The company's master budget income statement for March follows. It is based on expected sales volume of 55,000 bubble kits Salos revenue Variable expenses Cost of goods sold Sales commissions Utility expense Fixed expenses Salary oxpense Depreciation expense Ront expense Outrageous Bubbles, Inc. Master Budget Income Statement Month Ended March 31 S 170,500 Sales revenue Variable expenses Cost of goods sold S 68,750 Sales commissions 13,750 Utility expense 5,500 Fixed expenses Salary expense 30,000 Depreciation expense 20,000 Rent expense 15,000 7,000 Utility expense S Total expenses 160,000 S 10,500 Operating income Ulilily expense Total expenses Operating income Print Done = Questio Requirements 1. Prepare flexible budget income statements for the company, showing output levels of 55,000, 60,000, and 65,000 kits. 2. Graph the behavior of the company's total costs. Use total costs on the y-axis and volume (in thousands of bubble kits) on the x-axis. 3. Why might Outrageous Bubbles' managers want to see the graph you prepared in Requirement 2 as well as the columnar format analysis in Requirement 1? What is the disadvantage of the graphic approach
Step by Step Solution
There are 3 Steps involved in it

Get step-by-step solutions from verified subject matter experts