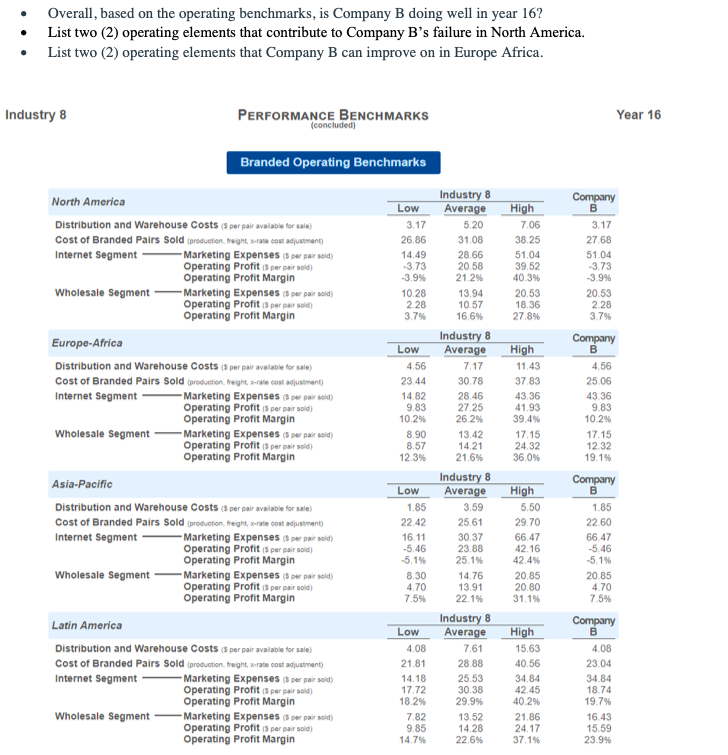
Question: . Overall, based on the operating benchmarks, is Company B doing well in year 16? List two (2) operating elements that contribute to Company B's

. Overall, based on the operating benchmarks, is

. Overall, based on the operating benchmarks, is Company B doing well in year 16? List two (2) operating elements that contribute to Company B's failure in North America. List two (2) operating elements that Company B can improve on in Europe Africa. Industry 8 PERFORMANCE BENCHMARKS Year 16 (concluded) Branded Operating Benchmarks Low 3.17 26.86 14.49 -3.73 -3.9% 10.28 2.28 3.7% High 7.06 38.25 51.04 39.52 40.3% 20.53 18.36 27.8% North America Distribution and Warehouse Costs (3 par pair available for sale) Cost of Branded Pairs Sold (production, freight X-rate cost adjustment) Internet Segment Marketing Expenses (5 per pairsold) Operating profits per pair old) Operating Profit Margin Wholesale Segment Marketing Expenses $ per pair sold) Operating profits per pair sold) Operating Profit Margin Europe-Africa Distribution and Warehouse Costs (5 per pair valable for sale) Cost of Branded Pairs Sold (production, freight rate cost adjustment) Internet Segment Marketing Expenses (5 per pairsold) Operating profits per pair soid) Operating Profit Margin Wholesale Segment -Marketing Expenses (w par sold) Operating profits per pair sold) Operating Profit Margin Asia-Pacific Distribution and Warehouse Costs (5 per pair available for sale) Cost of Branded Pairs Sold (production, freight rate cont adjustment) Internet Segment -Marketing Expenses (5 per pair sold) Operating profits per pairsold) Operating Profit Margin Wholesale Segment -Marketing Expenses (per pairsold) Operating profits per pair sold) Operating Profit Margin Low 4.56 23.44 14.82 9.83 10.2% 8.90 8.57 12.3% High 11.43 37.83 43.36 41.93 39.4% 17.15 24.32 36.0% Industry 8 Average 5.20 31.08 28.66 20.58 21.2% 13.94 10.57 16.6% Industry 8 Average 7.17 30.78 28.46 27.25 26.2% 13.42 14.21 21.6% Industry 8 Average 3.59 25.61 30.37 23.88 25.1% 14.76 13.91 22.1% Industry 8 Average 7.61 28.88 25.53 30.38 29.9% 13.52 14.28 22.6% Company B 3.17 27.68 51.04 3.73 -3.9% 20.53 2.28 3.7% Company B 4.56 25.06 43.36 9.83 10.2% 17.15 12.32 19.1% Company B 1.85 22.60 66.47 -5.46 -5.1% 20.85 4.70 7.5% Low 1.85 22.42 16.11 -5.46 -5.1% 8.30 4.70 7.5% High 5.50 29.70 66.47 42.16 42.4% 20.85 20.80 31.1% Latin America Distribution and Warehouse Costs (5 per pair available for sale) Cost of Branded Pairs Sold (production, freight rate cout adjustment) Internet Segment Marketing Expenses (5 per pairsold) Operating Profit per pair sold) Operating Profit Margin Wholesale Segment Marketing Expenses per par soid) Operating Profit (per pair sold) Operating Profit Margin Low 4.08 21.81 14.18 17.72 18.2% 7.82 9.85 14.79 High 15.63 40.56 34.84 42.45 40.2% 21.86 24.17 37.1% Company B 4.08 23.04 34.84 18.74 19.7% 16.43 15.59 23.9%

Step by Step Solution

There are 3 Steps involved in it

1 Expert Approved Answer
Step: 1 Unlock blur-text-image
Question Has Been Solved by an Expert!

Get step-by-step solutions from verified subject matter experts

Step: 2 Unlock
Step: 3 Unlock

Students Have Also Explored These Related General Management Questions!