

Question: Overlapping Line Chart for Accelerometer Data. Code base - This is a sample Python script. # Press to search everywhere for classes, files, tool windows,
Overlapping Line Chart for Accelerometer Data. Code base This is a sample Python script.
# Press to search everywhere for classes, files, tool windows,
actions, and settings.
def analyzedata:
# Use a breakpoint in the code line below to debug your
script.
import pandas as pd
import numpy as np
import matplotlib.pyplot as plt
# Step Selecting the one data for further data analysis.
Give the path & file name below.
affectedfilename
affecteddf pdreadcsvaffectedfilename, skiprows
accx nparrayaffecteddfAccelerometer X
accy nparrayaffecteddfAccelerometer Y
accz nparrayaffecteddfAccelerometer Z
accmag npsqrtaccx accx accy accy accz
accz
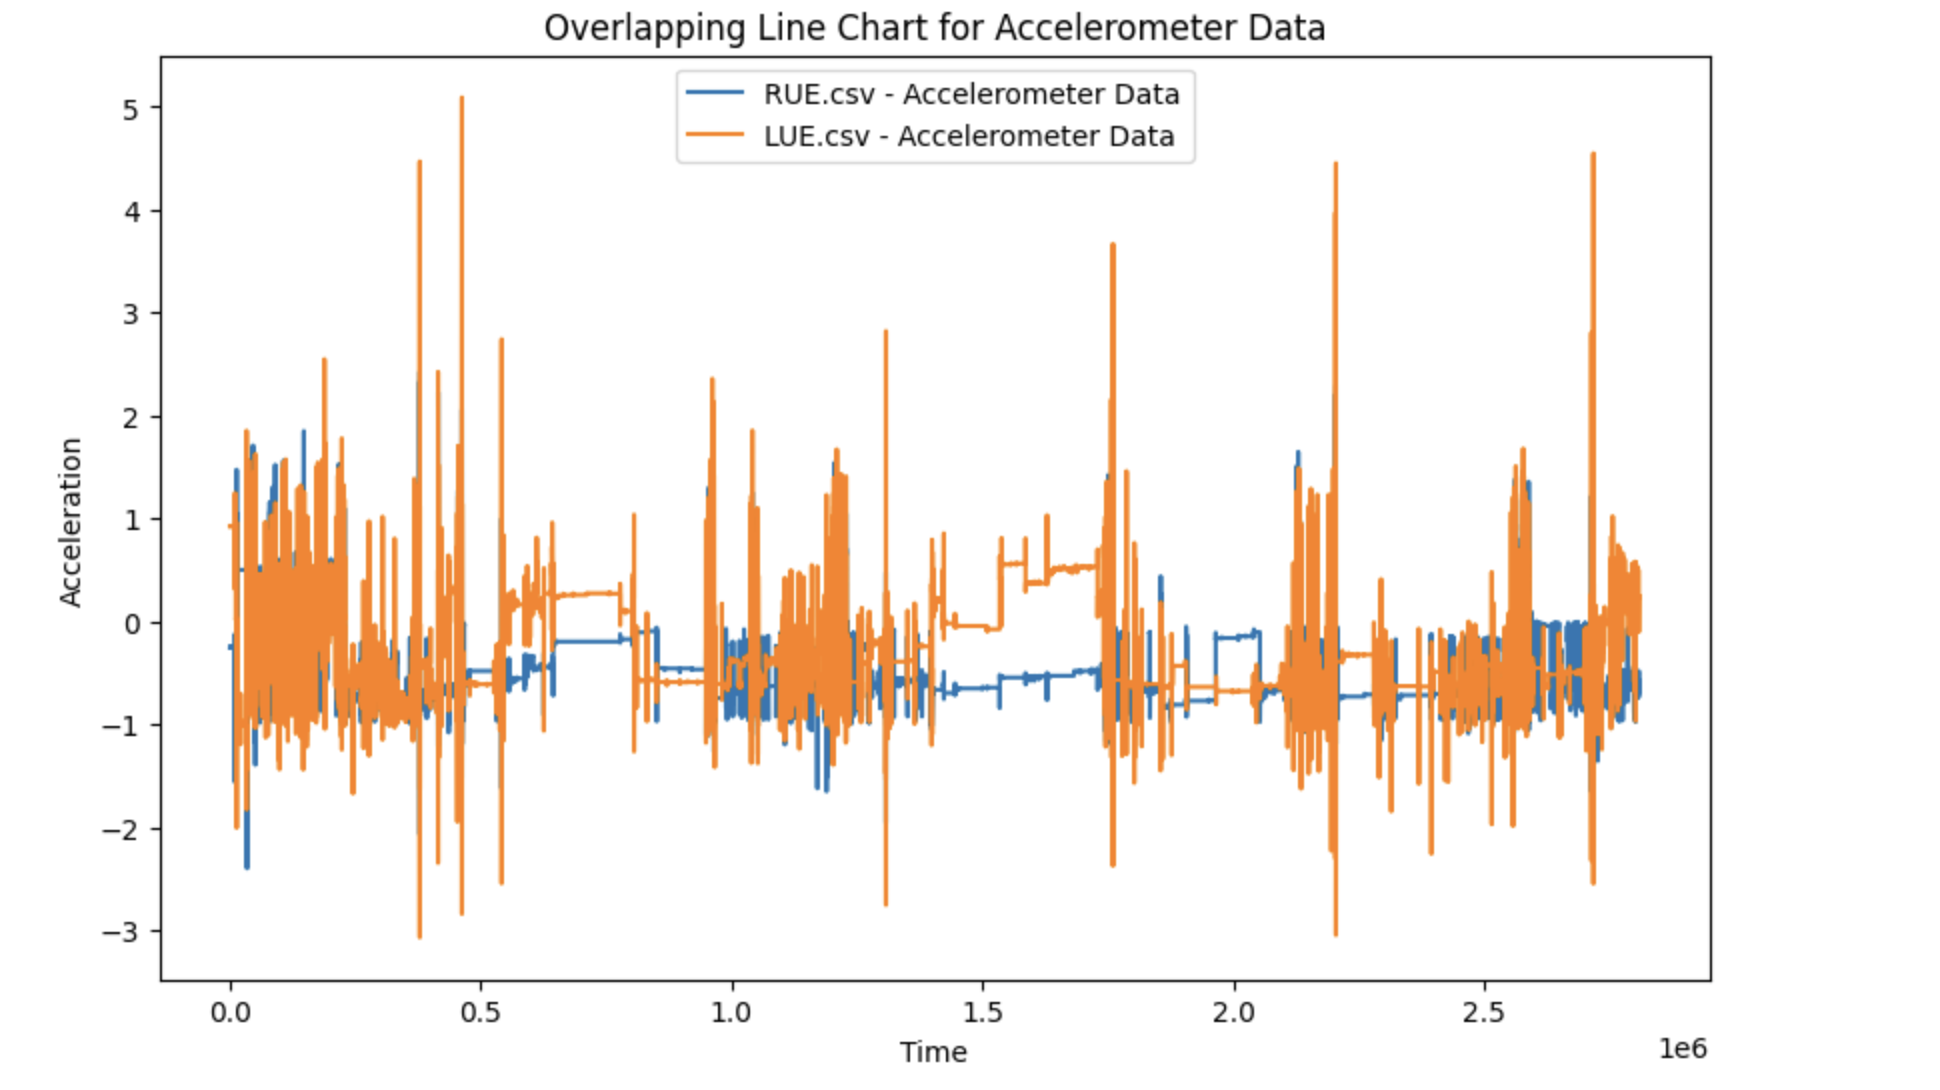
pltplotrangelenaccmag accmag
pltshow
# Step Identifying the data for sedentary behavior ie
sleeping
# If you identify the beginning index of the sedentary
behavior, the ending index will be automatically done.
# If you select the beginning index too loosely, the
subsequent sedentarydata may include active behavior.
# So be careful.
startindex
endindex startindex inte
sedentaryrange rangestartindex, endindex
sedentarydata accmagsedentaryrange
pltplotrangelensedentarydata sedentarydata
pltshow
# Step Computing beta
# Computing mu
mu
# Computing std
sigma
# Then, computing beta, using mu and std
beta
# Step Computing M for the data
# You can apply beta to identify the data of active behavior.
activedata
M lenactivedatalenaccmag
# Press the green button in the gutter to run the script.
if namemain:
analyzedata The should be filled. Dataset is already chosen. Thank you. Also how to figure out starting index?
Step by Step Solution
There are 3 Steps involved in it
1 Expert Approved Answer
Step: 1 Unlock

Question Has Been Solved by an Expert!
Get step-by-step solutions from verified subject matter experts
Step: 2 Unlock
Step: 3 Unlock