

Question: Overview Creating plots and figures is a key skill for engineers. Creating plots with single lines in MATLAB is relatively straightforward, but creating plots with
Overview
Creating plots and figures is a key skill for engineers. Creating plots with single lines in MATLAB is relatively straightforward, but creating plots with multiple lines can be a bit trickier. This problem will further increase your ability to work with arrays and help you practice plotting data from arrays.
Problem Description
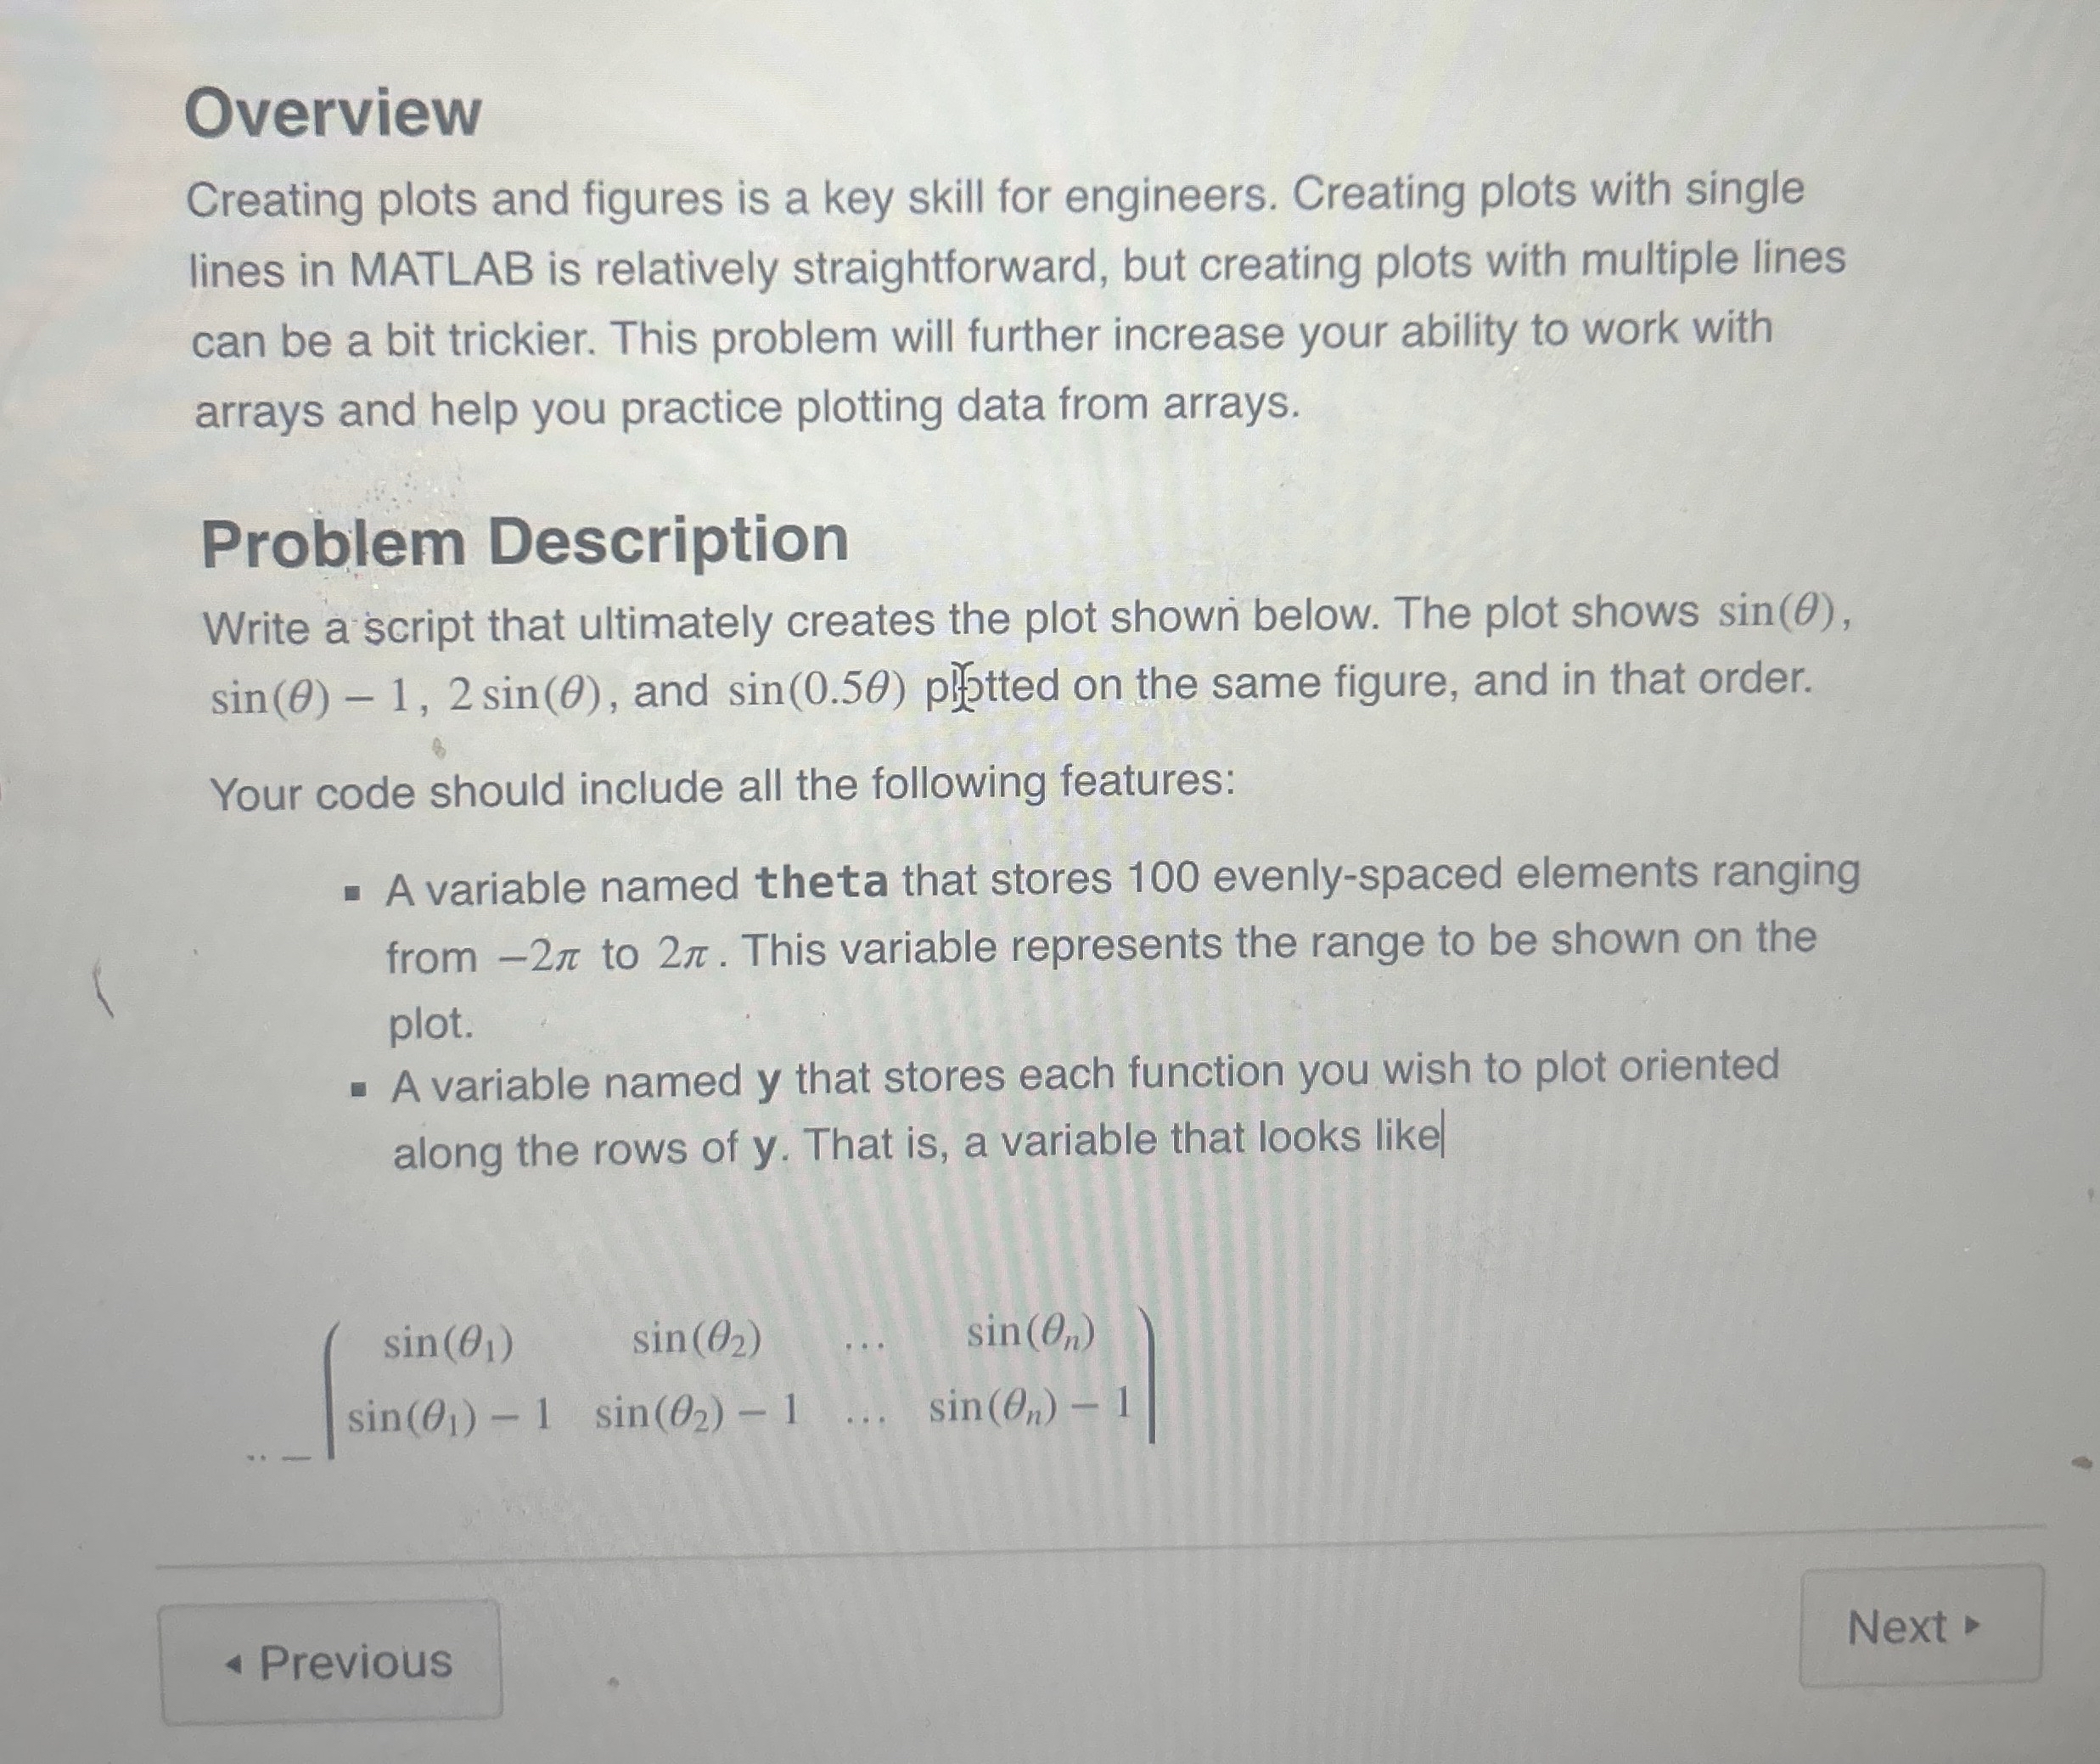
Write a script that ultimately creates the plot shown below. The plot shows and pifytted on the same figure, and in that order.
Your code should include all the following features:
A variable named theta that stores evenlyspaced elements ranging from to This variable represents the range to be shown on the plot.
A variable named that stores each function you wish to plot oriented along the rows of That is a variable that looks likel
dots,dots,
Step by Step Solution
There are 3 Steps involved in it
1 Expert Approved Answer
Step: 1 Unlock

Question Has Been Solved by an Expert!
Get step-by-step solutions from verified subject matter experts
Step: 2 Unlock
Step: 3 Unlock