

Question: Overview: The use of statistical process control tools helps address organizational performance in many industries, including Healthcare Information Management. A Pareto chart is a type


Overview: The use of statistical process control tools helps address organizational performance in many industries, including Healthcare Information Management. A Pareto chart is a type of analysis tool that helps with ranking causes from most significant to least significant. For this activity, you will create a Pareto chart using the data provided. As you complete this activity, consider whether these tools could help identify and solve your organizational problem for your final project. For help on how to create a Pareto chart, see this tutorial from Microsoft Office.
https://support.office.com/en-us/article/create-a-pareto-chart-a1512496-6dba-4743-9ab1-df5012972856
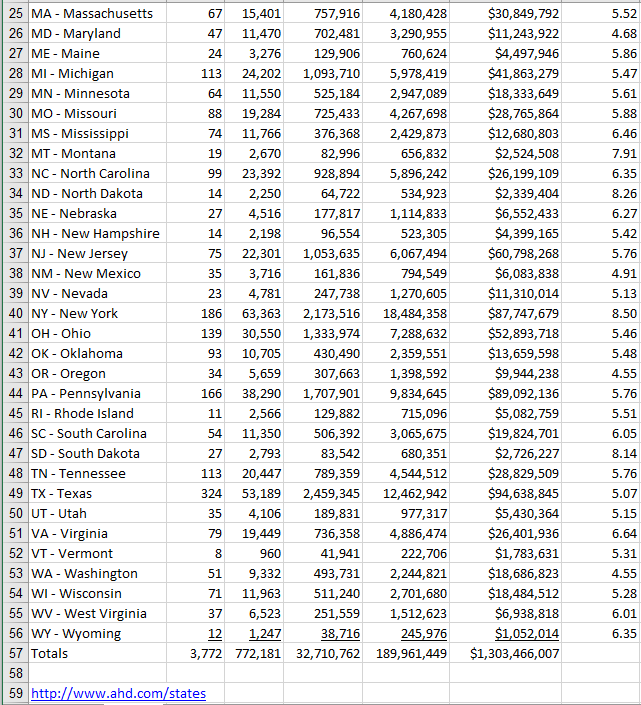
Prompt: Utilizing the Chapter 04 Analysis Data Set document, which is linked in the Module Five activity assignment in your course, create a Pareto chart depicting the top 10 states with the longest lengths of stay, and the average length of stay for the remaining 40 states. Your chart should contain 11 columns.

Step by Step Solution
There are 3 Steps involved in it

Get step-by-step solutions from verified subject matter experts