Question: OXY Valuation Template Example - MBAF 6845.xIs [Compatibility Mode] Q ~ Search Sheet Home Insert Page Layout Formulas Data Review View '+ Share ~ X
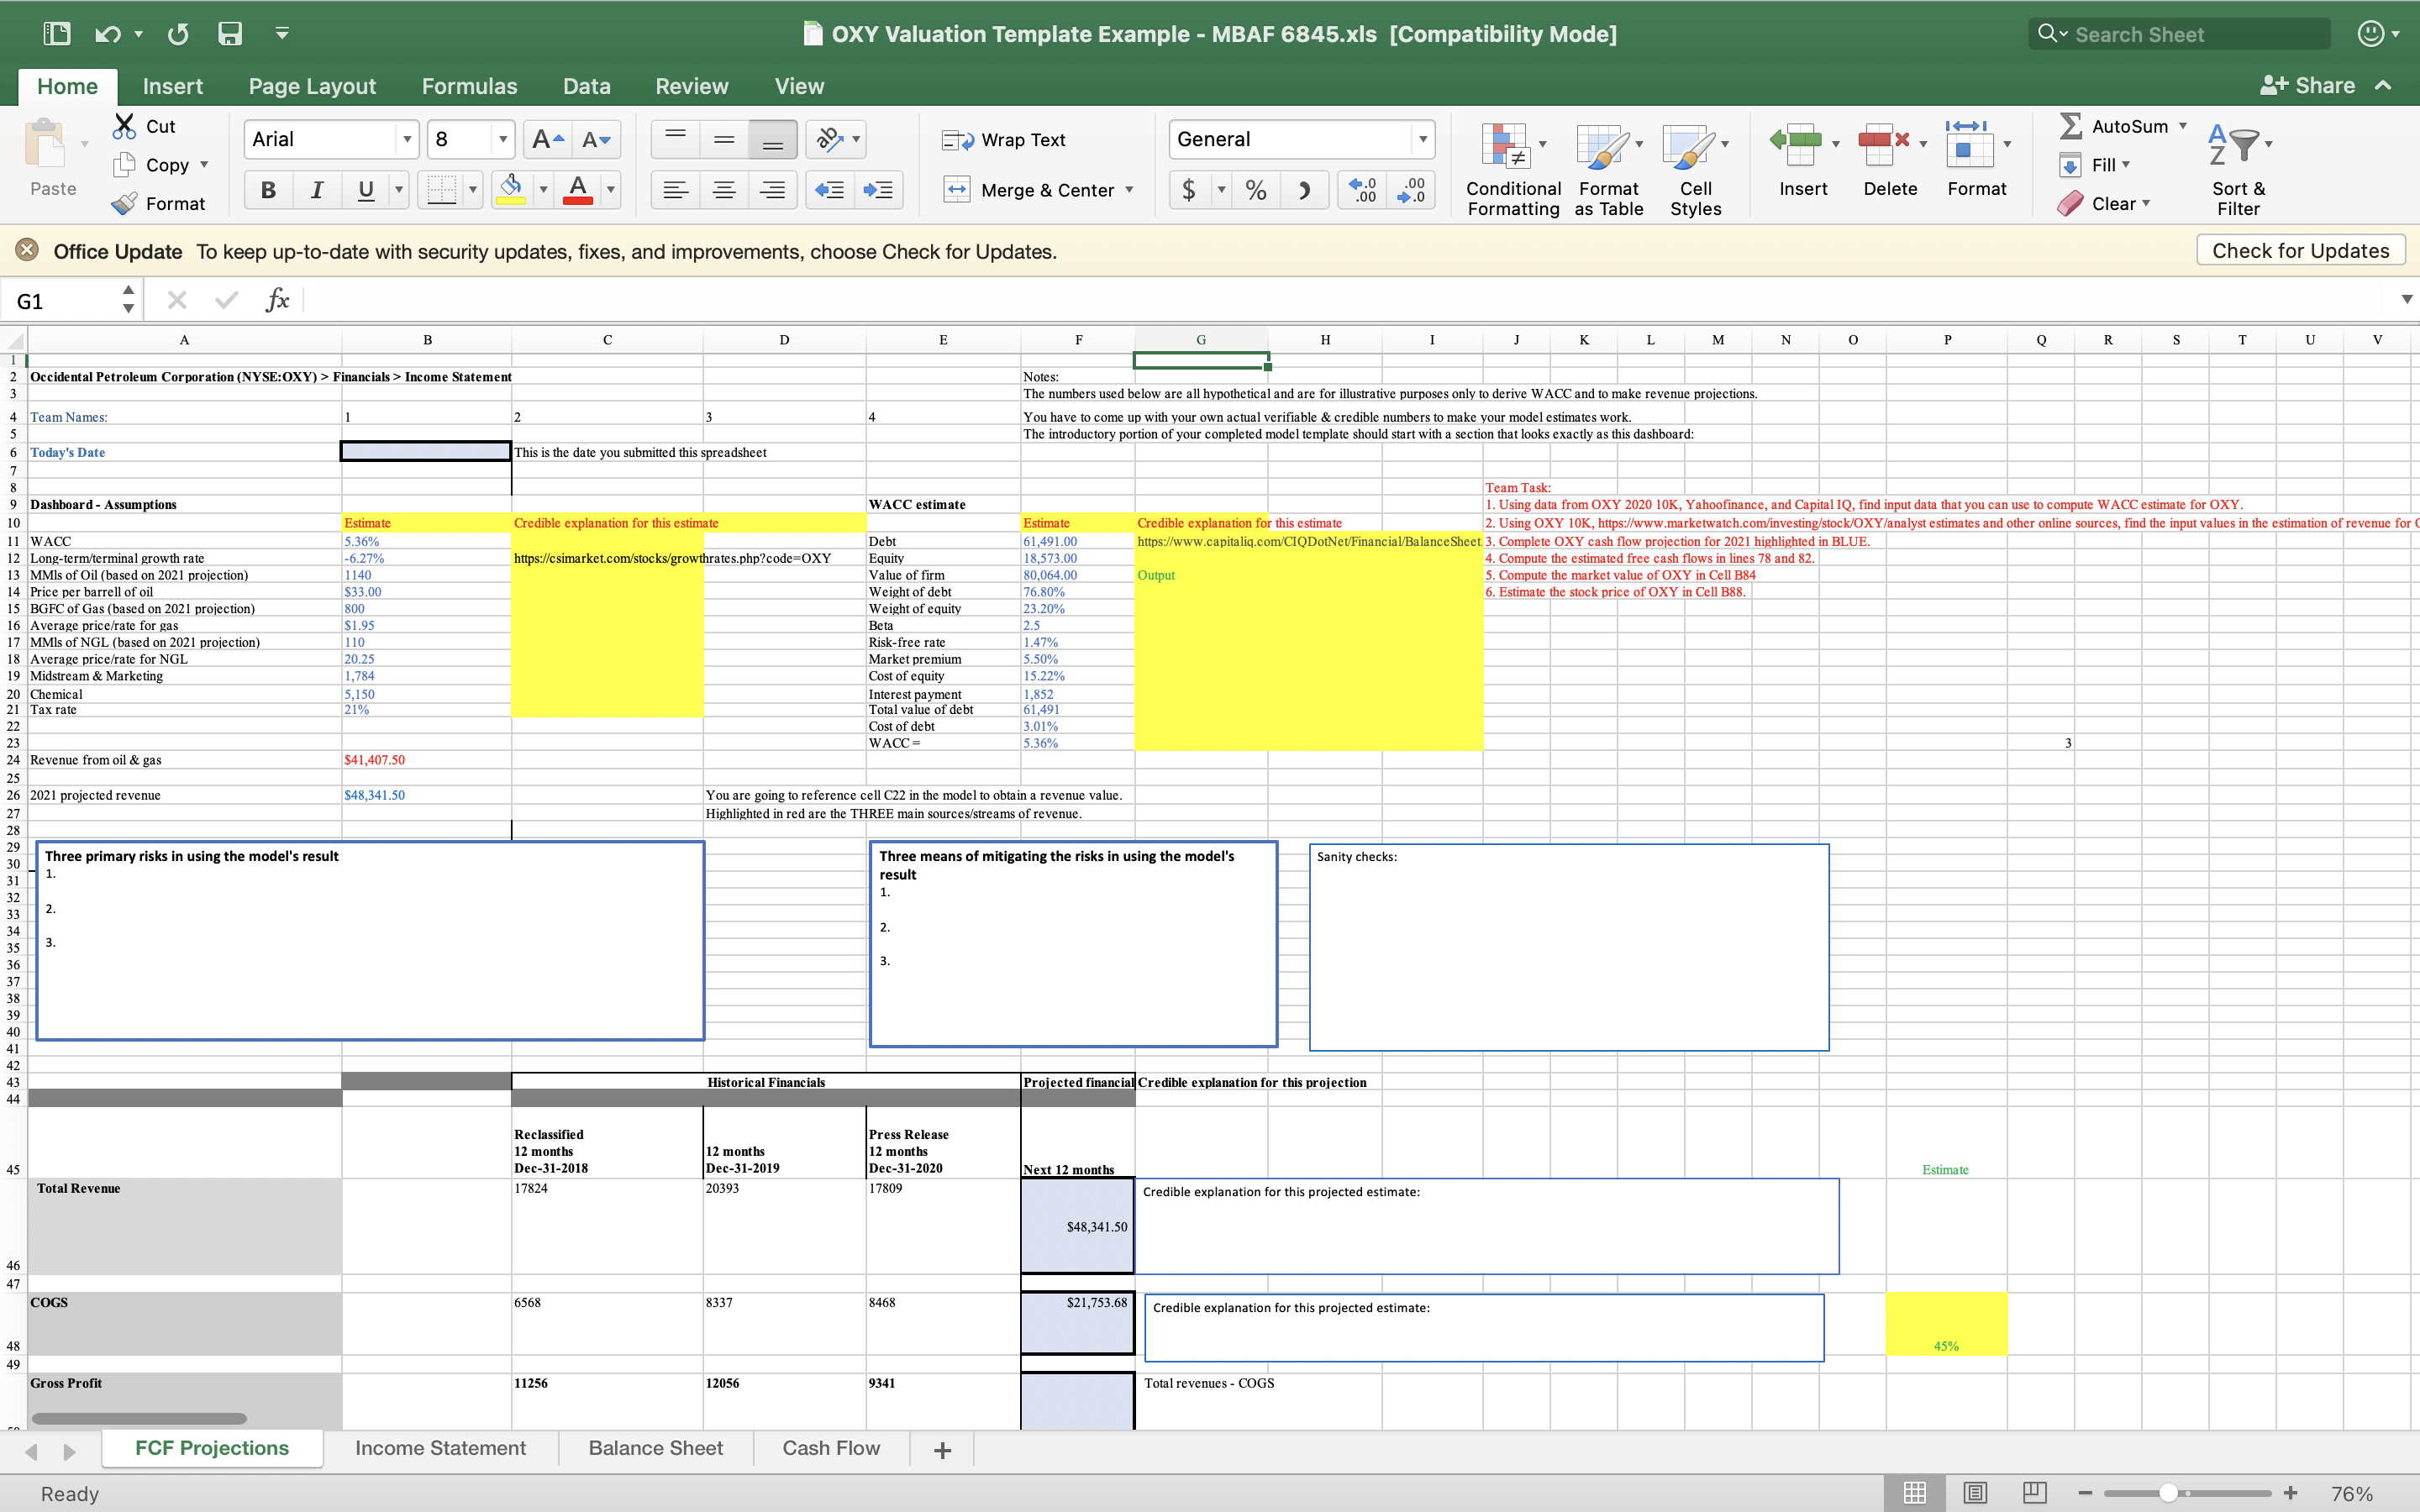
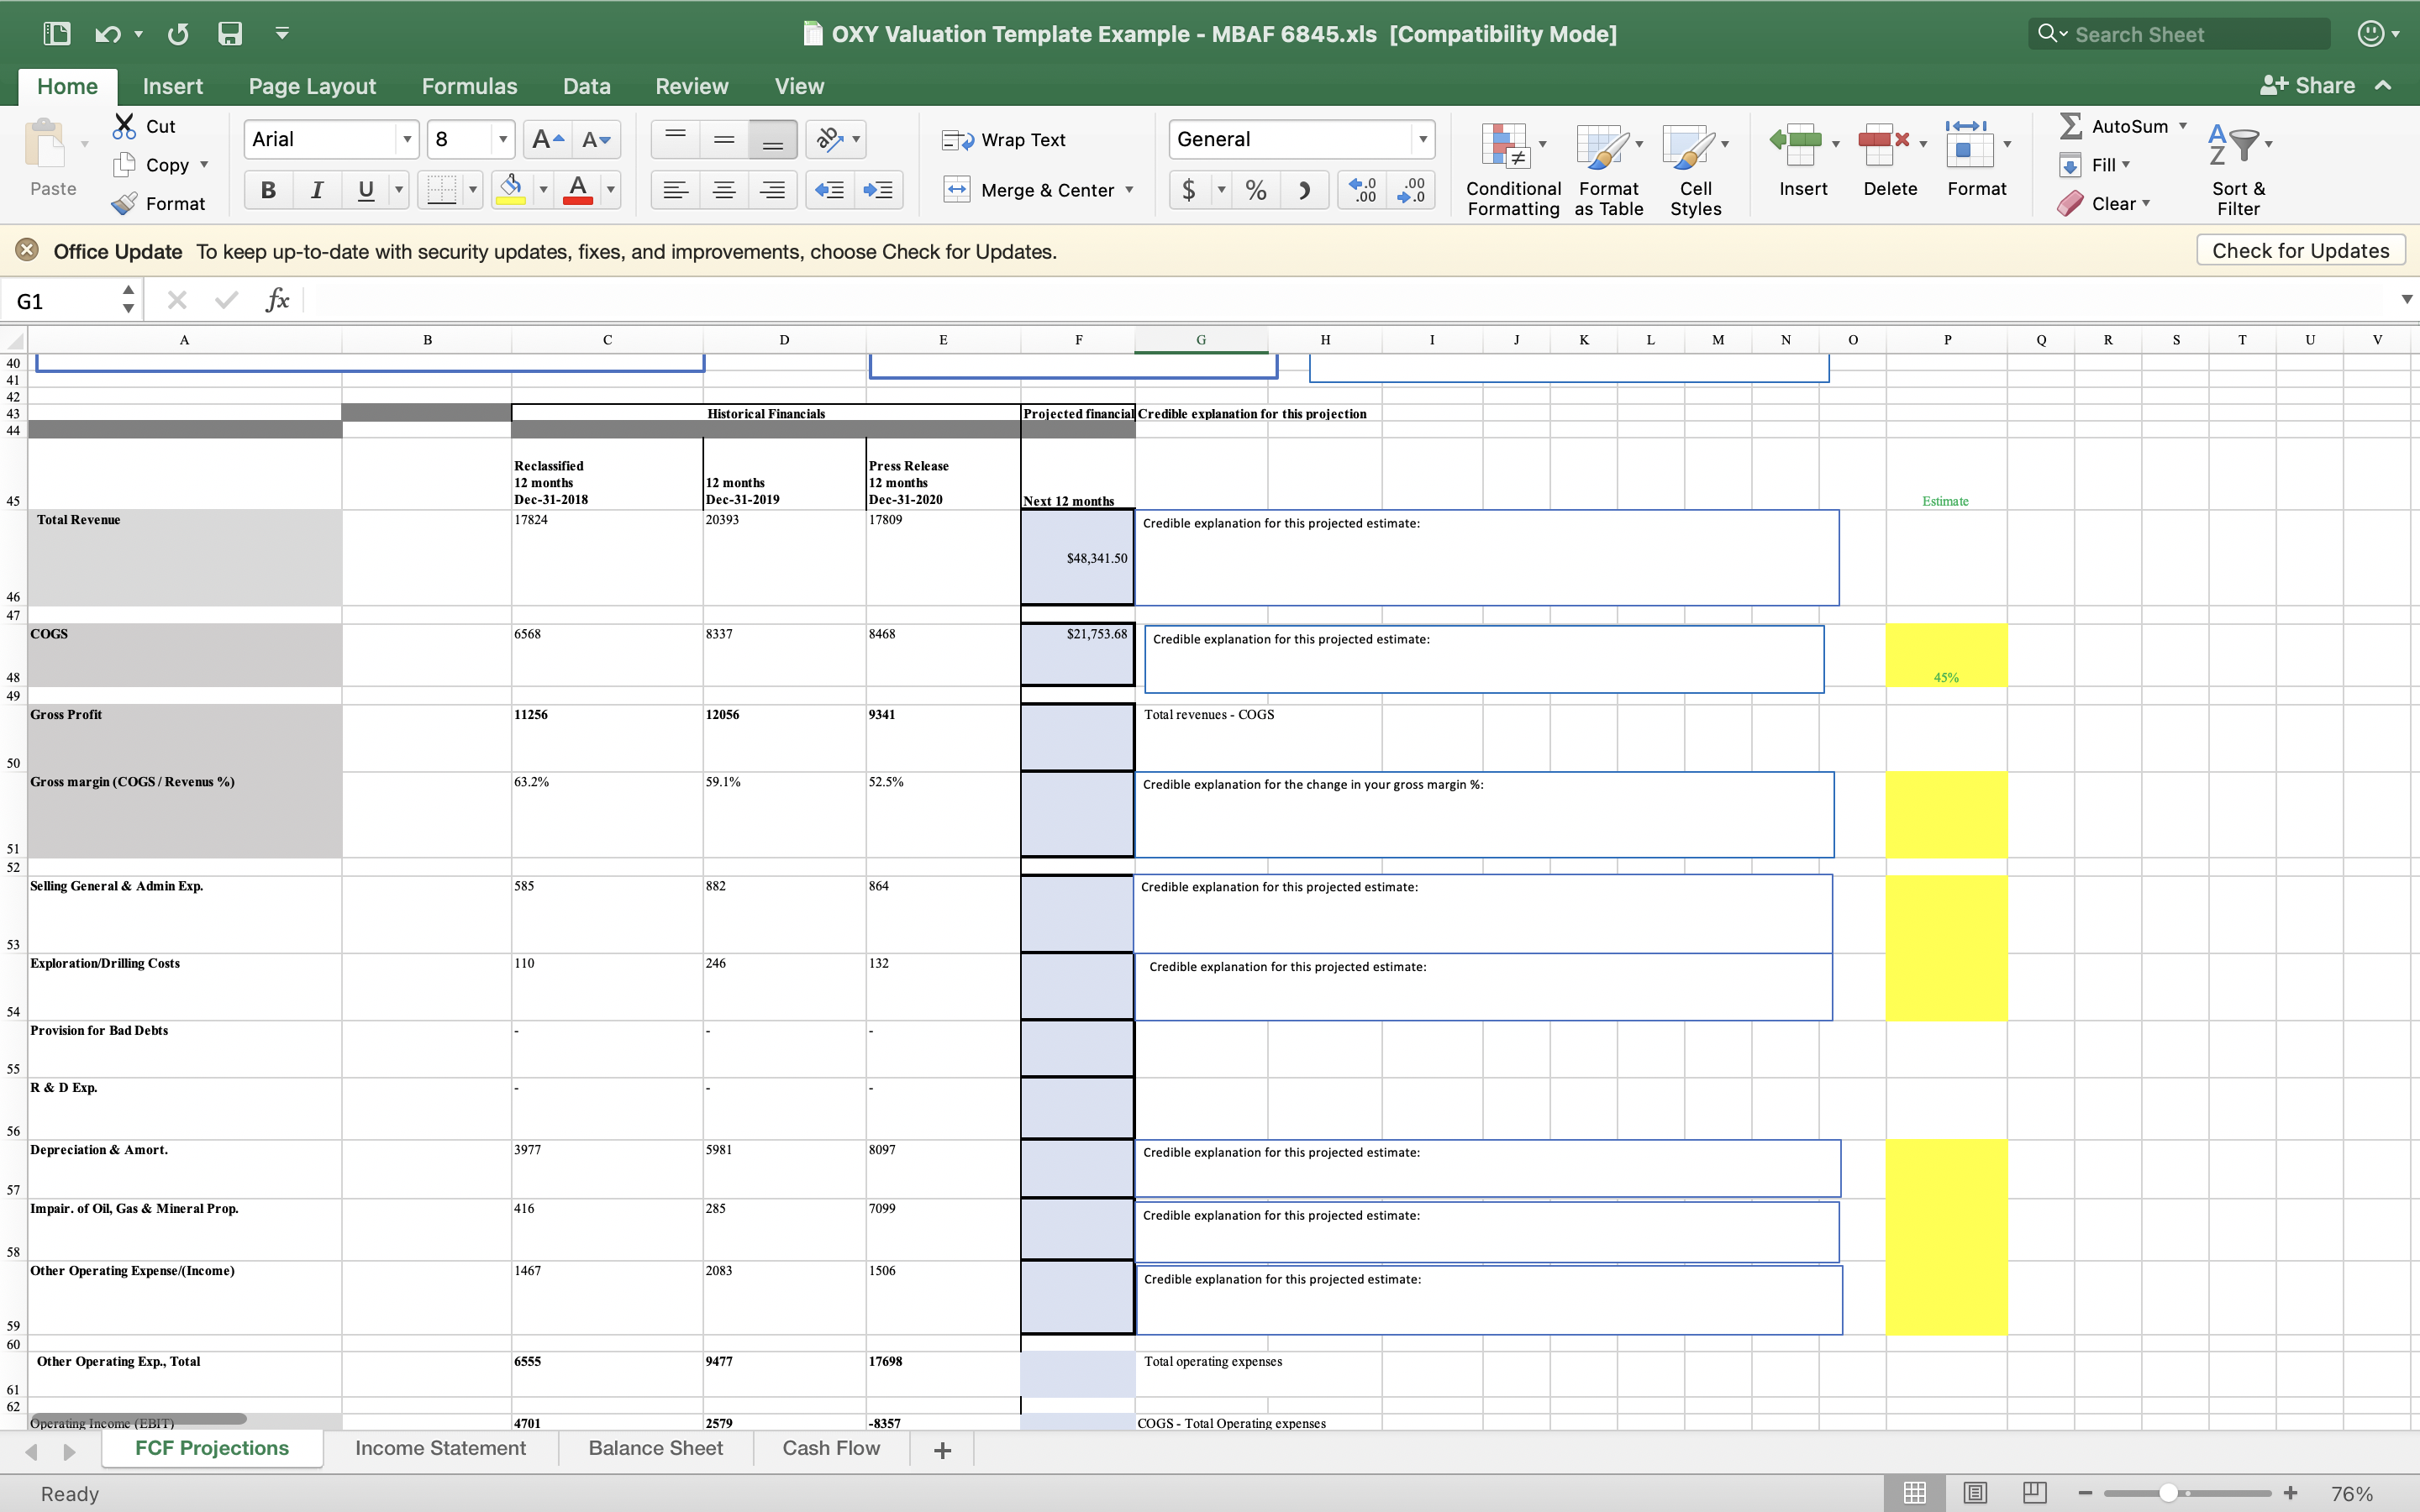
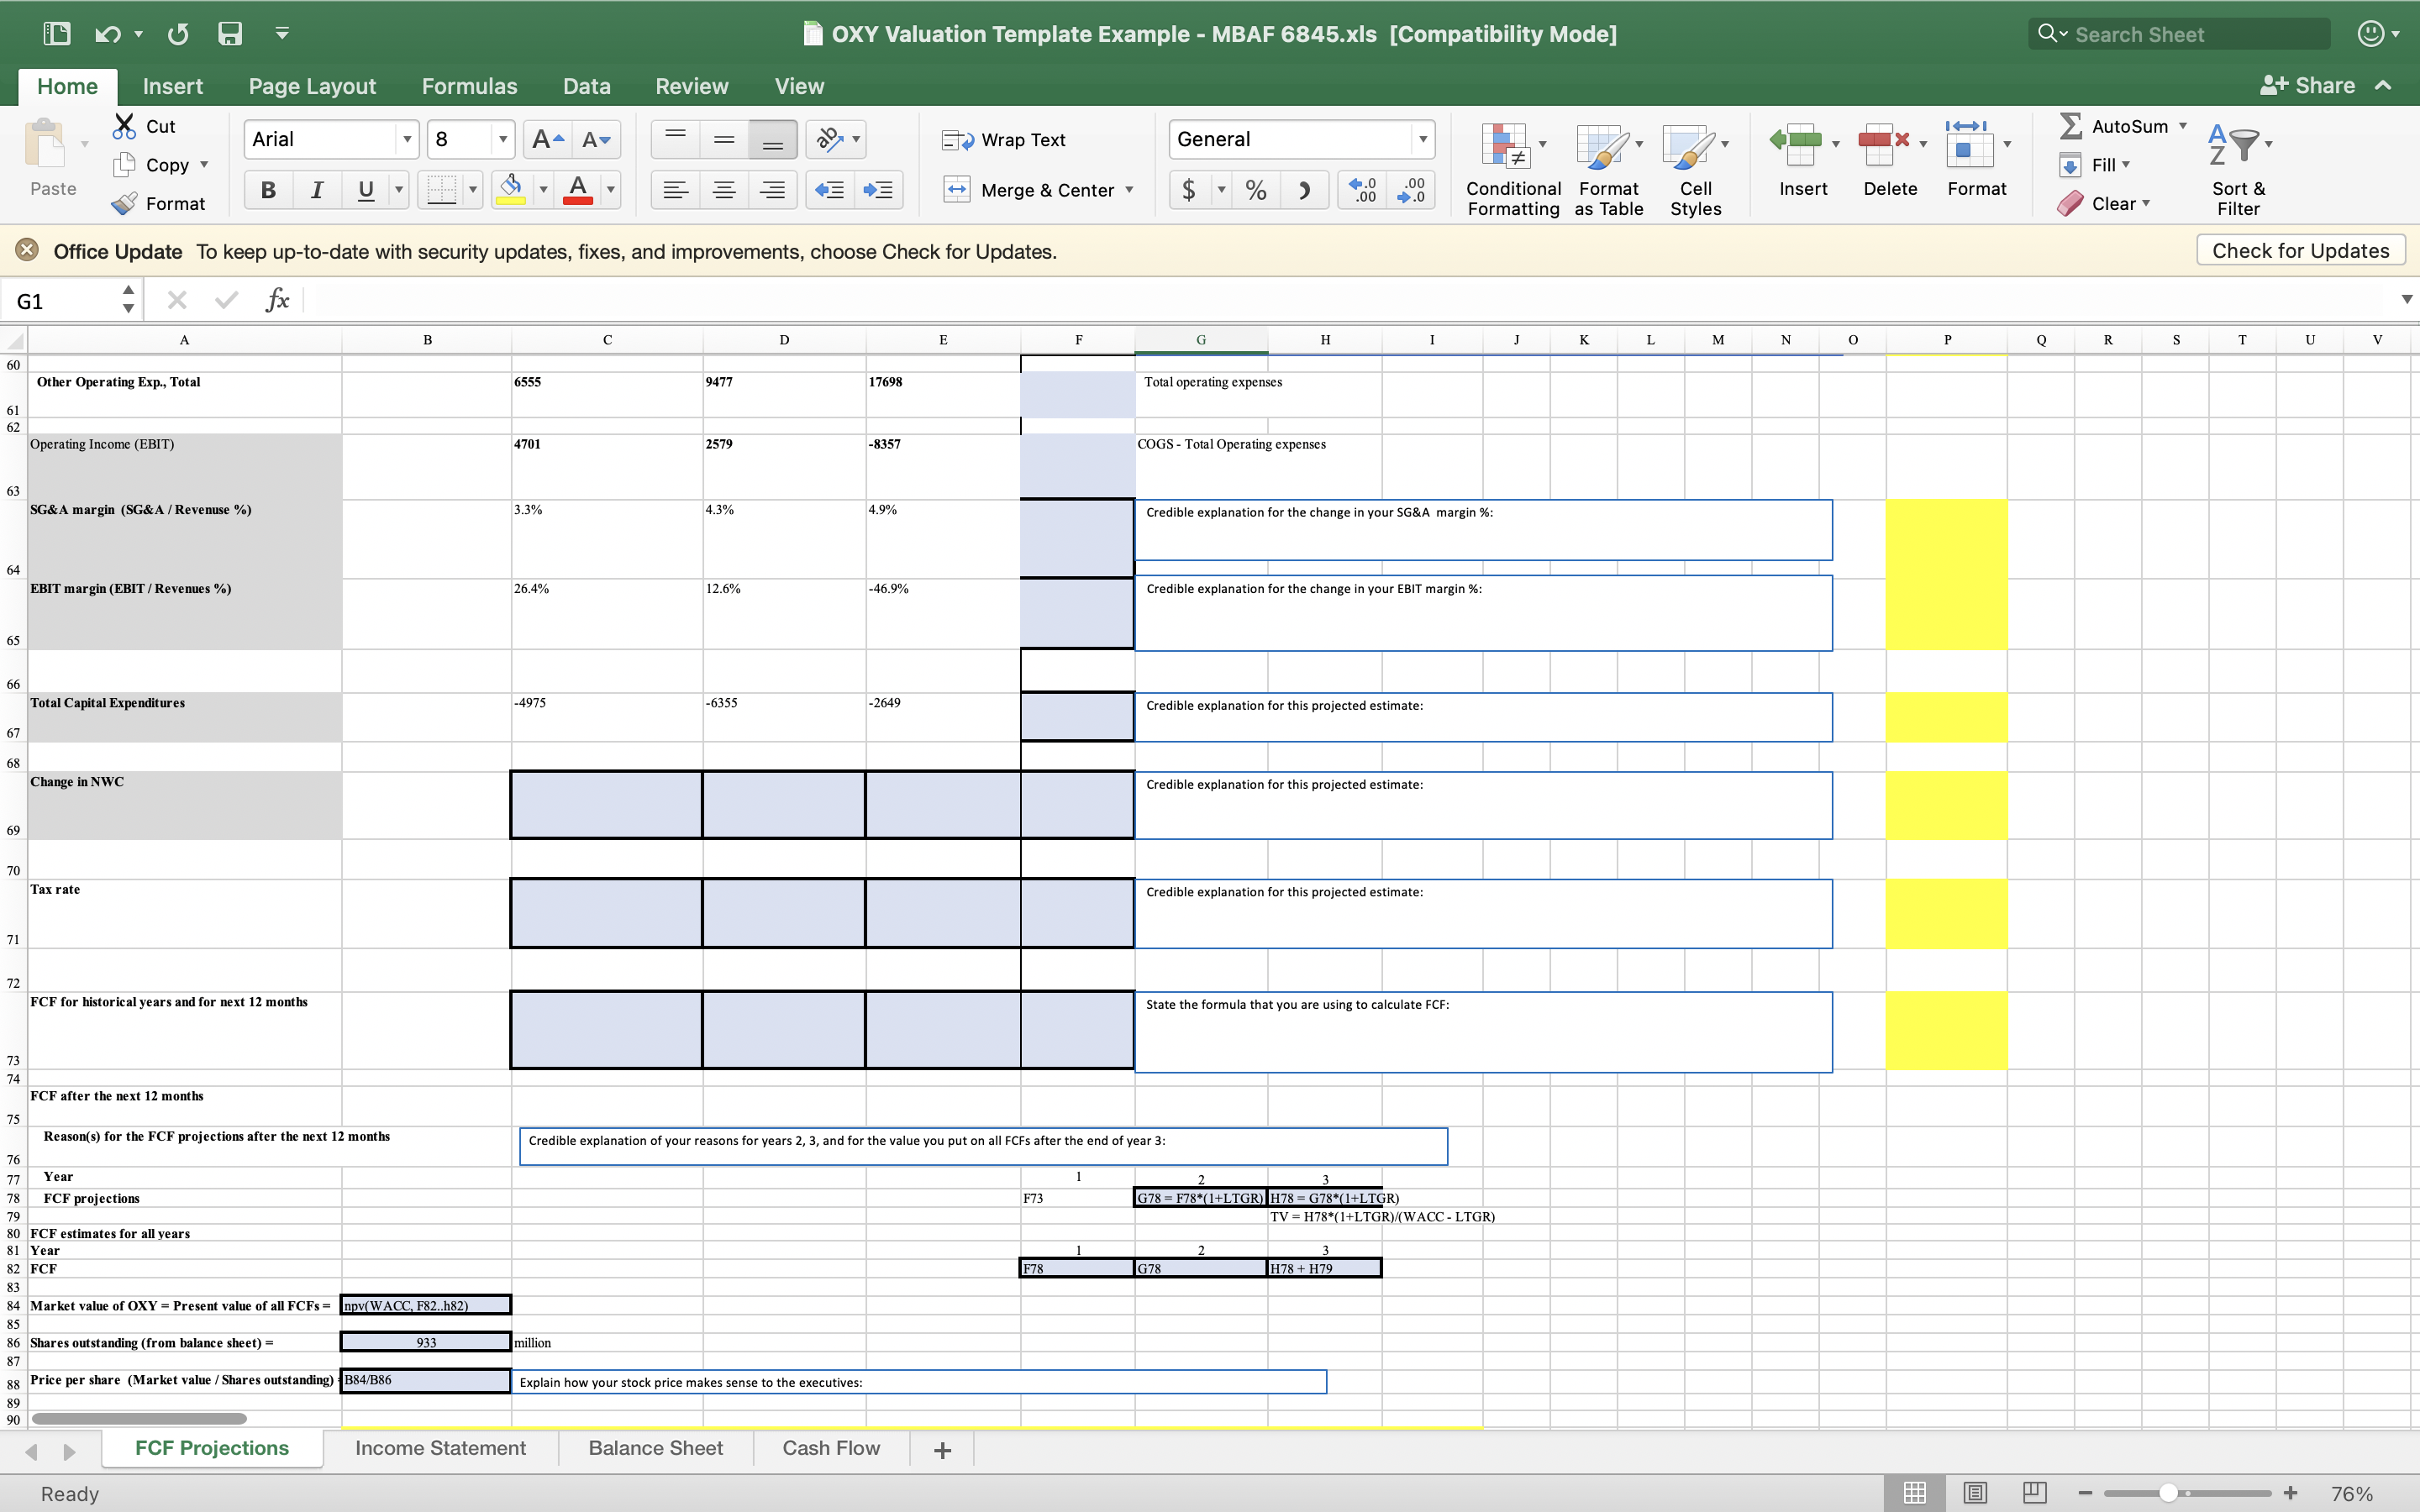
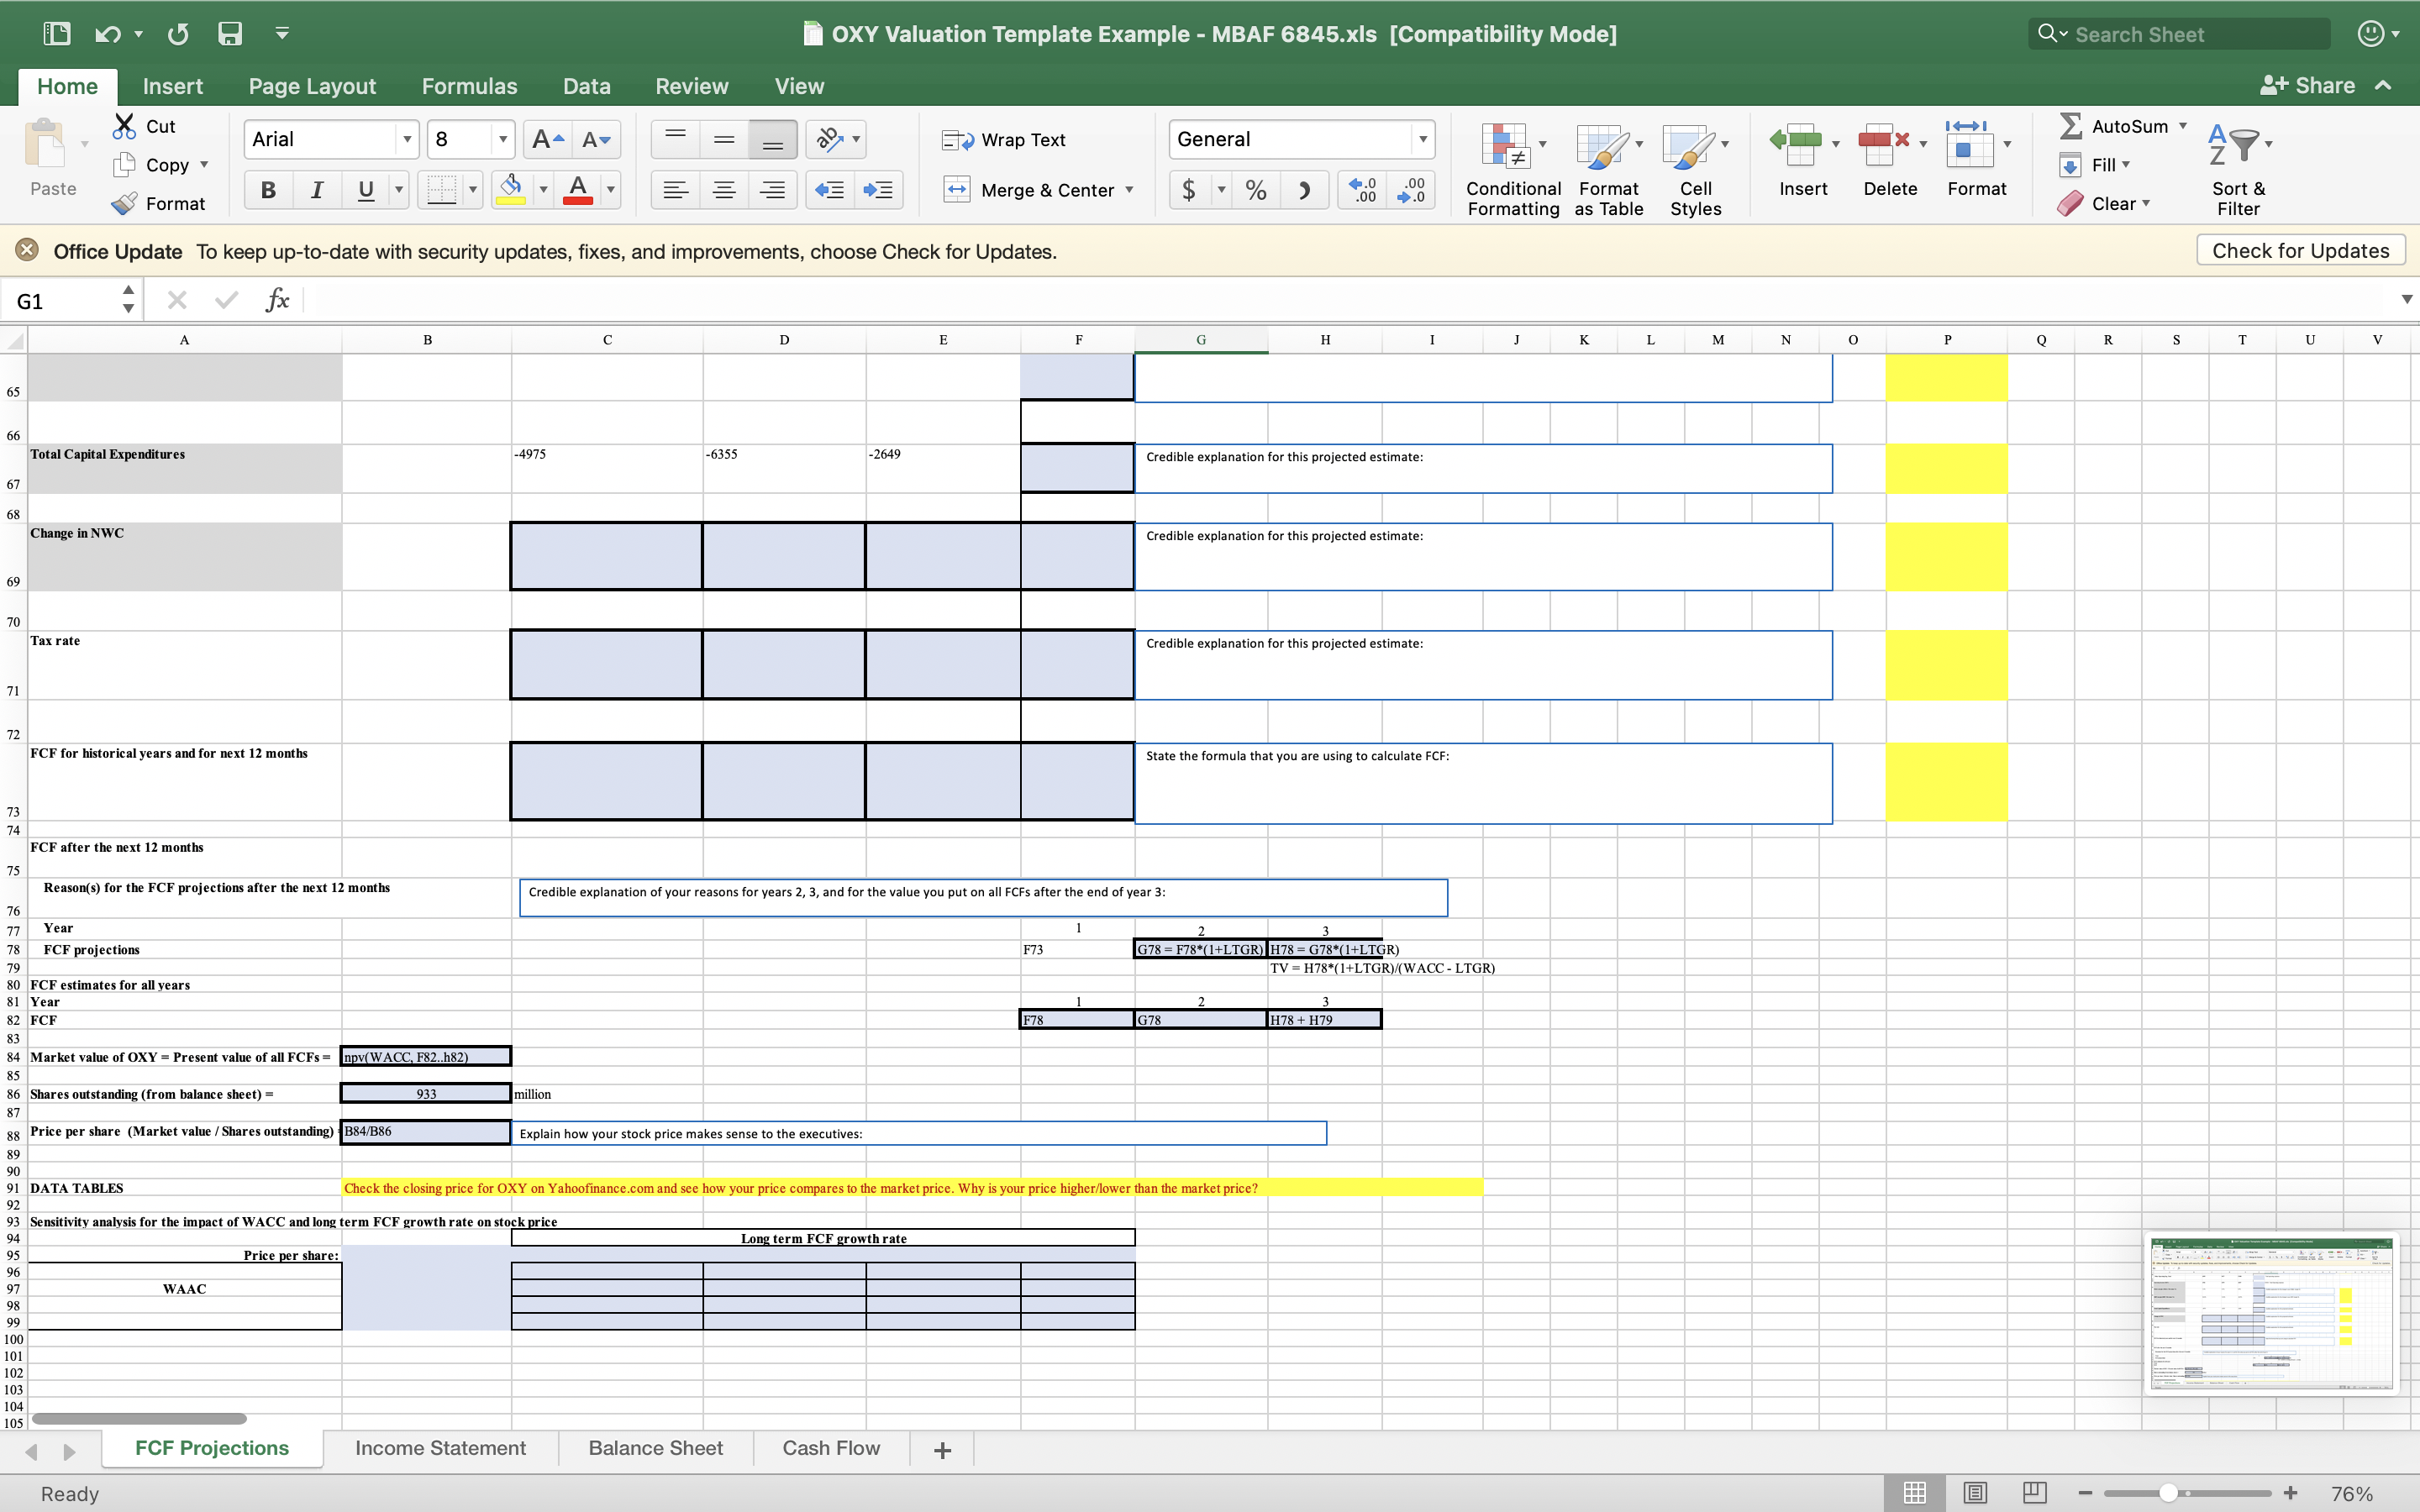
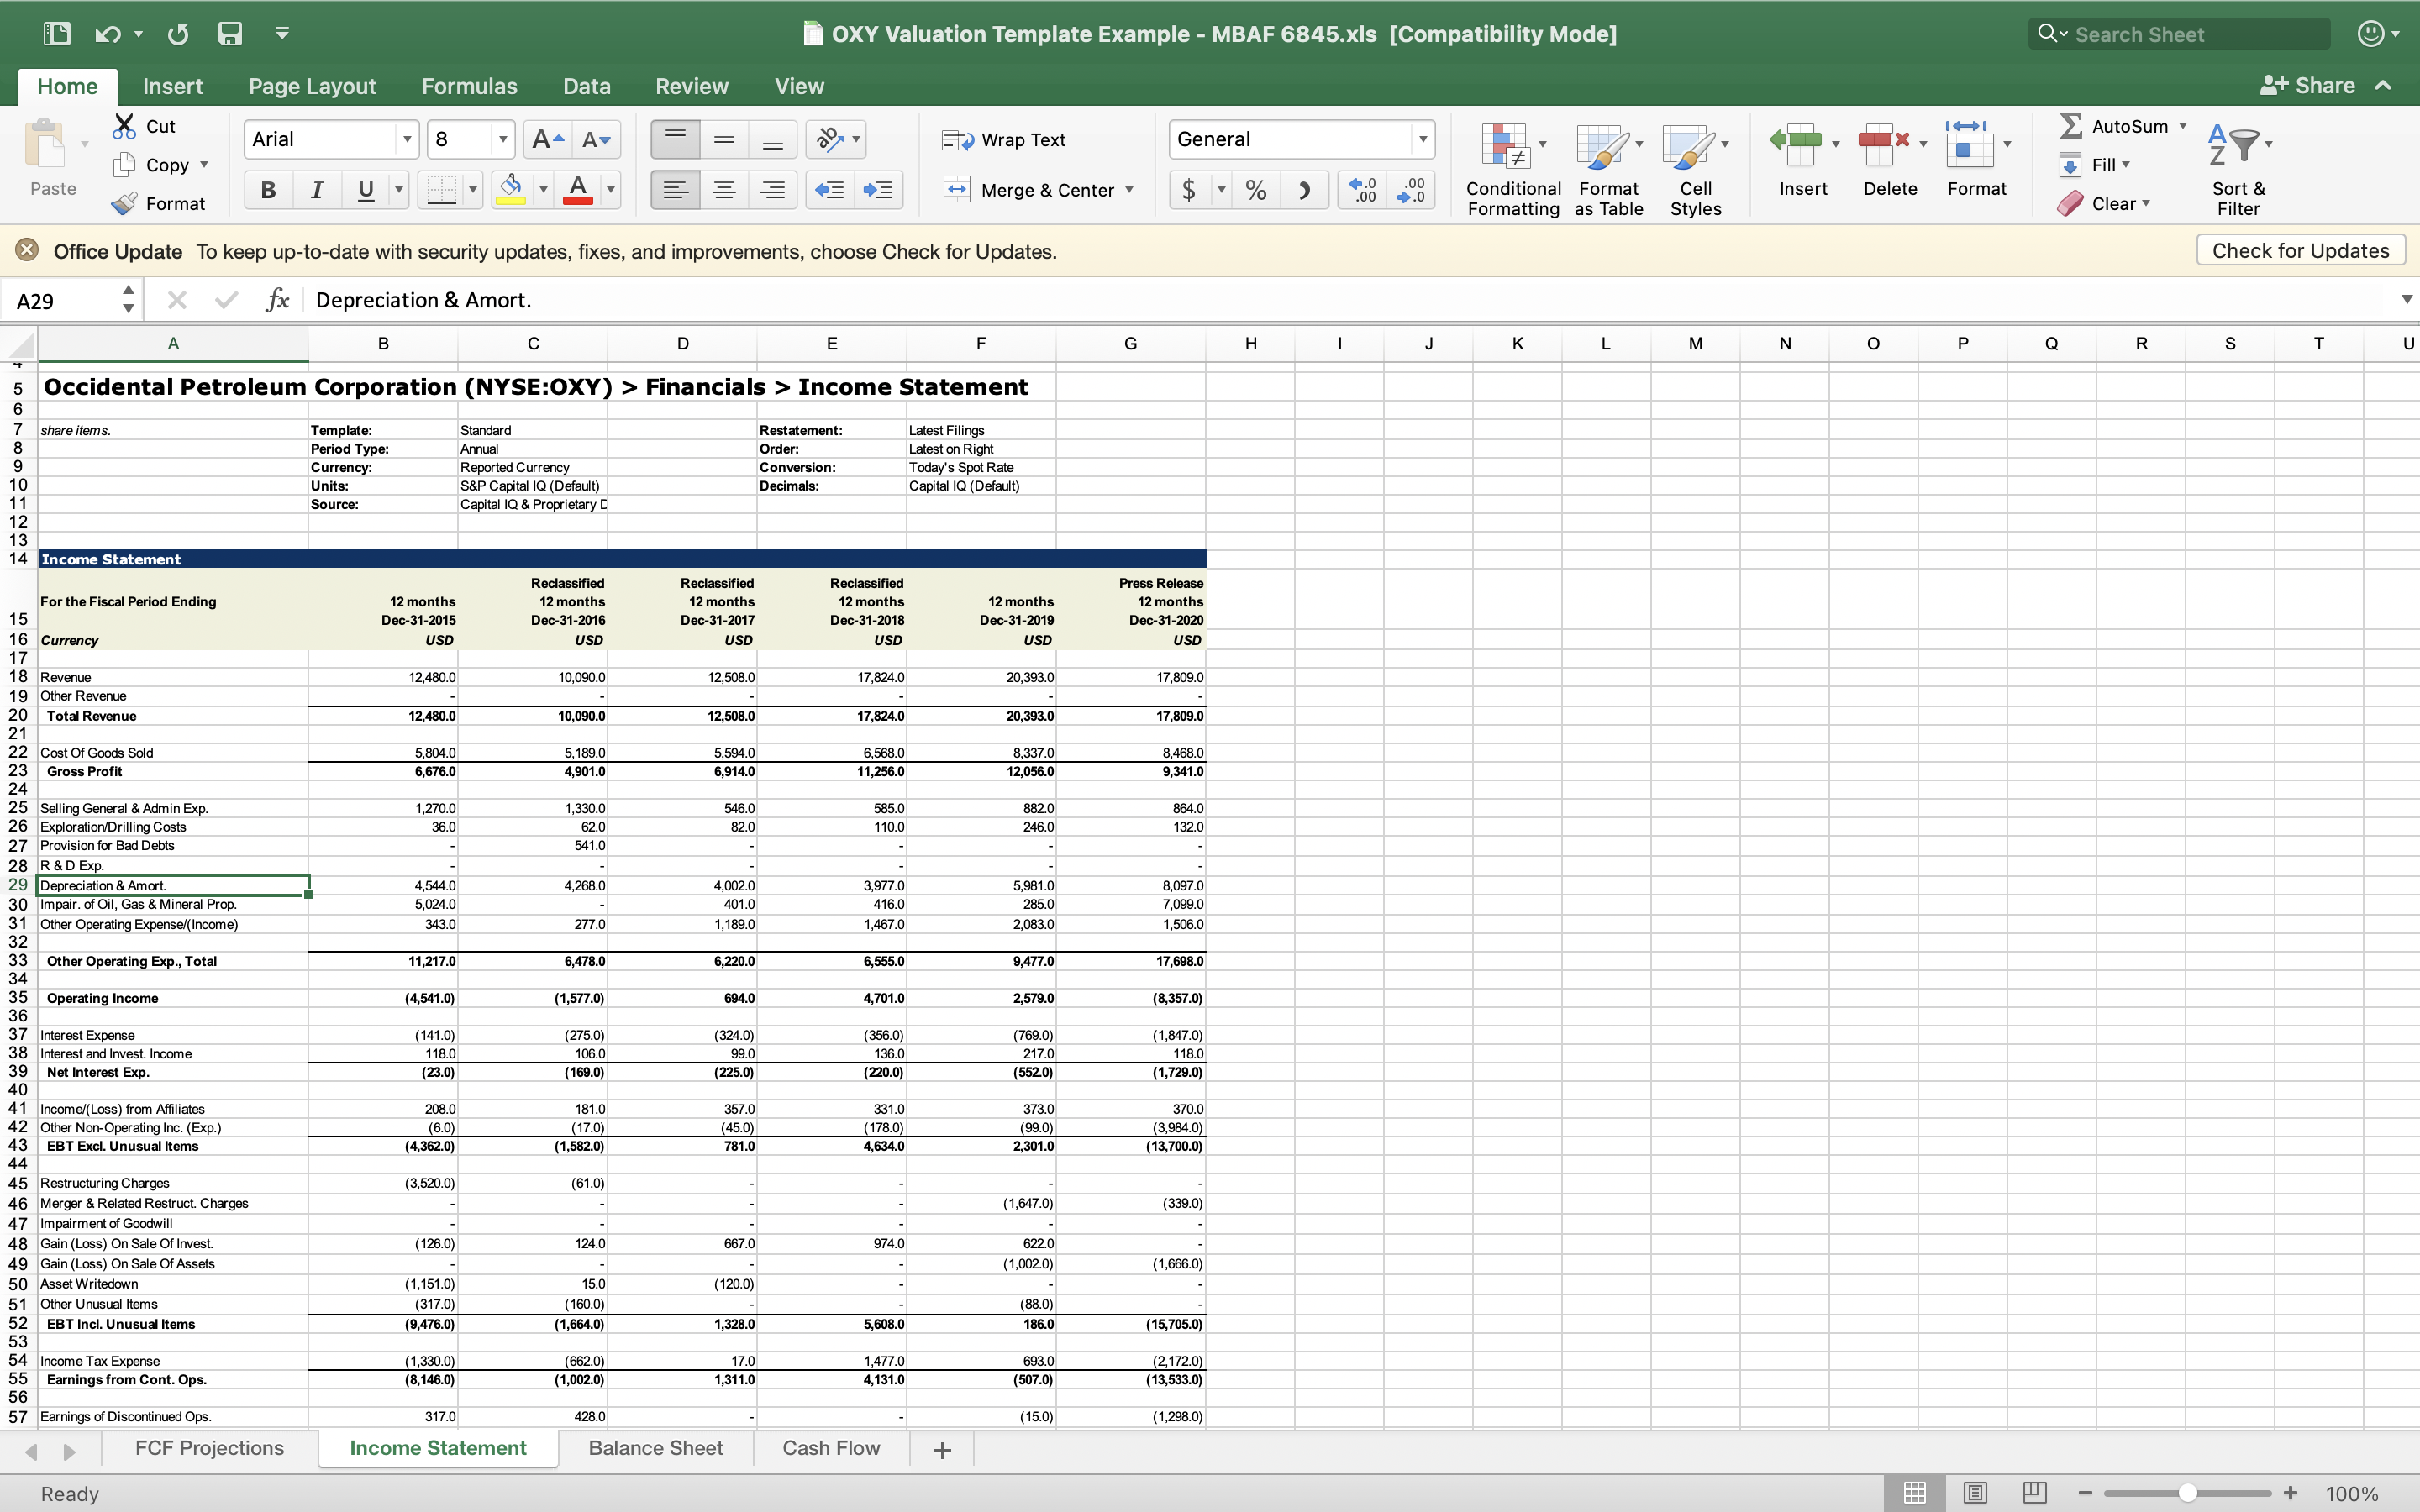
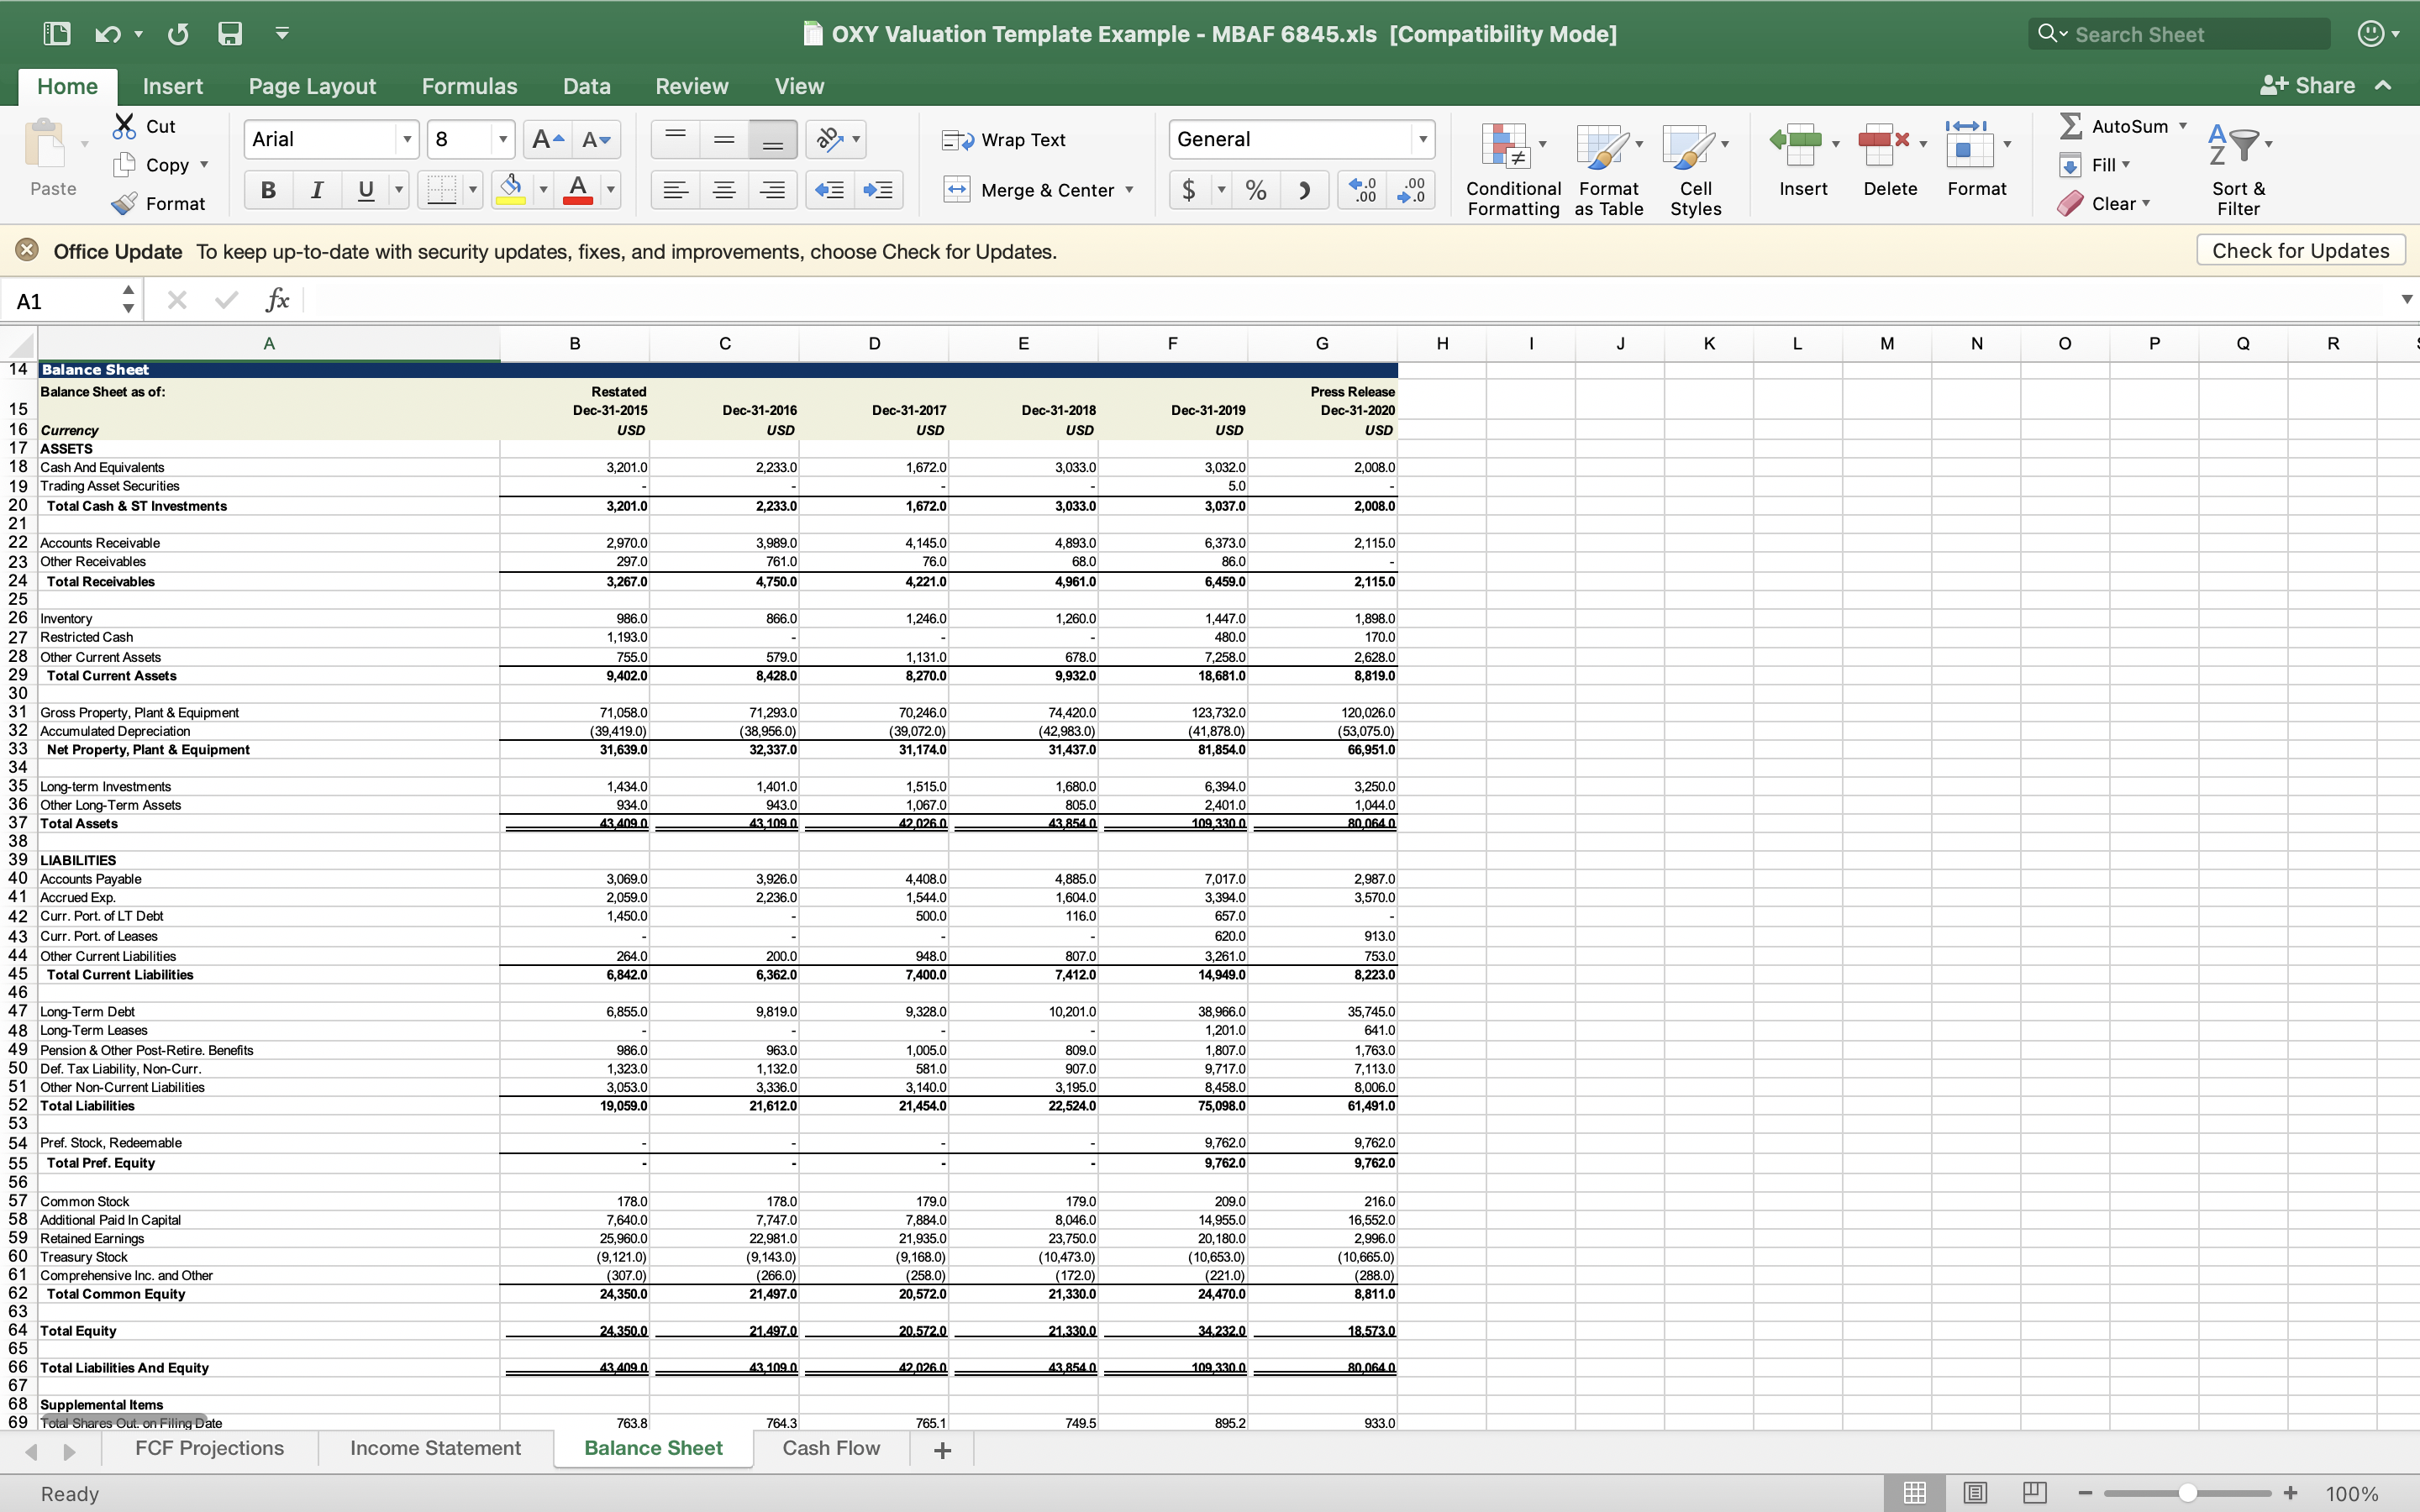
OXY Valuation Template Example - MBAF 6845.xIs [Compatibility Mode] Q ~ Search Sheet Home Insert Page Layout Formulas Data Review View '+ Share ~ X Cut Arial 8 A- A Wrap Text General _ AutoSum Copy Fill Paste Format BI UT Y Av Merge & Center $ ~ % " 200 .0 Conditional Format Cell Insert Delete Format Sort & Formatting as Table Styles Clear x Office Update To keep up-to-date with security updates, fixes, and improvements, choose Check for Updates. Check for Updates G1 fx B C D E H K L M N P Q R S T U v Occidental Petroleum Corporation (NYSE: OXY) > Financials > Income Statement Notes: The numbers used below are all hypothetical and are for illustrative purposes only to derive WACC and to make revenue projections 4 Team Names: You have to come up with your own actual verifiable & credible numbers to make your model estimates work. The introductory portion of pleted model template should start with a section that looks exactly as this dashboard: 6 Today's Date This is the date you submitted this spreadsheet Team Task: Dashboard - Assumptions WACC estimate . Using data from OXY 2020 10K, Yahoofinance, and Capital IQ, find input data that you can use to compute W ACC estimate for OXY. 10 Estimate Credible explanation for this estimate Estimate Credible explanation for this estimate 2. Using OXY 10K, https:/www.marketwatch.com/investing/stock/OXY /analyst estimates and other online sources, find the input values in the estimation of revenue for 11 WACC 5.36% Debt 61,491.00 https://www.capitaliq.com/CIQDotNet/Financial/BalanceSheet. 3. Complete OXY cash flow projection for 2021 highlighted in BLUE. 12 Long-term/terminal growth rate -6.27% https:/csimarket.com/stocks/growthrates.php?code=OXY Equity 18,573.00 4. Compute the estimated free cash flows in lines 78 and 82. 13 MMIs of Oil (based on 2021 projection) 1140 Value of firm 80,064.00 Output 5. Compute the market value of OXY in Cell B84 14 Price per barrell of oil $33.0 Weight of debt 76.80% S. Estimate the stock price of OXY in Cell B88. 15 BGFC of Gas (based on 2021 projection) 800 Weight of equity 23.20% 16 Average price/rate for gas $1.95 Beta 2.5 17 MMIs of NGL (based on 2021 projection) 110 Risk-free rate 1.47% 18 Average price/rate for NGL 20.25 Market premium 5.50% 19 Midstream & Marketing 1,784 Cost of equity 15.22% 20 Chemical 5,150 Interest payment 1.852 21 Tax rate 21% Total value of debt 61,491 22 Cost of debt 3.01% WACC= 5.36% 24 Revenue from oil & gas $41,407.50 26 2021 projected revenue $48,341.50 You are going to reference cell C22 in the model to obtain a revenue value. 27 Highlighted in red are the THREE main sources/streams of revenue. 28 Three primary risks in using the model's result mitigating the Sanity checks: 1. result 32 1. 2 Historical Financials Projected financial Credible explanation for this projection Reclassified Press Release 12 months 12 months 12 months 45 Dec-31-2018 Dec-31-2019 Dec-31-2020 Next 12 months Estimate Total Revenue 17824 20393 17809 Credible explanation for this projected estimate: $48,341.50 46 47 COGS 6568 8337 8468 $21,753.68 Credible explanation for this projected estimate: 48 45% Gross Profit 11256 12056 9341 Total revenues - COGS D FCF Projections Income Statement Balance Sheet Cash Flow + Ready + 76%OXY Valuation Template Example - MBAF 6845.xIs [Compatibility Mode] Q ~ Search Sheet Home Insert Page Layout Formulas Data Review View '+ Share ~ X Cut Arial 8 A- A Wrap Text General _ AutoSum Copy AP. Fill Paste BI UT Y Av Merge & Center $ % " Conditional Format Cell Insert Delete Format Sort & Format Formatting as Table Styles Clear x Office Update To keep up-to-date with security updates, fixes, and improvements, choose Check for Updates. Check for Updates G1 D E H J K L M N P Q R S T U v 40 Historical Financials Projected financial Credible explanation for this projection Reclassified Press Release 12 months 12 months 12 months 45 Dec-31-2018 Dec-31-2019 Dec-31-2020 Next 12 months Estimate Total Revenue 17824 20393 17809 Credible explanation for this projected estimate: $48,341.50 46 47 COGS 6568 8337 8468 $21,753.68 Credible explanation for this projected estimate: 48 45% Gross Profit 11256 1205 9341 Total revenues - COGS 50 Gross margin (COGS / Revenus %) 63.2% 59.1% 52.5% credible explanation for the change in your gross margin %: 52 Selling General & Admin Exp. 585 882 364 Credible explanation for this projected estimate: Exploration/Drilling Costs 110 246 132 Credible explanation for Provision for Bad Debts R & D Exp. Depreciation & Amort. 3977 5981 8097 Credible explanation for this projected estimate: 57 Impair. of Oil, Gas & Mineral Prop. 416 285 709 Credible explanation for this projected estimate: 58 Other Operating Expense/(Income) 1467 2083 1506 Credible explanation for this projected estimate: 59 60 Other Operating Exp., Total 6555 9477 17698 Total operating expenses 61 Operating Income 4701 2579 -8357 COGS - Total Operating expenses FCF Projections Income Statement Balance Sheet Cash Flow + Ready + 76%OXY Valuation Template Example - MBAF 6845.xIs [Compatibility Mode] Q Search Sheet Home Insert Page Layout Formulas Data Review View '+ Share ~ X Cut Arial 8 A- A Wrap Text General _ AutoSum Copy Fill Paste Merge & Center $ ~ % > Conditional Format Cell Insert Delete Format Sort & Format Formatting as Table Styles Clear x Office Update To keep up-to-date with security updates, fixes, and improvements, choose Check for Updates. Check for Updates G1 X V fx B C D E F H I J K L M N P Q R S T U v Other Operating Exp., Total 6555 9477 17698 Total operating expenses 62 Operating Income (EBIT) 4701 2579 -8357 COGS - Total Operating expenses SG&A margin (SG&A / Revenuse %) 3.3% 4.3% 4 9% Credible explanation for the change in your SG&A margin % EBIT margin (EBIT / Revenues %) 26.4% 12.6% -46.9% Credible explanation for the change in your EBIT margin %: 65 66 Total Capital Expenditures -4975 -6355 -2649 Credible explanation for this projected estimate: 67 68 Change in NWC Credible explanation for this projected estimate: 69 Tax rate Credible explanation for this projected estimate: 71 72 FCF for historical years and for next 12 months State the formula that you are using to calculate FCF: 73 FCF after the next 12 months 75 Reason(s) for the FCF projections after the next 12 months Credible explanation of your reasons for years 2, 3, and for the value you put on all FCFs after the end of year 3: 77 Year FCF projections F73 G78 = F78*(1+LTGR) H78 = G78*(1+LTGR) 79 TV = H78*(1+LTGR)/(WACC- LTGR) 80 FCF estimates for all years 81 Year 82 FCF G78 H78 + 179 83 84 Market value of OXY = Present value of all FCFs = [npv(WACC. F82..h82) 85 36 Shares outstanding (from balance sheet) 935 million 87 88 Price per share (Market value / Shares outstanding) B84/B86 Explain how your stock price makes sense to the executives: 89 90 FCF Projections Income Statement Balance Sheet Cash Flow + Ready + 76%OXY Valuation Template Example - MBAF 6845.xIs [Compatibility Mode] Q ~ Search Sheet Home Insert Page Layout Formulas Data Review View '+ Share ~ X Cut Arial 8 A- A Wrap Text General _ AutoSum Copy AP. Fill Paste Delete Sort & Format Merge & Center $ % > Conditional Format Cell Insert Format Formatting as Table Styles Clear x Office Update To keep up-to-date with security updates, fixes, and improvements, choose Check for Updates. Check for Updates G1 X V fx B C D E G H 1 J K M N 0 P Q R S T U v 65 66 Total Capital Expenditures -4975 -6355 -2649 Credible explanation for this projected estimate: 67 68 Change in NWC Credible explanation for this projected estimate: 69 Tax rate Credible explanation for this projected estimate: 72 FCF for historical years and for next 12 months State the formula that you are using to calculate FCF: 73 FCF after the next 12 months 75 Reason(s) for the FCF projections after the next 12 months Credible explanation of your reasons for years 2, 3, and for the value you put on all FCFs after the end of year 3: 76 77 Year 78 FCF projections F73 G78 = F78*(1+LTGR) H78 = G78*(1+LTGR) 79 TV = H78*(1+LTGR)/(WACC - LTGR) 80 FCF estimates for all years 81 Year 82 FCF F78 G78 H78 + H79 83 84 Market value of OXY = Present value of all FCFs = [npv(WACC, F82..h82) 85 86 Shares outstanding (from balance sheet)= 933 million 37 88 Price per share (Market value / Shares outstanding) B84/B86 Explain how your stock price makes sense to the executives: 89 90 91 DATA TABLES Check the closing price for OXY on Yahoofinance.com and see how your price compares to the market price. Why is your price higher/lower than the market price? 92 93 Sensitivity analysis for the impact of WACC and long term FCF growth rate on stock price Long term FCF growth rate Price per share: WAAC 101 102 103 104 105 FCF Projections Income Statement Balance Sheet Cash Flow + Ready + 76%OXY Valuation Template Example - MBAF 6845.xIs [Compatibility Mode] Q ~ Search Sheet Home Insert Page Layout Formulas Data Review View '+ Share ~ X Cut Arial 8 A- A Wrap Text General _ AutoSum Copy Fill Paste Format Merge & Center $ ~ % " 100 .0 Conditional Format Cell Insert Delete Format Sort & Formatting as Table Styles Clear x Office Update To keep up-to-date with security updates, fixes, and improvements, choose Check for Updates. Check for Updates A29 X V fx Depreciation & Amort. C E F G H J K L M N O P Q R S T Occidental Petroleum Corporation (NYSE:OXY) > Financials > Income Statement share items. Template: Standard Restatement: Latest Filings Period Type: Annual Order: Latest on Right Currency: Reported Currency Conversion: 10 Today's Spot Rate Units: S&P Capital IQ (Default) Decimals: Capital IQ (Default) 11 Source: Capital IQ & Proprietary 12 13 14 Income Statement Reclassified Reclassified Reclassified Press Release For the Fiscal Period Ending 12 months 12 months 12 months 12 months 12 months 12 months 15 Dec-31-201 Dec-31-2016 Dec-31-2017 Dec-31-2018 Dec-31-2019 Dec-31-2020 16 Currency USD USD USD USD USD USD 17 18 Revenue 12,480.0 10,090.0 12,508.0 17,824.0 20,393.0 17,809.0 19 Other Revenue 20 Total Revenue 12,480.0 10,090.0 12,508.0 17,824. 20,393.0 17,809.0 21 Cost Of Goods Sold 5,804.0 5,189.0 5,594.0 6,568.0 8,337.0 8,468.0 23 Gross Profit 6,676.0 4.901.0 6,914. 11,256. 12,056.0 9.341.0 24 25 Selling General & Admin Exp. 1,270.0 1,330.0 546.0 585.0 882.0 864.0 26 Exploration/Drilling Costs 36.0 62.0 22 0 410 0 246.0 132.0 27 Provision for Bad Debts 541.0 R & D Exp. 29 Depreciation & Amort. 4,544.0 4,268.0 4,002.0 3,977.0 5,981.0 8,097.0 30 Impair. of Oil, Gas & Mineral Prop. 5,024.0 401.0 416. 285.0 7.099.0 31 Other Operating Expense/(Income) 343.0 277.0 1,189.0 1,467.0 2,083.0 ,506.0 32 33 Other Operating Exp., Total 11,217.0 6,478.0 6,220.0 6,555. 9,477.0 17,698.0 34 35 Operating Income (4,541.0) (1,577.0) 694.0 4,701.0 2,579.0 (8,357.0) 36 37 Interest Expense (141.0) (275.0) (324.0) (356.0) (769.0) (1,847.0) 38 Interest and Invest. Income 118. 106.0 99.0 136.0 217.0 118.0 39 Net Interest Exp. 23.0) (169.0) (225.0) (220.0 (552.0) (1,729.0) 40 41 In Income/(Loss) from Affiliates 208.0 181.0 357.0 331.0 373.0 370.0 42 Other Non-Operating Inc. (Exp.) (6.0) (17.0 (45.0) (178.0) (99.0) (3,984.0 EBT Excl Unusual Items (4,362.0) (1,582.0) 781.0 4 6340 44 2,301.0 (13,700.0) 45 Restructuring Charges (3,520.0) (61.0) 46 Merger & Related Restruct. Charges (1,647.0) (339.0) 47 Impairment of Goodwill 48 Gain (Loss) On Sale Of Invest. (126.0) 124.0 667.0 374.0 622.0 49 Gain (Loss) On Sale Of Assets (1,002.0) (1,666.0) 50 Asset Writedown 1,151.0) 15.0 (120.0) 51 Other Unusual Items (317.0) (160.0) (88.0) 52 EBT Incl. Unusual Items (9,476.0) (1,664.0) 1,328.0 5,608.0 186.0 (15,705.0) Income Tax Expense (1,330.0) (662.0) 17.0 1,477.0 693.0 (2,172.0 55 Earnings from Cont. Ops. (8,146.0) (1,002.0) 1,311.0 4,131.0 507.0 13,533.0 56 57 Earnings of Discontinued Ops 317.0 428.0 (15.0) (1,298.0) FCF Projections Income Statement Balance Sheet Cash Flow + Ready + 100%OXY Valuation Template Example - MBAF 6845.xIs [Compatibility Mode] Q ~ Search Sheet Home Insert Page Layout Formulas Data Review View '+ Share ~ X Cut _ AutoSum Arial 8 A- A Wrap Text General AP. Copy Fill Paste Merge & Center $ ~ % " 100 .0 Conditional Format Cell Insert Delete Format Sort & Format Formatting as Table Styles Clear x Office Update To keep up-to-date with security updates, fixes, and improvements, choose Check for Updates. Check for Updates A1 4 X V J B C D E F G H K M N O P Q R 14 Balance Sheet Balance Sheet as of: Restated Press Release 15 Dec-31-2015 Dec-31-2016 Dec-31-2017 Dec-31-2018 Dec-31-2019 Dec-31-2020 16 Currency USD USD USD USD USD USD 17 ASSETS 18 Cash And Equivalents 3,201.0 2,233.0 1,672.0 3,033.0 3,032.0 2,008.0 19 Trading Asset Securities 5.0 20 Total Cash & ST Investments 3,201.0 2,233.0 1,672.0 3,033.0 3,037.0 2,008.0 21 22 Accounts Receivable 2,970.0 3,989.0 4,145.0 .893.0 6,373.0 2,115.0 23 Other Receivables 297. 761.0 76.0 68.0 86.0 24 Total Receivables 3,267.0 4,750.0 4.221.0 4,961.0 6,459.0 2,115.0 25 26 1 Inventory 986. 866.0 1,246.0 ,260.0 1,447.0 1,898.0 27 Restricted Cash 1,193.0 480. 1/0.0 28 Other Current Assets 755.0 579.0 1,131.0 678.0 7.258.0 2,628.0 29 Total Current Assets 9,402.0 8,428.0 8,270.0 9,932.0 18,681.0 8,819.0 30 31 Gross Property, Plant & Equipment 71,058.0 71,293.0 70,246.0 4,420.0 23,732.0 120,026.0 32 A Accumulated Depreciation 39,419.0) (38,956.0) 39,072. 42,983.0) (41,878.0) 53,075.0) 33 Net Property, Plant & Equipment 31,639.0 32,337.0 31,174.0 31 ,437.0 81,854.0 66,951.0 34 35 Long-term Investments 1,434.0 1,401.0 ,515.0 1,680.0 6,394.0 3,250.0 36 Other Long-Term Assets 934.0 943.0 1,067.0 805.0 2,401.0 1,044.0 37 Total Assets 43.409 0 43 109 0 42 026 0 3.854 0 109 330 0 80 064 0. 38 39 LIABILITIES 40 Accounts Payable 3,069.0 3,926.0 4,408.0 4,885.0 7,017.0 2,987.0 41 Accrued Exp. 2.059.0 2,236.0 1,544.0 .604.0 3.394.0 3.570.0 42 Curr. Port. of LT Debt 1,450.0 500.0 116.0 657.0 43 Curr. Port. of Leases 620.0 913.0 44 Other Current Liabilities 264.0 200.0 948.0 807.0 3,261.0 753.0 45 Total Current Liabilities 5,842. 6,362.0 7,400.0 ,412.0 14,949.0 8,223.0 46 47 Long-Term Debt 6,855.0 9,819.0 9,328.0 10,201.0 38,966.0 35,745.0 48 Long-Term Leases 1,201.0 641.0 49 Pension & Other Post-Retire. Benefits 986.0 963.0 1,005.0 809.0 1,807.0 1,763.0 50 Def. Tax Liability, Non-Curr. 1,323.0 1,132.0 581.0 907. 9,717.0 7,113.0 51 Other Non-Current Liabilities 3,053.0 3,336.0 3,140.0 3, 195.0 8,458.0 B,006.0 52 Total Liabilities 9,059.0 1,612.0 21,454.0 22,524.0 75,098.0 1,491.0 53 54 Pref. Stock, Redeemable 9,762.0 9,762.0 55 Total Pref. Equity 9,762.0 9,762.0 56 57 Common Stock 178.0 178.0 179.0 179.0 209.0 216.0 58 Additional Paid In Capital 7,640.0 7,747.0 884.0 8,046.0 14,955.0 6.552.0 59 Retained Earnings 25,960.0 22,981.0 1,935.0 23,750.0 20, 180.0 2,996.0 60 Treasury Stock (9,121.0) 9,143.0) (9,168.0) 10,473.0) 10,653.0) (10,665.0) 61 Comprehensive Inc. and Other (307.0 266.0 (258.0 (172.0) (221.0 (288.0) 62 Total Common Equity 4,350.0 1,497.0 20,572.0 1,330.0 4,470.0 8,811.0 63 64 Total Equity 24.350.0 21.497.0 20.572.0 21.330.0 34.232.0 18.573.0 65 66 Total Liabilities And Equity 43.409 0 43 109 0 42 026 0 43 854 0 109 330 0 _80 064 0 67 68 Supplemental Items 69 Total Shares Out. on Filing Date 763. 764.3 765.1 749.5 895.2 933.0 FCF Projections Income Statement Balance Sheet Cash Flow + Ready + 100%