

Question: P 4 . 8 To get more practice in the use of the modified Bergeron - plot method, redo example 4 . 7 for a
P To get more practice in the use of the modified Bergeronplot method, redo example for a transmission line.
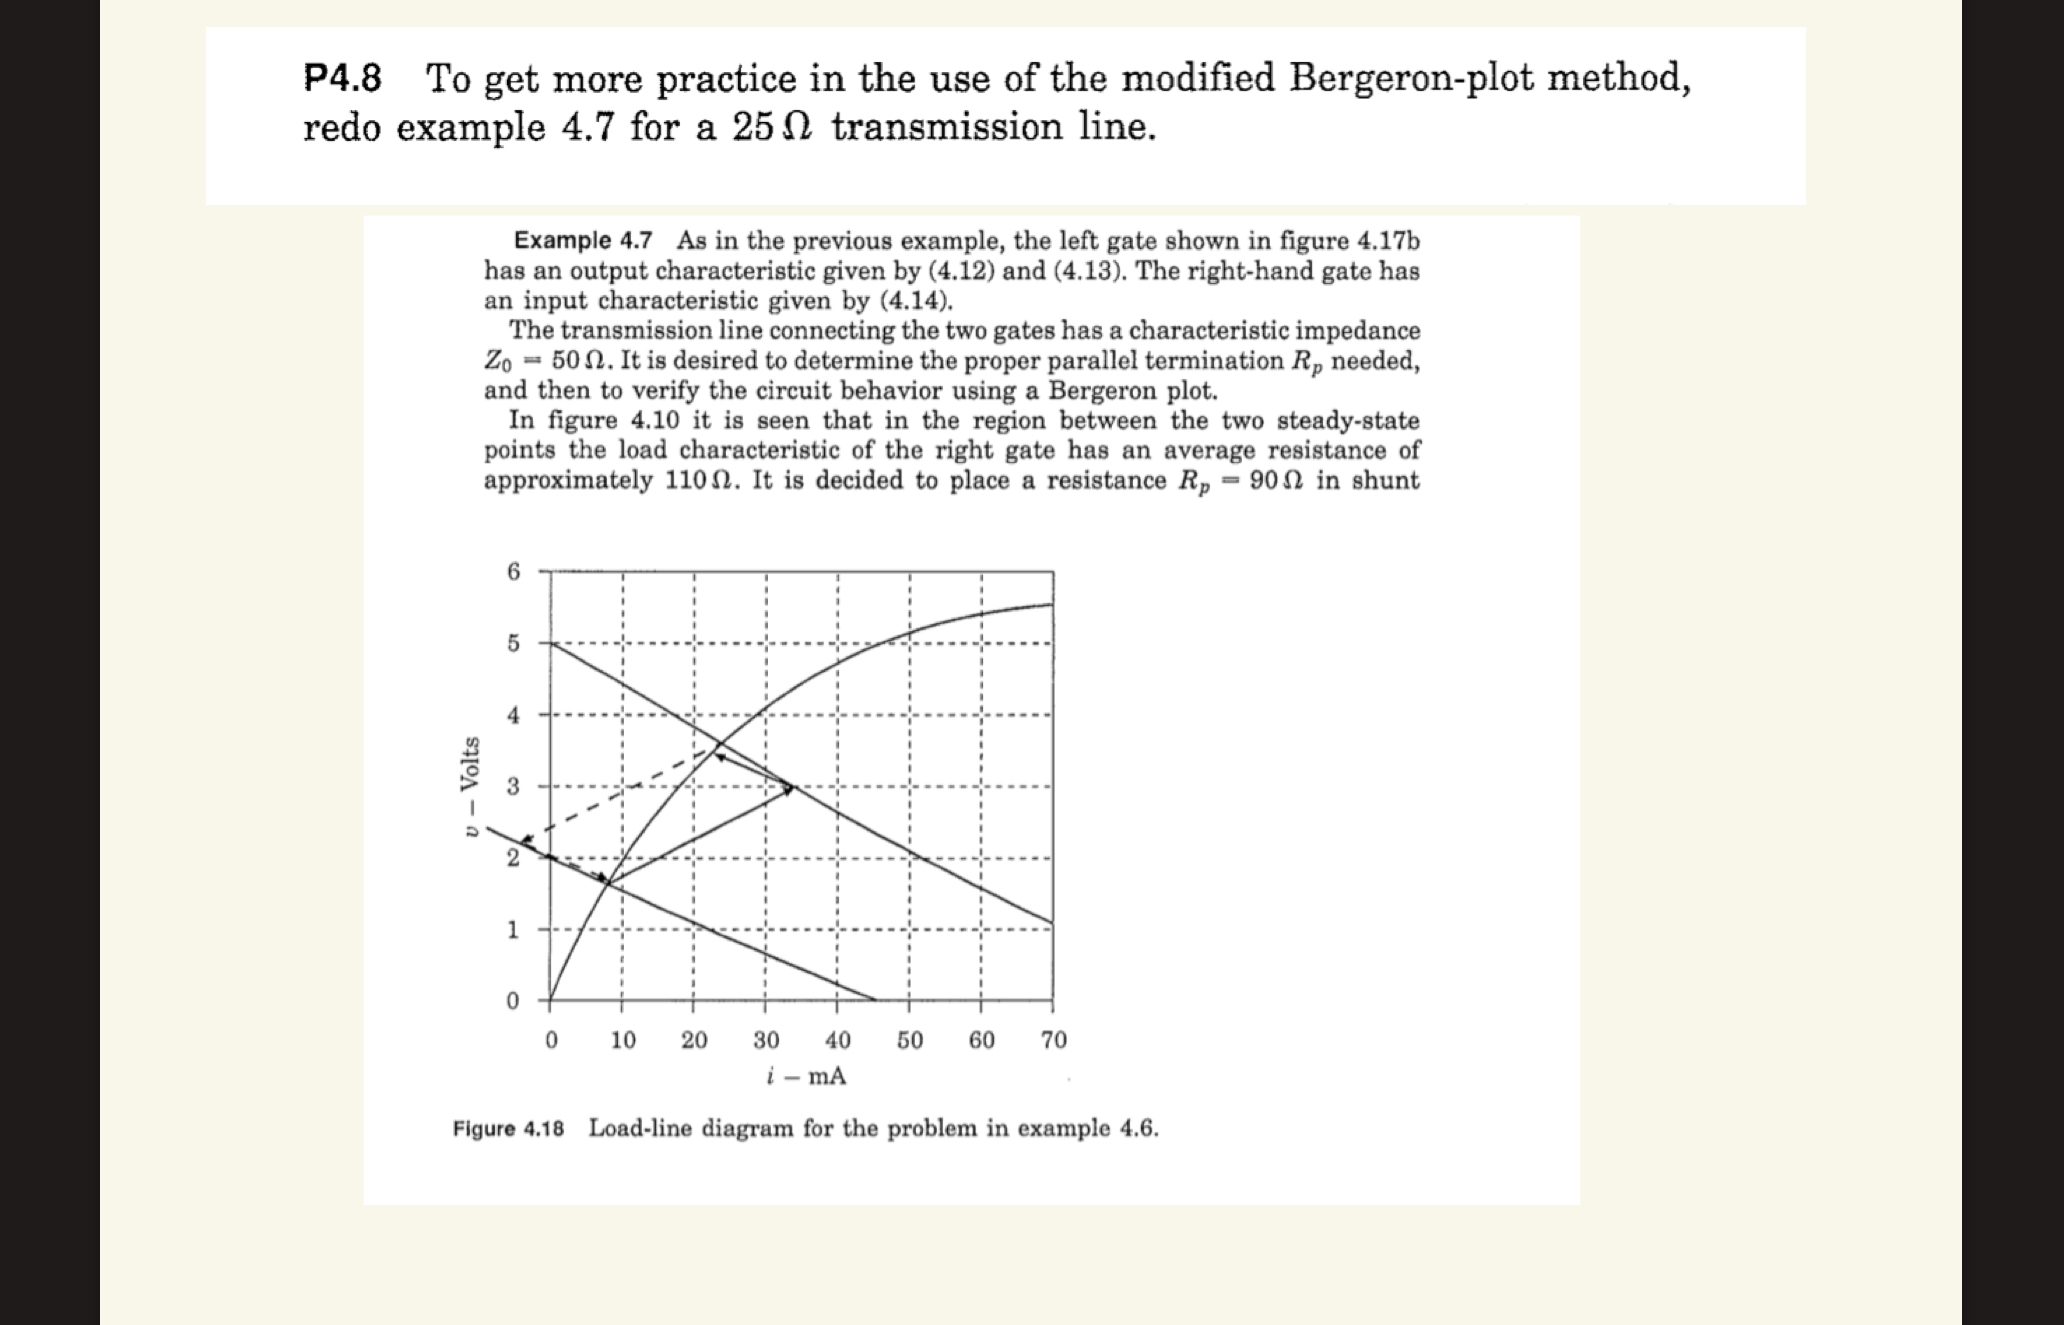
Example As in the previous example, the left gate shown in figure b has an output characteristic given by and The righthand gate has an input characteristic given by
The transmission line connecting the two gates has a characteristic impedance It is desired to determine the proper parallel termination needed, and then to verify the circuit behavior using a Bergeron plot.
In figure it is seen that in the region between the two steadystate points the load characteristic of the right gate has an average resistance of approximately It is decided to place a resistance in shunt
Figure Loadline diagram for the problem in example
Step by Step Solution
There are 3 Steps involved in it
1 Expert Approved Answer
Step: 1 Unlock

Question Has Been Solved by an Expert!
Get step-by-step solutions from verified subject matter experts
Step: 2 Unlock
Step: 3 Unlock