

Question: P 4 . Plot the following equations in their own individual subplots. Arrange the subplots so that there is 1 row and 3 columns of
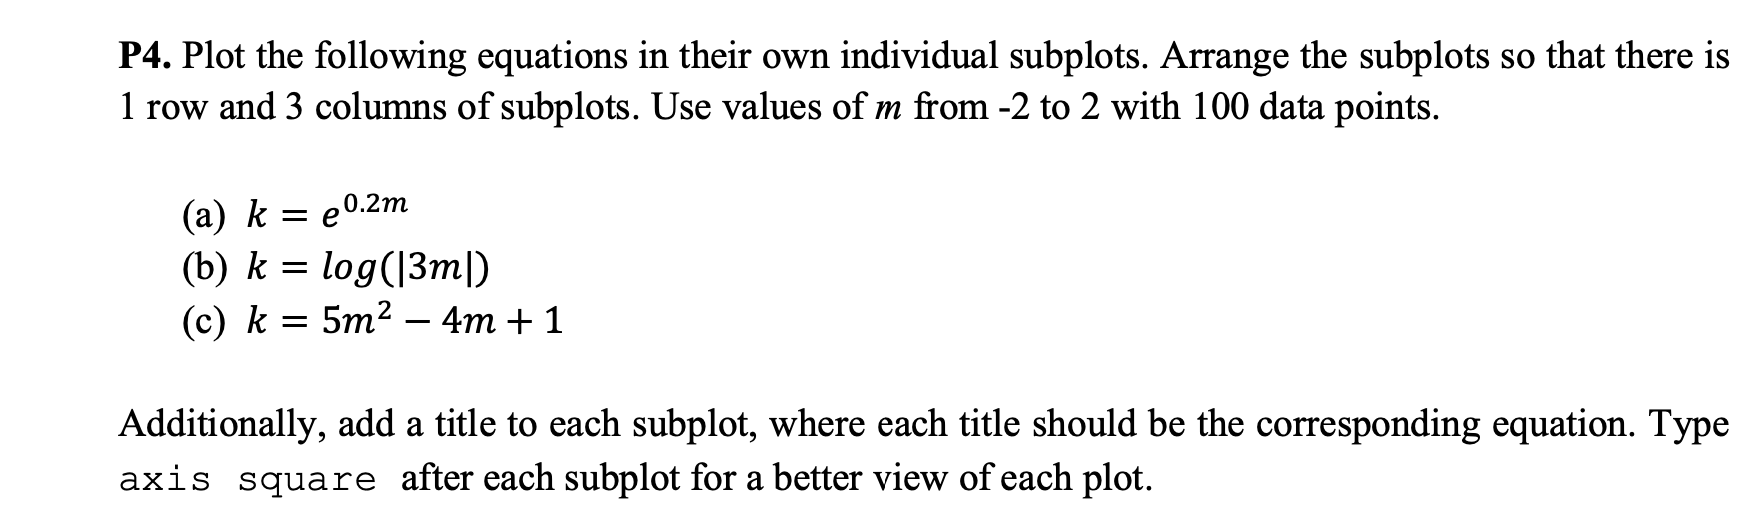
P Plot the following equations in their own individual subplots. Arrange the subplots so that there is
row and columns of subplots. Use values of from to with data points.
a
b
c
Additionally, add a title to each subplot, where each title should be the corresponding equation. Type
axis square after each subplot for a better view of each plot.
Step by Step Solution
There are 3 Steps involved in it
1 Expert Approved Answer
Step: 1 Unlock

Question Has Been Solved by an Expert!
Get step-by-step solutions from verified subject matter experts
Step: 2 Unlock
Step: 3 Unlock