

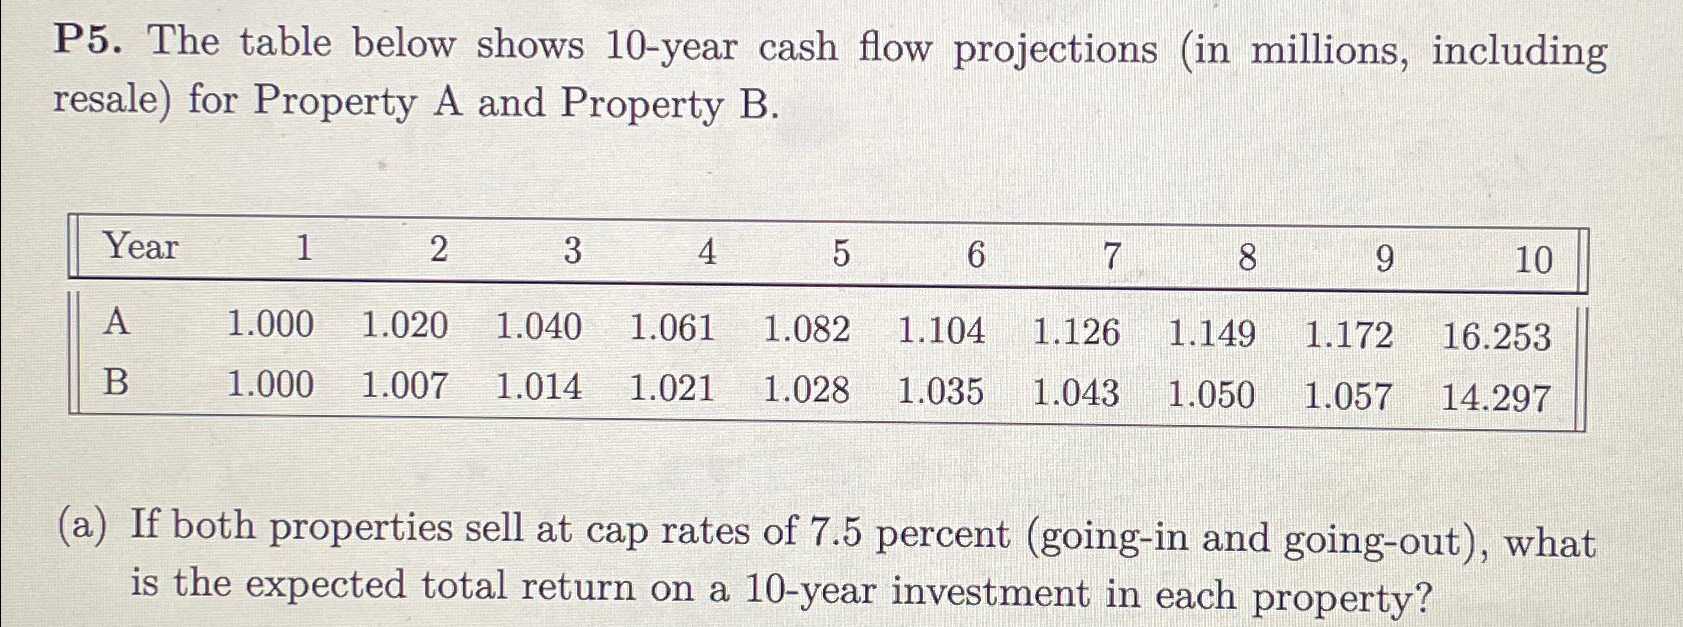
Question: P 5 . The table below shows 1 0 - year cash flow projections ( in millions, including resale ) for Property A and Property
P The table below shows year cash flow projections in millions, including resale for Property A and Property B
tableYearAB
a If both properties sell at cap rates of percent goingin and goingout what is the expected total return on a year investment in each property? Answer as a percentage
Step by Step Solution
There are 3 Steps involved in it
1 Expert Approved Answer
Step: 1 Unlock

Question Has Been Solved by an Expert!
Get step-by-step solutions from verified subject matter experts
Step: 2 Unlock
Step: 3 Unlock