

Question: P 8 - 2 0 Portfolio efficiency The following table provides the expected return and standard deviation for four portfolios. Plot each portfolio's risk -
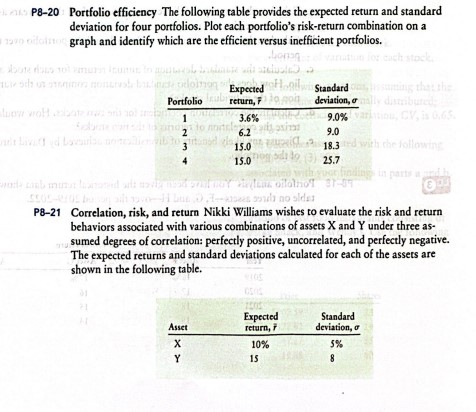
P Portfolio efficiency The following table provides the expected return and standard
deviation for four portfolios. Plot each portfolio's riskreturn combination on a
graph and identify which are the efficient versus inefficient portolios.
P Correlation, risk, and return Nikki Williams wishes to evaluate the risk and return
behaviors associated with various combinations of assets and under three as
sumed degrees of correlation: perfectly positive, uncorrelated, and perfectly negative.
The expected returns and standard deviations calculated for each of the assets are
shown in the following table.
Step by Step Solution
There are 3 Steps involved in it
1 Expert Approved Answer
Step: 1 Unlock

Question Has Been Solved by an Expert!
Get step-by-step solutions from verified subject matter experts
Step: 2 Unlock
Step: 3 Unlock