

Question: P b - B i phase diagram is given below. x B 1 for given temperatures, i . e . , T 1 and T
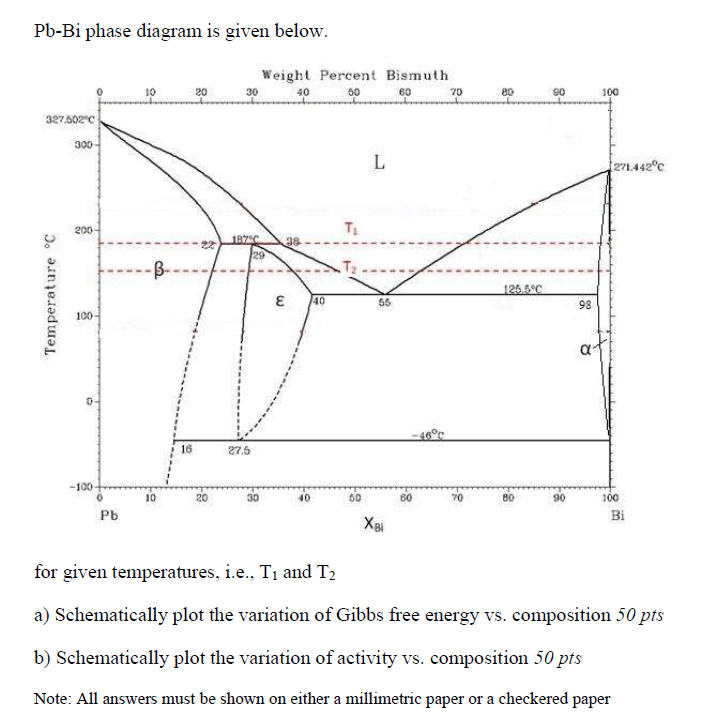
phase diagram is given below.
for given temperatures, ie and
a Schematically plot the variation of Gibbs free energy vs composition pts
b Schematically plot the variation of activity vs composition
Note: All answers must be shown on either a millimetric paper or a checkered paper
Step by Step Solution
There are 3 Steps involved in it
1 Expert Approved Answer
Step: 1 Unlock

Question Has Been Solved by an Expert!
Get step-by-step solutions from verified subject matter experts
Step: 2 Unlock
Step: 3 Unlock