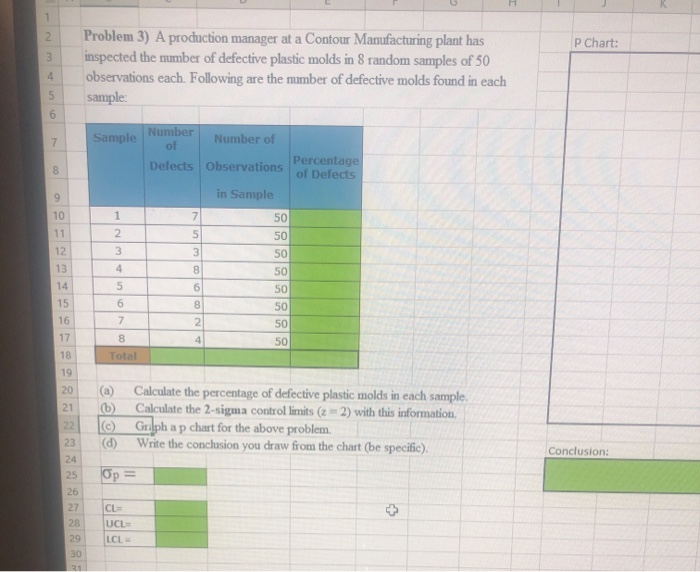
Question: P Chart: Problem 3) A production manager at a Contour Manufacturing plant has inspected the mmber of defective plastic molds in 8 random samples of

P Chart: Problem 3) A production manager at a
P Chart: Problem 3) A production manager at a Contour Manufacturing plant has inspected the mmber of defective plastic molds in 8 random samples of 50 observations each. Following are the number of defective molds found in each sample: Sample Number of Number of Detects Onservation Percentage of Defects in Sample 50 Total (a) (6) c) (d) Calculate the percentage of defective plastic molds in each sample. Calculate the 2-sigma control limits ( 2 2) with this information, Graph a p chart for the above problem. Write the conclusion you draw from the chart (be specific). Conclusion: Op = P Chart: at has es of 50 und in each ch sample ommation fic) Conclusion

Step by Step Solution

There are 3 Steps involved in it

1 Expert Approved Answer
Step: 1 Unlock blur-text-image
Question Has Been Solved by an Expert!

Get step-by-step solutions from verified subject matter experts

Step: 2 Unlock
Step: 3 Unlock

Students Have Also Explored These Related General Management Questions!