

Question: P P 10 $9 $59 $7 5 E 5' . we 0 100200 350 Q 0 100120 200 Q The graphs represent the demand for
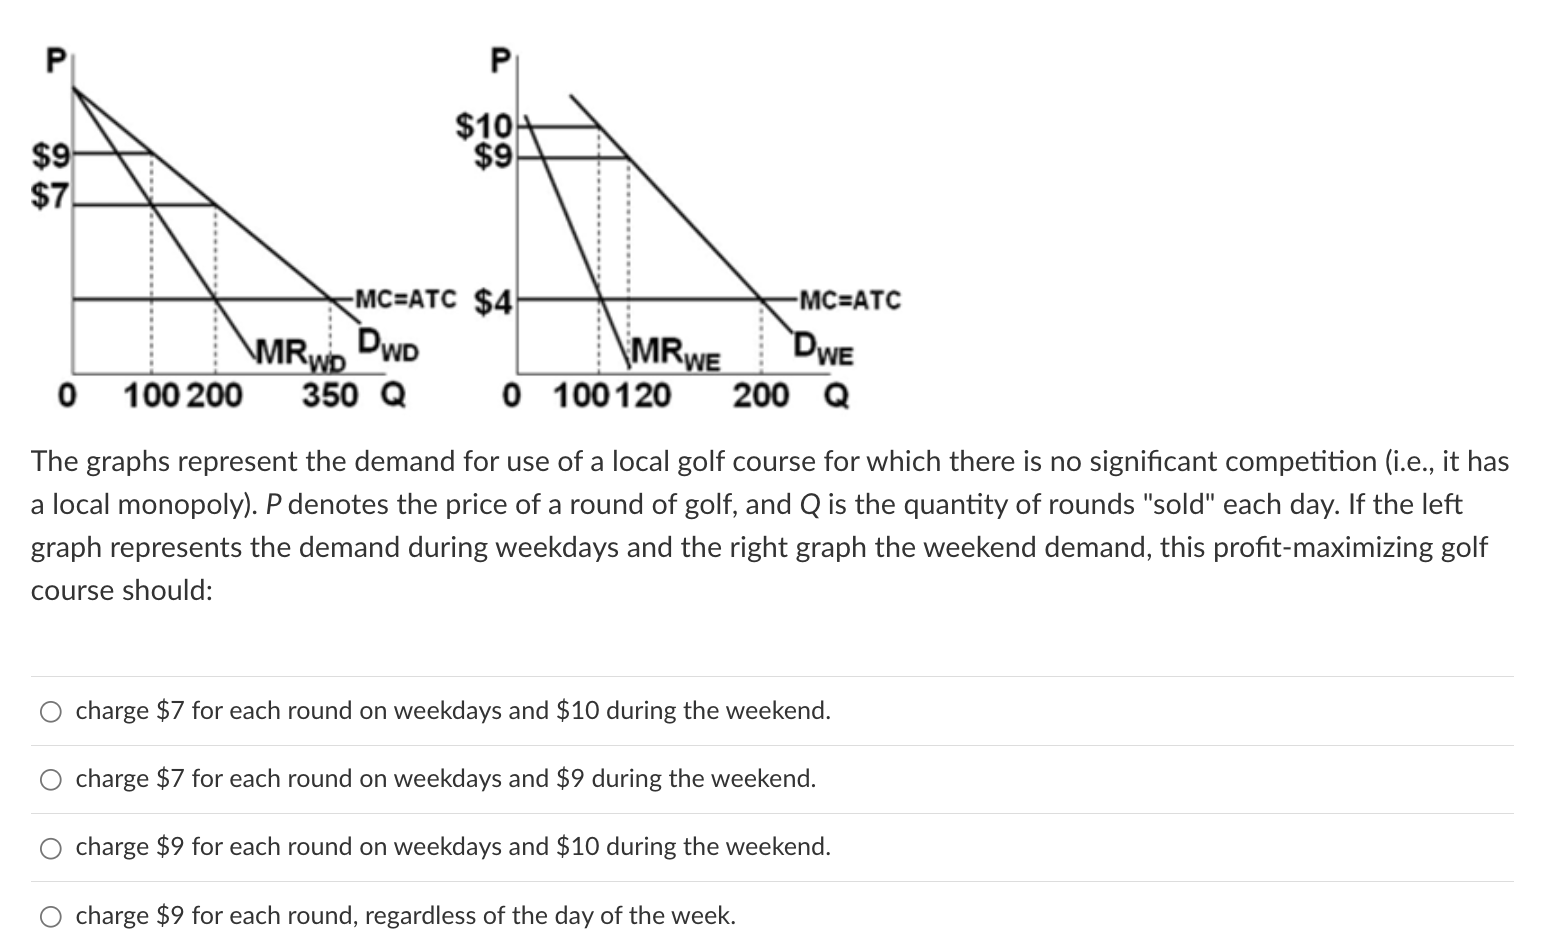
P P 10 $9 $59 $7 5 E 5' . we 0 100200 350 Q 0 100120 200 Q The graphs represent the demand for use of a local golf course for which there is no signicant competition (i.e., it has a local monopoly). P denotes the price of a round of golf, and Q is the quantity of rounds "sold" each day. If the left graph represents the demand during weekdays and the right graph the weekend demand, this prot-maximizing golf course should: charge $7 for each round on weekdays and $10 during the weekend. charge $7 for each round on weekdays and $9 during the weekend. charge $9 for each round on weekdays and $10 during the weekend. 0000 charge $9 for each round, regardless of the day of the week. Find the economic prot of a monopolist using the following information: Demand: p = 1003Q Fixed cost: FC = 150 Marginal cost: MC = 10 Find the economic prot of a monopolist using the following information: Demand: p = 1303Q Total cost: TC = 100 + 30
Step by Step Solution
There are 3 Steps involved in it

Get step-by-step solutions from verified subject matter experts