

Question: p The Question 1 tab in the Excel spreadsheet has information about a sample of recently sold houses in Nova Scotia. (a) For each of
 p
p
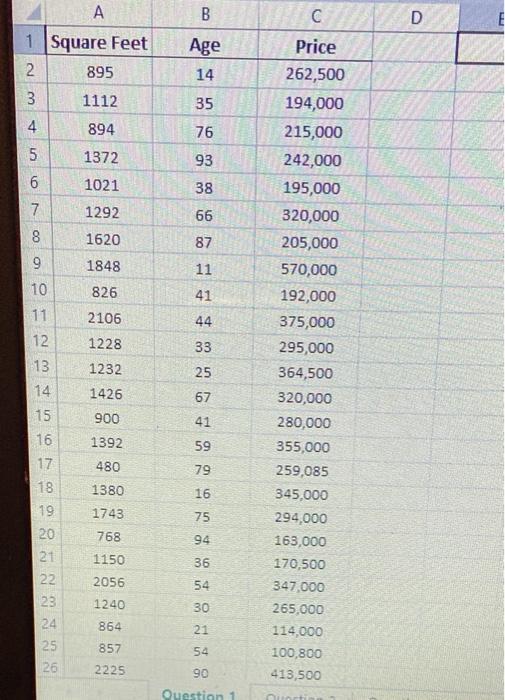
The "Question 1" tab in the Excel spreadsheet has information about a sample of recently sold houses in Nova Scotia. (a) For each of the three variables, would you conclude that the data are approximately normally distributed? Justify your conclusion. (b) For each of the three pairs of variables, how would you characterize the relationship between the two variables.
Step by Step Solution
3.42 Rating (152 Votes )
There are 3 Steps involved in it
a To check whether the variables are approximately normally distributed a histogram for each of the ... View full answer

Get step-by-step solutions from verified subject matter experts
Document Format (2 attachments)
6094e464da506_207147.pdf
180 KBs PDF File
6094e464da506_207147.docx
120 KBs Word File