

Question: P10-28 (similar to) , Question Help | * Given the spreadsheet, EE.containing the realized return of the S&P 500 from 1926-2014. Starting in 1929, divide
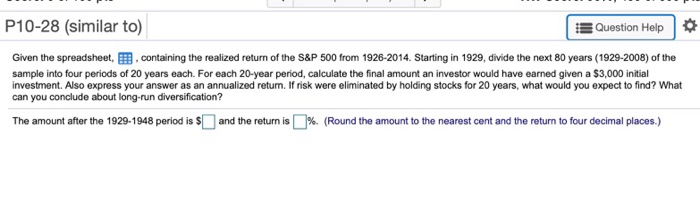
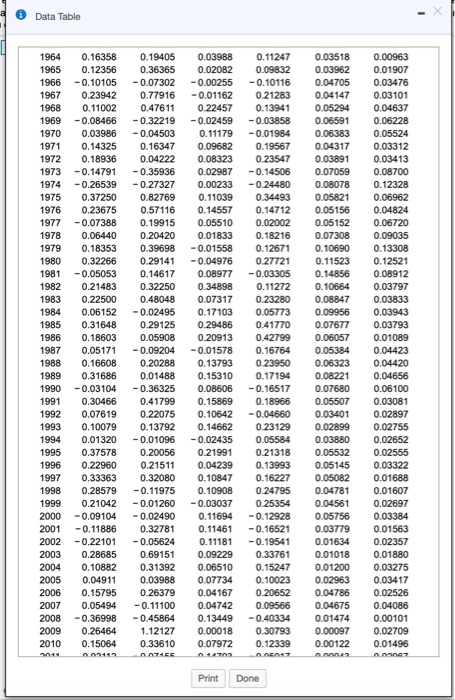
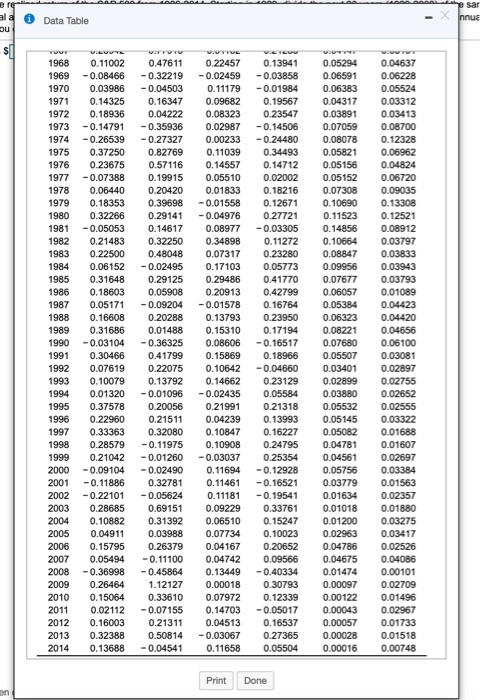
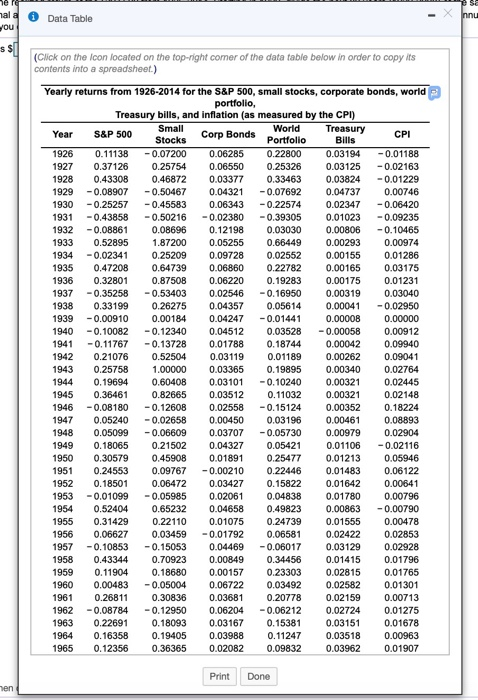
P10-28 (similar to) , Question Help | * Given the spreadsheet, EE.containing the realized return of the S&P 500 from 1926-2014. Starting in 1929, divide the next 80 years (1929-2008) of the sample into four periods of 20 years each. For each 20-year period, calculate the final amount an investor would have earned given a $3,000 initial investment. Also express your answer as an annualized return. If risk were eliminated by holding stocks for 20 years, what would you expect to find? What can you conclude about long-run diversification? The amount after the 1929-1948 period is S and the return is %. Round the amount to the nearest cent and the return to four decimal places. Data Table 1964 0.16358 0.19405 0.03988 0.11247 .03518 0.00963 1965 0.12356 0.36365 0.02082 0.09832 0.03962 0.01907 1966 -0.10105 0.07302 -0.00255-0.10116 0.04705 0.03476 1967 0.23942 0.77916 -0.01162 0.21283 0.04147 0.03101 1968 0.11002 0.47611 022457 0.13941 0.05294 0.04637 1969 -0.08466 0.322190.02459-0.03858 0.06591 0.06228 1970 0.03986-0.04503 0.11179 -0.01984 971 0.14325 0.16347 0.09682 0.19567 0.04317 0.03312 1972 0.18936 0.04222 0.08323 0.23547 0.03891 0.03413 1973-0.14791-0.35936 0.02987 -0.14506 0.07059 0.08700 974-0.26539 0.27327 0.00233-0.24480 0.08078 0.12328 1975 0.37250 0.82769 0.11039 0.34493 0.05821 0.06962 1976 0.23675 0.57116 0.14557 0.14712 0.05156 0.04824 977-0.07388 0.19915 0.05510 0.02002 0.05152 0.06720 978 0.06440 0.20420 0.01833 0.18216 0.07308 0.09035 1979 0.18353 0.396980.01558 0.12671 010690 0.13308 1980 0.32266 0.29141-0.04976 0.27721 0.11523 0.12521 981 -0.05053 0.14617 0.08977-0.03305 0.14856 0.08912 1982 0.21483 0.32250 0.34898 0.11272 0.10664 0.03797 1983 0.22500 0.48048 0.07317 0.23280 0.08847 0.03833 984 0.06152 -0.02495 0.17103 0.05773 0.09956 0.03943 1985 0.31648 0.29125 0.29486 041770 0.076770.03793 1986 0.18603 0.05908 020913 0.42799 0.06057 0.01089 987 0.05171 -0.092040.01578 0.16764 0.05384 0.04423 1988 0.16608 0.20288 0.13793 0.23950 0.06323 004420 1989 0.31686 0.01488 0.15310 0.17194 0.08221 0.04656 990 -0.03104 0.36325 0.08606-0.16517 0.07680 0.06100 1991 0.30466 0.41799 015869 0.18966 0.05507 0.03081 1992 0.07619 0.22075 0.10642-0.04660 0.03401 0.02897 993 0.10079 0.13792 0.14662 0.23129 0.02899 0.02755 994 0.01320 0.01096-0.02435 0.05584 0.03880 0.02652 1995 0.37578 0.20056 021991 0.21318 0.05532 0.02555 1996 0.22960 0.21511 0.04239 0.13993 0.05145 0.03322 997 0.33363 0.32080 0.10847 0.16227 .05082 0.01688 998 0.28579 0.11975 0.10908 0.24795 0.04781 0.01607 1999 0.21042 -0.01260 -0.03037 0.25354 0.04561 0.02697 2000 -0.09104 -0.02490 0.11694 0.12928 0.05756 0.03384 2001 -0.11886 0.32781 0.11461-0.16521 003779 0.01563 2002 -0.22101 -0.05624 0.11181-0.19541 001634 0.02357 2003 0.28685 0.69151 0.09229 0.33761 0.01018 0.01880 2004 0.10882 0.31392 0.06510 0.15247 001200 0.03275 2005 0.04911 0.03988 0.077340.10023 002963 0.03417 2006 0.15795 0.26379 0.04167 0.20652 004786 0.02526 2007 0.05494 0.11100 0.04742 0.09566 0.04675 0.04086 2008 0.36998 -0.45864 0.13449-040334 001474 0.00101 2009 0.26464 .12127 0.00018 0.30793 0.00097 0.02709 2010 0.15064 0.33610 0.07972 0.12339 0.00122 0.01496 Print Done Data Table 1968 0.11002 047611 0.22457 0.13941 1969-0.08466 -0.32219-0.02459 0.03858 0.06591 0.06228 1970 0.03986 0.04503 1971 0.14325 0.16347 0.09682 0.19567 0.04317 0.03312 1972 0.18936 0.04222 0.08323 0.23547 0.03891 0.03413 1973 -0.14791 -0.35936 0.02987 -0.14506 0.07059 0.08700 1974-0.26539-0.27327 0.00233 -0.24480 0.08078 0.12328 1975 0.37250 0.82769 0.11039 0.34493 0.05821 0.06962 1976 0.23675 0.57116 0.14557 0.14712 0.05156 0.04824 977-0.07388 0.1 1978 0.06440 0.20420 0.01833 0.18216 1979 0.18353 0.39698 -0.01558 0.12671 1980 0.32266 0.29141-0.04976 0.27721 981-0.05053 0.14617 0.08977 -0.03305 0.14856 008912 1982 0.21483 0.32250 0.34898 0.11272 0.10664 0.03797 1983 0.22500 048048 0.07317 0.23280 0.08847 0.03833 1984 0.06152 -0.02495 0.17103 0.05773 0.09956 0.03943 1985 0.31648 0.29125 0.29486 0.41770 0.07677 0.03793 1986 0.18603 0.05908 0.20913 0.42799 0.06057 0.01089 1987 0.05171 -0.09204-0.01578 0.16764 0.05384 0.04423 1988 0.16608 1989 0.31686 0.01488 0.15310 0.17194 0.08221 0.04656 1990-0.031040.36325 0.08606 -0.1651 1991 0.30466 0.41799 0.15869 0.18966 0.05507 O.03081 1992 0.07619 0.22075 0.10642 -0.04660 0.03401 0.02897 1993 0.10079 0.13792 0.14662 0.23129 1994 0.01320 -0.01096-0.02435 0.05584 0.03880 0.02652 1995 0.37578 1996 0.22960 0.21511 0.04239 0.13993 0.05145 0.03322 1997 0.33363 0.32080 0.10847 0.16227 0.05082 0.01688 1998 0.285790.11975 0.10908 0.24795 1999 0.21042-0.012600.03037 0.25354 0.04561 0.02697 2000-0.09104 0.02490 0.11694 0.12928 0.05756 0.03384 2001 -0.11886 0.32781 0.11461-0.16521 2002-0.22101-0.05624 2003 0.28685 0.69151 0.09229 0.33761 2004 0.10882 0.31392 0.06510 0.15247 2005 0.04911 0.03988 0.07734 0.10023 0.02963 0.03417 2006 0.15795 0.263790.04167 0.20652 0.04786 0.02526 2007 0.05494 0.11100 0.04742 0.09566 0.04675 0.04086 2008 -0.36998-0.45864 0.13449-0.40334 0.01474 0.00101 2009 0.26464 12127 0.00018 0.30793 0.00097 O.02709 2010 0.15064 0.33610 0.07972 0.12339 2011 0.021120.07155 0.14703 -0.05017 0.00043 0.02967 2012 0.16003 0.21311 0.04513 0.16537 2013 0.32388 0.508140.03067 0.27365 0.00028 001518 2014 0.136880.04541 0.11658 0.05504 0.00016 0.00748 0.05294 0.04637 0.111790.01984 0.06383 0.19915 15 0.05510 .02002 0 0.05152 0.06720 0.07308 0.09035 0.10690 0.13308 0.11523 0.12521 0.13793 0.23950 0.06323 0.07680 006100 0.02899 0.02755 0.20056 0.21991 0.21318 0.05532 .04781 0.01607 0.03779 0.01563 0.11181-0.19541 0.01634 0.01018 0.01880 0.01200 0.03275 0.00122 0.01496 0.00057 0.01733 Print Done al a Data Table ou (Click on the Icon located on the top-right comer of the data table below in order to copy its contents into a spreadsheet) Yearly returns from 1926-2014 for the S&P 500, small stocks, corporate bonds, world Treasury bills, and inflation (as measured by the CPI) Treasury S&P 500 Stocks Stocks Corp Bonds World CPI 1926 0.111380.07200 0.06285 0.22800 1927 0.37126 0.25754 0.06550 0.25326 0.03125 0.02163 1928 0.43308 0.46872 0.03377 0.33463 0.038240.01229 19290.089070.50467 0.04321-0.07692 1930-0.25257-0.45583 0.063430.22574 0.02347-0.06420 931-0.43858 0.502160.02380-0.39305 0.01023 0.09235 19320.08861 0.08696 0.12198 0.03030 0.00806 0.10465 1933 0.52895 1.87200 0.05255 0.66449 0.00293 0.00974 1934 -0.02341 0.25209 0.09728 0.02552 0.00155 0.01286 1935 0.47208 0.64739 0.06860 0.22782 0.00165 0.03175 936 0.32801 0.87508 0.06220 0.19283 0.00175 0.01231 1937-0.352580.53403 0.025460.16950 0.00319 0.03040 1938 0.33199 0.26275 0.04357 0.05614 0.000410.02950 939 -0.00910 0.00184 0.042470.01441 0.00008 0.00000 1940-0.10082-0.12340 0.04512 0.03528-0.00058 0.00912 941 -0.11767 -0.13728 0.01788 0.18744 0.00042 0.09940 1942 0.21076 0.52504 0.03119 0.01189 0.00262 0.09041 1943 0.25758 1.00000 0.03365 0.19895 0.00340 0.02764 1944 0.19694 0.60408 0.03101 -0.10240 0.00321 0.02445 1945 0.36461 0.82665 0.03512 0.11032 0.00321 0.02148 1946-0.08180 -0.12608 0.02558 -0.15124 1947 0.052400.02658 0.00450 0.03196 0.00461 0.08893 1948 0.05099 0.06609 0.03707 -0.05730 0.00979 0.02904 1949 0.18065 0.21502 0.04327 0.05421 0.01106 0.02116 1950 0.30579 0.45908 0.01891 0.254770.01213 0.05946 1951 0.24553 0.09767 0.00210 0.22446 0.01483 0.06122 1952 0.18501 0.06472 0.03427 0.15822 0.01642 0.00641 953-0.010990.05985 0.02061 0.04838 0.01780 0.00796 1954 0.52404 0.65232 0.04658 0.49823 0.00863 -0.00790 1955 0.31429 0.22110 0.01075 0.24739 0.01555 0.00478 1956 0.06627 0.034590.01792 0.06581 0.02422 0.02853 957-0.10853 0.15053 0.04469-0.06017 0.03129 0.02928 1958 0.43344 0.70923 0.00849 0.34456 0.01415 0.01796 1959 0.11904 0.18680 0.00157 0.23303 0.02815 0.01765 1960 0.00483-0.05004 0.06722 0.03492 0.02582 0.01301 1961 0.26811 0.30836 0.03681 0.20778 0.02159 0.00713 1962-0.08784 0.12950 0.062040.06212 0.02724 0.01275 1963 0.22691 0.18093 0.03167 0.15381 0.03151 0.01678 1964 0.16358 0.19405 0.03988 0.11247 0.03518 0.00963 1965 0.12356 0.03194 0.00352 0.18224 0OR6 0.36365 0.02082 0.09832 en P10-28 (similar to) , Question Help | * Given the spreadsheet, EE.containing the realized return of the S&P 500 from 1926-2014. Starting in 1929, divide the next 80 years (1929-2008) of the sample into four periods of 20 years each. For each 20-year period, calculate the final amount an investor would have earned given a $3,000 initial investment. Also express your answer as an annualized return. If risk were eliminated by holding stocks for 20 years, what would you expect to find? What can you conclude about long-run diversification? The amount after the 1929-1948 period is S and the return is %. Round the amount to the nearest cent and the return to four decimal places. Data Table 1964 0.16358 0.19405 0.03988 0.11247 .03518 0.00963 1965 0.12356 0.36365 0.02082 0.09832 0.03962 0.01907 1966 -0.10105 0.07302 -0.00255-0.10116 0.04705 0.03476 1967 0.23942 0.77916 -0.01162 0.21283 0.04147 0.03101 1968 0.11002 0.47611 022457 0.13941 0.05294 0.04637 1969 -0.08466 0.322190.02459-0.03858 0.06591 0.06228 1970 0.03986-0.04503 0.11179 -0.01984 971 0.14325 0.16347 0.09682 0.19567 0.04317 0.03312 1972 0.18936 0.04222 0.08323 0.23547 0.03891 0.03413 1973-0.14791-0.35936 0.02987 -0.14506 0.07059 0.08700 974-0.26539 0.27327 0.00233-0.24480 0.08078 0.12328 1975 0.37250 0.82769 0.11039 0.34493 0.05821 0.06962 1976 0.23675 0.57116 0.14557 0.14712 0.05156 0.04824 977-0.07388 0.19915 0.05510 0.02002 0.05152 0.06720 978 0.06440 0.20420 0.01833 0.18216 0.07308 0.09035 1979 0.18353 0.396980.01558 0.12671 010690 0.13308 1980 0.32266 0.29141-0.04976 0.27721 0.11523 0.12521 981 -0.05053 0.14617 0.08977-0.03305 0.14856 0.08912 1982 0.21483 0.32250 0.34898 0.11272 0.10664 0.03797 1983 0.22500 0.48048 0.07317 0.23280 0.08847 0.03833 984 0.06152 -0.02495 0.17103 0.05773 0.09956 0.03943 1985 0.31648 0.29125 0.29486 041770 0.076770.03793 1986 0.18603 0.05908 020913 0.42799 0.06057 0.01089 987 0.05171 -0.092040.01578 0.16764 0.05384 0.04423 1988 0.16608 0.20288 0.13793 0.23950 0.06323 004420 1989 0.31686 0.01488 0.15310 0.17194 0.08221 0.04656 990 -0.03104 0.36325 0.08606-0.16517 0.07680 0.06100 1991 0.30466 0.41799 015869 0.18966 0.05507 0.03081 1992 0.07619 0.22075 0.10642-0.04660 0.03401 0.02897 993 0.10079 0.13792 0.14662 0.23129 0.02899 0.02755 994 0.01320 0.01096-0.02435 0.05584 0.03880 0.02652 1995 0.37578 0.20056 021991 0.21318 0.05532 0.02555 1996 0.22960 0.21511 0.04239 0.13993 0.05145 0.03322 997 0.33363 0.32080 0.10847 0.16227 .05082 0.01688 998 0.28579 0.11975 0.10908 0.24795 0.04781 0.01607 1999 0.21042 -0.01260 -0.03037 0.25354 0.04561 0.02697 2000 -0.09104 -0.02490 0.11694 0.12928 0.05756 0.03384 2001 -0.11886 0.32781 0.11461-0.16521 003779 0.01563 2002 -0.22101 -0.05624 0.11181-0.19541 001634 0.02357 2003 0.28685 0.69151 0.09229 0.33761 0.01018 0.01880 2004 0.10882 0.31392 0.06510 0.15247 001200 0.03275 2005 0.04911 0.03988 0.077340.10023 002963 0.03417 2006 0.15795 0.26379 0.04167 0.20652 004786 0.02526 2007 0.05494 0.11100 0.04742 0.09566 0.04675 0.04086 2008 0.36998 -0.45864 0.13449-040334 001474 0.00101 2009 0.26464 .12127 0.00018 0.30793 0.00097 0.02709 2010 0.15064 0.33610 0.07972 0.12339 0.00122 0.01496 Print Done Data Table 1968 0.11002 047611 0.22457 0.13941 1969-0.08466 -0.32219-0.02459 0.03858 0.06591 0.06228 1970 0.03986 0.04503 1971 0.14325 0.16347 0.09682 0.19567 0.04317 0.03312 1972 0.18936 0.04222 0.08323 0.23547 0.03891 0.03413 1973 -0.14791 -0.35936 0.02987 -0.14506 0.07059 0.08700 1974-0.26539-0.27327 0.00233 -0.24480 0.08078 0.12328 1975 0.37250 0.82769 0.11039 0.34493 0.05821 0.06962 1976 0.23675 0.57116 0.14557 0.14712 0.05156 0.04824 977-0.07388 0.1 1978 0.06440 0.20420 0.01833 0.18216 1979 0.18353 0.39698 -0.01558 0.12671 1980 0.32266 0.29141-0.04976 0.27721 981-0.05053 0.14617 0.08977 -0.03305 0.14856 008912 1982 0.21483 0.32250 0.34898 0.11272 0.10664 0.03797 1983 0.22500 048048 0.07317 0.23280 0.08847 0.03833 1984 0.06152 -0.02495 0.17103 0.05773 0.09956 0.03943 1985 0.31648 0.29125 0.29486 0.41770 0.07677 0.03793 1986 0.18603 0.05908 0.20913 0.42799 0.06057 0.01089 1987 0.05171 -0.09204-0.01578 0.16764 0.05384 0.04423 1988 0.16608 1989 0.31686 0.01488 0.15310 0.17194 0.08221 0.04656 1990-0.031040.36325 0.08606 -0.1651 1991 0.30466 0.41799 0.15869 0.18966 0.05507 O.03081 1992 0.07619 0.22075 0.10642 -0.04660 0.03401 0.02897 1993 0.10079 0.13792 0.14662 0.23129 1994 0.01320 -0.01096-0.02435 0.05584 0.03880 0.02652 1995 0.37578 1996 0.22960 0.21511 0.04239 0.13993 0.05145 0.03322 1997 0.33363 0.32080 0.10847 0.16227 0.05082 0.01688 1998 0.285790.11975 0.10908 0.24795 1999 0.21042-0.012600.03037 0.25354 0.04561 0.02697 2000-0.09104 0.02490 0.11694 0.12928 0.05756 0.03384 2001 -0.11886 0.32781 0.11461-0.16521 2002-0.22101-0.05624 2003 0.28685 0.69151 0.09229 0.33761 2004 0.10882 0.31392 0.06510 0.15247 2005 0.04911 0.03988 0.07734 0.10023 0.02963 0.03417 2006 0.15795 0.263790.04167 0.20652 0.04786 0.02526 2007 0.05494 0.11100 0.04742 0.09566 0.04675 0.04086 2008 -0.36998-0.45864 0.13449-0.40334 0.01474 0.00101 2009 0.26464 12127 0.00018 0.30793 0.00097 O.02709 2010 0.15064 0.33610 0.07972 0.12339 2011 0.021120.07155 0.14703 -0.05017 0.00043 0.02967 2012 0.16003 0.21311 0.04513 0.16537 2013 0.32388 0.508140.03067 0.27365 0.00028 001518 2014 0.136880.04541 0.11658 0.05504 0.00016 0.00748 0.05294 0.04637 0.111790.01984 0.06383 0.19915 15 0.05510 .02002 0 0.05152 0.06720 0.07308 0.09035 0.10690 0.13308 0.11523 0.12521 0.13793 0.23950 0.06323 0.07680 006100 0.02899 0.02755 0.20056 0.21991 0.21318 0.05532 .04781 0.01607 0.03779 0.01563 0.11181-0.19541 0.01634 0.01018 0.01880 0.01200 0.03275 0.00122 0.01496 0.00057 0.01733 Print Done al a Data Table ou (Click on the Icon located on the top-right comer of the data table below in order to copy its contents into a spreadsheet) Yearly returns from 1926-2014 for the S&P 500, small stocks, corporate bonds, world Treasury bills, and inflation (as measured by the CPI) Treasury S&P 500 Stocks Stocks Corp Bonds World CPI 1926 0.111380.07200 0.06285 0.22800 1927 0.37126 0.25754 0.06550 0.25326 0.03125 0.02163 1928 0.43308 0.46872 0.03377 0.33463 0.038240.01229 19290.089070.50467 0.04321-0.07692 1930-0.25257-0.45583 0.063430.22574 0.02347-0.06420 931-0.43858 0.502160.02380-0.39305 0.01023 0.09235 19320.08861 0.08696 0.12198 0.03030 0.00806 0.10465 1933 0.52895 1.87200 0.05255 0.66449 0.00293 0.00974 1934 -0.02341 0.25209 0.09728 0.02552 0.00155 0.01286 1935 0.47208 0.64739 0.06860 0.22782 0.00165 0.03175 936 0.32801 0.87508 0.06220 0.19283 0.00175 0.01231 1937-0.352580.53403 0.025460.16950 0.00319 0.03040 1938 0.33199 0.26275 0.04357 0.05614 0.000410.02950 939 -0.00910 0.00184 0.042470.01441 0.00008 0.00000 1940-0.10082-0.12340 0.04512 0.03528-0.00058 0.00912 941 -0.11767 -0.13728 0.01788 0.18744 0.00042 0.09940 1942 0.21076 0.52504 0.03119 0.01189 0.00262 0.09041 1943 0.25758 1.00000 0.03365 0.19895 0.00340 0.02764 1944 0.19694 0.60408 0.03101 -0.10240 0.00321 0.02445 1945 0.36461 0.82665 0.03512 0.11032 0.00321 0.02148 1946-0.08180 -0.12608 0.02558 -0.15124 1947 0.052400.02658 0.00450 0.03196 0.00461 0.08893 1948 0.05099 0.06609 0.03707 -0.05730 0.00979 0.02904 1949 0.18065 0.21502 0.04327 0.05421 0.01106 0.02116 1950 0.30579 0.45908 0.01891 0.254770.01213 0.05946 1951 0.24553 0.09767 0.00210 0.22446 0.01483 0.06122 1952 0.18501 0.06472 0.03427 0.15822 0.01642 0.00641 953-0.010990.05985 0.02061 0.04838 0.01780 0.00796 1954 0.52404 0.65232 0.04658 0.49823 0.00863 -0.00790 1955 0.31429 0.22110 0.01075 0.24739 0.01555 0.00478 1956 0.06627 0.034590.01792 0.06581 0.02422 0.02853 957-0.10853 0.15053 0.04469-0.06017 0.03129 0.02928 1958 0.43344 0.70923 0.00849 0.34456 0.01415 0.01796 1959 0.11904 0.18680 0.00157 0.23303 0.02815 0.01765 1960 0.00483-0.05004 0.06722 0.03492 0.02582 0.01301 1961 0.26811 0.30836 0.03681 0.20778 0.02159 0.00713 1962-0.08784 0.12950 0.062040.06212 0.02724 0.01275 1963 0.22691 0.18093 0.03167 0.15381 0.03151 0.01678 1964 0.16358 0.19405 0.03988 0.11247 0.03518 0.00963 1965 0.12356 0.03194 0.00352 0.18224 0OR6 0.36365 0.02082 0.09832 en
Step by Step Solution
There are 3 Steps involved in it

Get step-by-step solutions from verified subject matter experts