

Question: P1-41. Computing Return on Equity and Return on Assets The following table contains financial statement information for Walmart Stores Inc. $ millions Total Assets Net
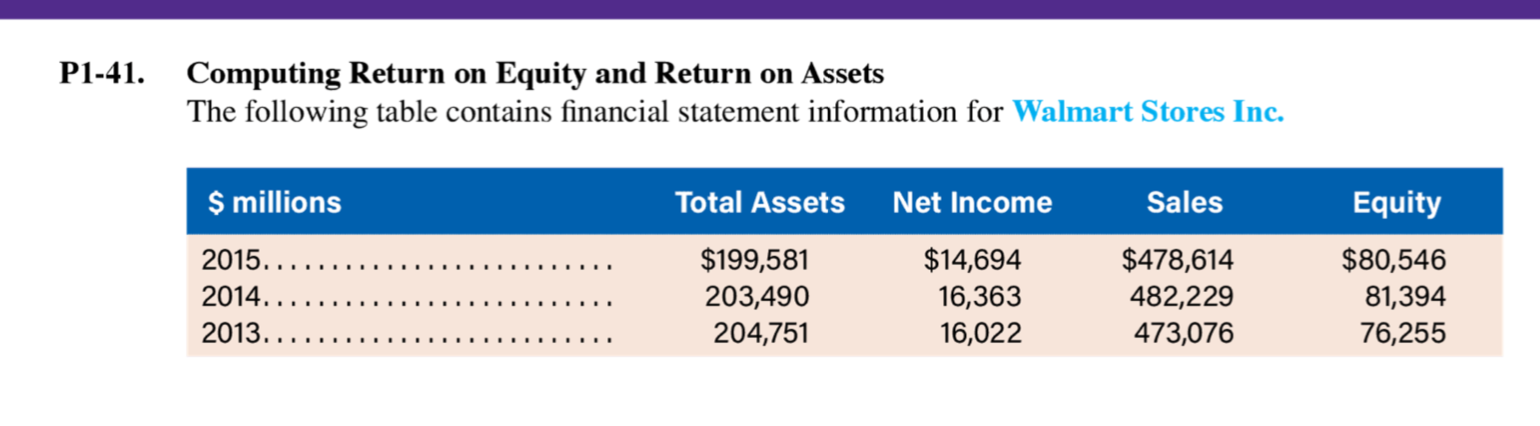
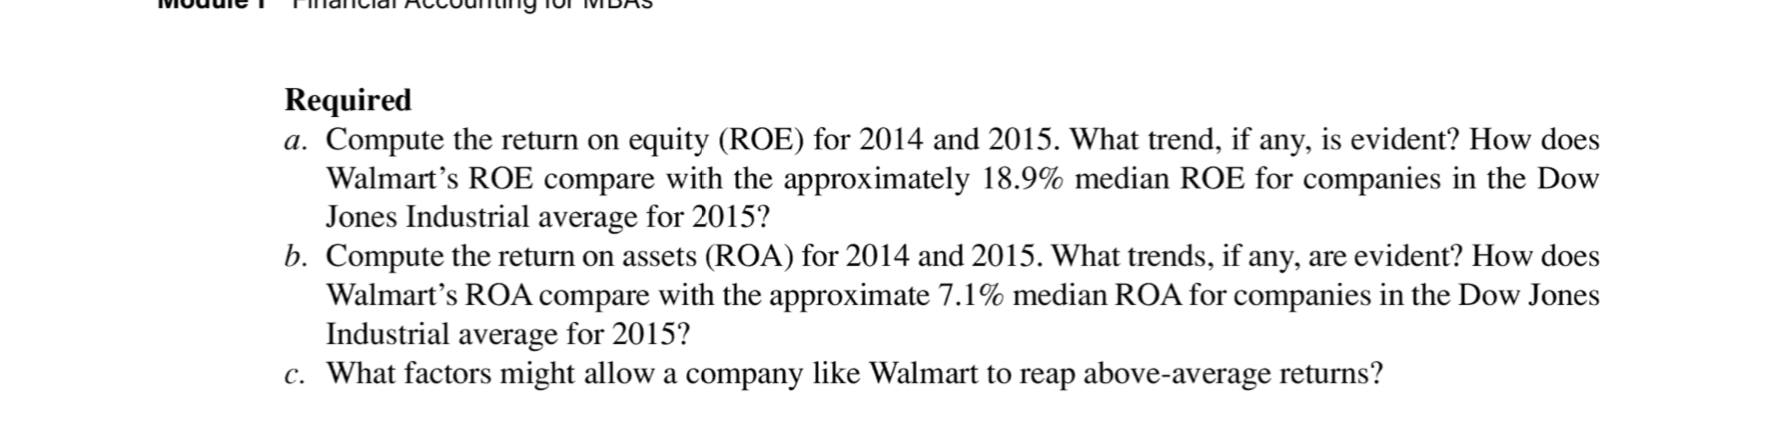
P1-41. Computing Return on Equity and Return on Assets The following table contains financial statement information for Walmart Stores Inc. $ millions Total Assets Net Income Sales Equity 2015..... 2014.... 2013.... $199,581 203,490 204,751 $14,694 16,363 16,022 $478,614 482,229 473,076 $80,546 81,394 76,255 L U I . . . . . . . . . . . . . . . . . . . . . . . . . IVIUUue lllal illal HULUUIIlIlI IUI IVIDAS Required a. Compute the return on equity (ROE) for 2014 and 2015. What trend, if any, is evident? How does Walmart's ROE compare with the approximately 18.9% median ROE for companies in the Dow Jones Industrial average for 2015? b. Compute the return on assets (ROA) for 2014 and 2015. What trends, if any, are evident? How does Walmart's ROA compare with the approximate 7.1% median ROA for companies in the Dow Jones Industrial average for 2015? c. What factors might allow a company like Walmart to reap above-average returns
Step by Step Solution
There are 3 Steps involved in it

Get step-by-step solutions from verified subject matter experts