

Question: P24-4B (L013) (Horizontal and Vertical Analysis) Presented below are comparative balance sheets for the JMar Company JMAR COMPANY COMPARATIVE BALANCE SHEET AS OF DECEMBER 31,
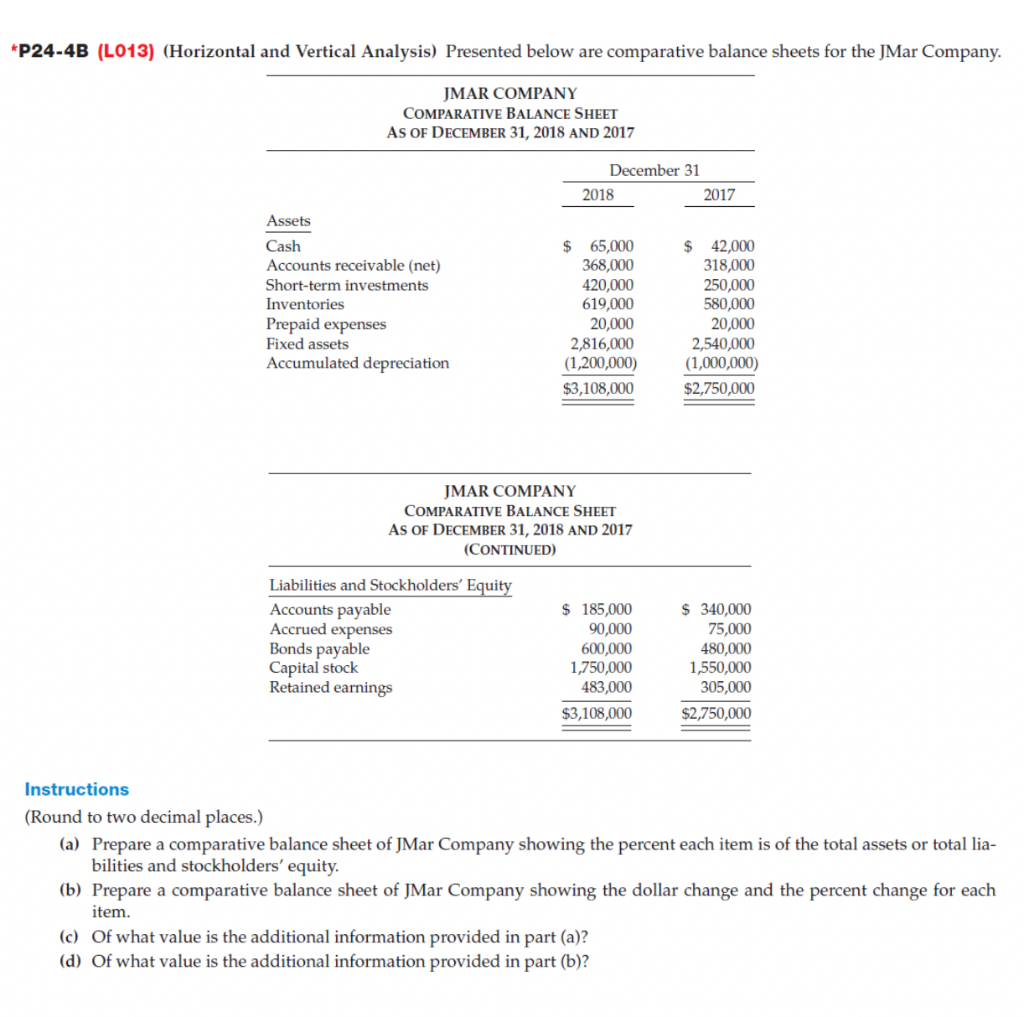
P24-4B (L013) (Horizontal and Vertical Analysis) Presented below are comparative balance sheets for the JMar Company JMAR COMPANY COMPARATIVE BALANCE SHEET AS OF DECEMBER 31, 2018 AND 2017 December 31 2018 2017 Assets $65,000 368,000 Cash $ 42,000 318,000 250,000 580,000 20,000 2,540,000 (1,000,000) Accounts receivable (net) Short-term investments 420,000 619,000 20,000 2,816,000 (1,200,000) Inventories Prepaid expenses Fixed assets Accumulated depreciation $3,108,000 $2,750,000 JMAR COMPANY COMPARATIVE BALANCE SHEET AS OF DECEMBER 31, 2018 AND 2017 (CONTINUED) Liabilities and Stockholders' Equity Accounts payable Accrued expenses Bonds payable Capital stock Retained earnings $340,000 75,000 $185,000 90,000 600,000 480,000 1,550,000 1,750,000 483,000 305,000 $3,108,000 $2,750,000 Instructions (Round to two decimal places.) (a) Prepare a comparative balance sheet of JMar Company showing the percent each item is of the total assets or total lia- bilities and stockholders' equity (b) Prepare a comparative balance sheet of JMar Company showing the dollar change and the percent change for each item. (c) Of what value is the additional information provided in part (a)? (d) Of what value is the additional information provided in part (b)
Step by Step Solution
There are 3 Steps involved in it

Get step-by-step solutions from verified subject matter experts