

Question: P26 From Chapter 2, do the following problems. Each problem should be a separate script file named: LastName_FirstName_Module3_Pxx, where xx is the problem number from
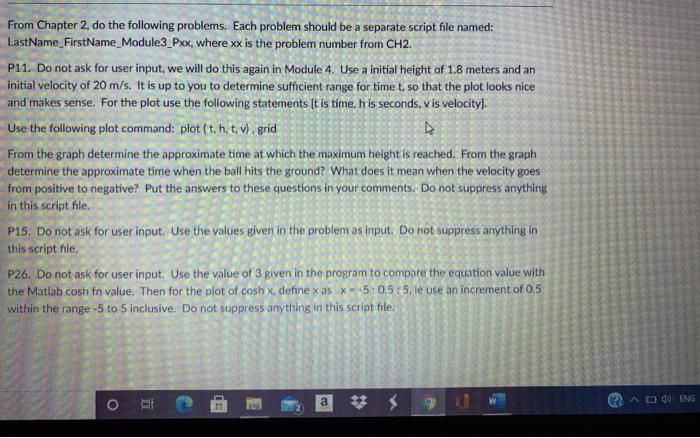
From Chapter 2, do the following problems. Each problem should be a separate script file named: LastName_FirstName_Module3_Pxx, where xx is the problem number from CH2. P11. Do not ask for user input, we will do this again in Module 4. Use a initial height of 1.8 meters and an initial velocity of 20 m/s. It is up to you to determine sufficient range for time t, so that the plot looks nice and makes sense. For the plot use the following statements (t is time, his seconds, vis velocityl. Use the following plot command: plot(t, h, t. v). grid From the graph determine the approximate time at which the maximum height is reached. From the graph determine the approximate time when the ball hits the ground? What does it mean when the velocity goes from positive to negative? Put the answers to these questions in your comments. Do not suppress anything in this script file. P15. Do not ask for user input. Use the values given in the problem as input. Do not suppress anything in this script file P26. Do not ask for user input. Use the value of 3 given in the program to compare the equation value with the Matlab cosh fn value. Then for the plot of cosh x. define x as 5:05:5, le use an increment of 0.5 within the range-5 to 5 inclusive. Do not suppress anything in this script file. a $ $ Q DENG From Chapter 2, do the following problems. Each problem should be a separate script file named: LastName_FirstName_Module3_Pxx, where xx is the problem number from CH2. P11. Do not ask for user input, we will do this again in Module 4. Use a initial height of 1.8 meters and an initial velocity of 20 m/s. It is up to you to determine sufficient range for time t, so that the plot looks nice and makes sense. For the plot use the following statements (t is time, his seconds, vis velocityl. Use the following plot command: plot(t, h, t. v). grid From the graph determine the approximate time at which the maximum height is reached. From the graph determine the approximate time when the ball hits the ground? What does it mean when the velocity goes from positive to negative? Put the answers to these questions in your comments. Do not suppress anything in this script file. P15. Do not ask for user input. Use the values given in the problem as input. Do not suppress anything in this script file P26. Do not ask for user input. Use the value of 3 given in the program to compare the equation value with the Matlab cosh fn value. Then for the plot of cosh x. define x as 5:05:5, le use an increment of 0.5 within the range-5 to 5 inclusive. Do not suppress anything in this script file. a $ $ Q DENG
Step by Step Solution
There are 3 Steps involved in it

Get step-by-step solutions from verified subject matter experts