

Question: p5u.instructure.com QZ. Raw Data This question set uses the TextbookCostsmtw dataset from the third edition of the Lock5 textbook. These data were collected from a
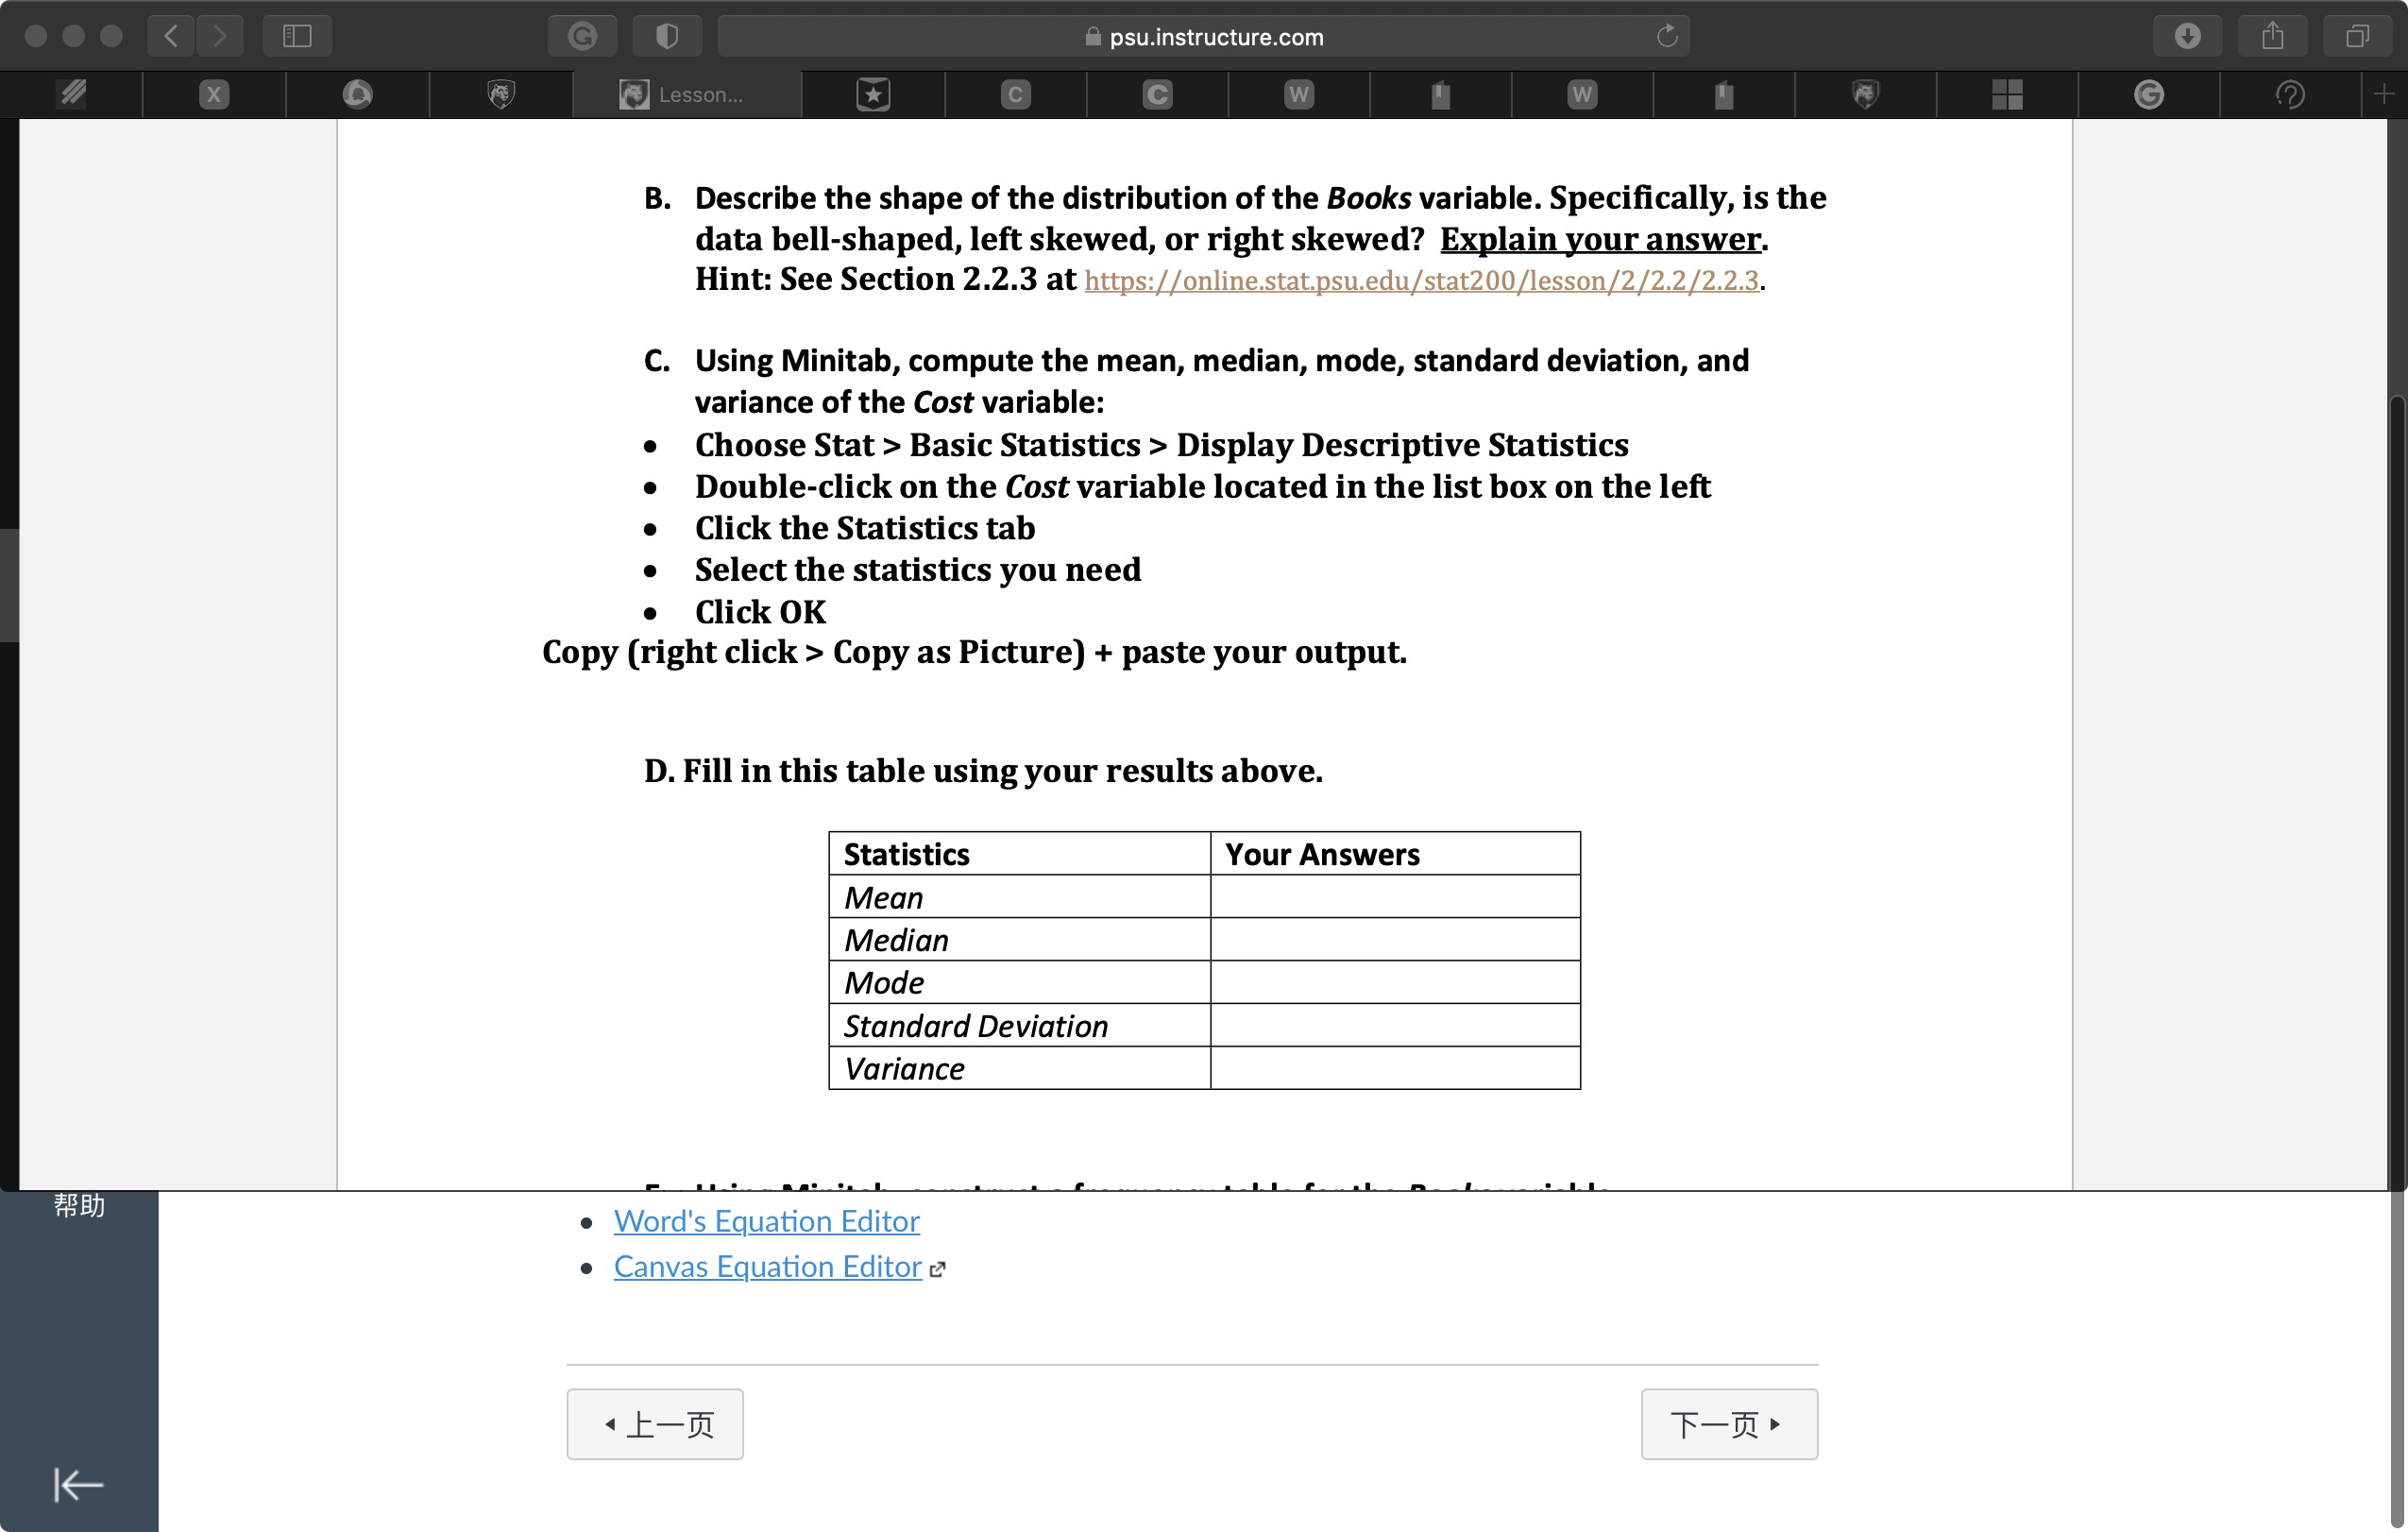
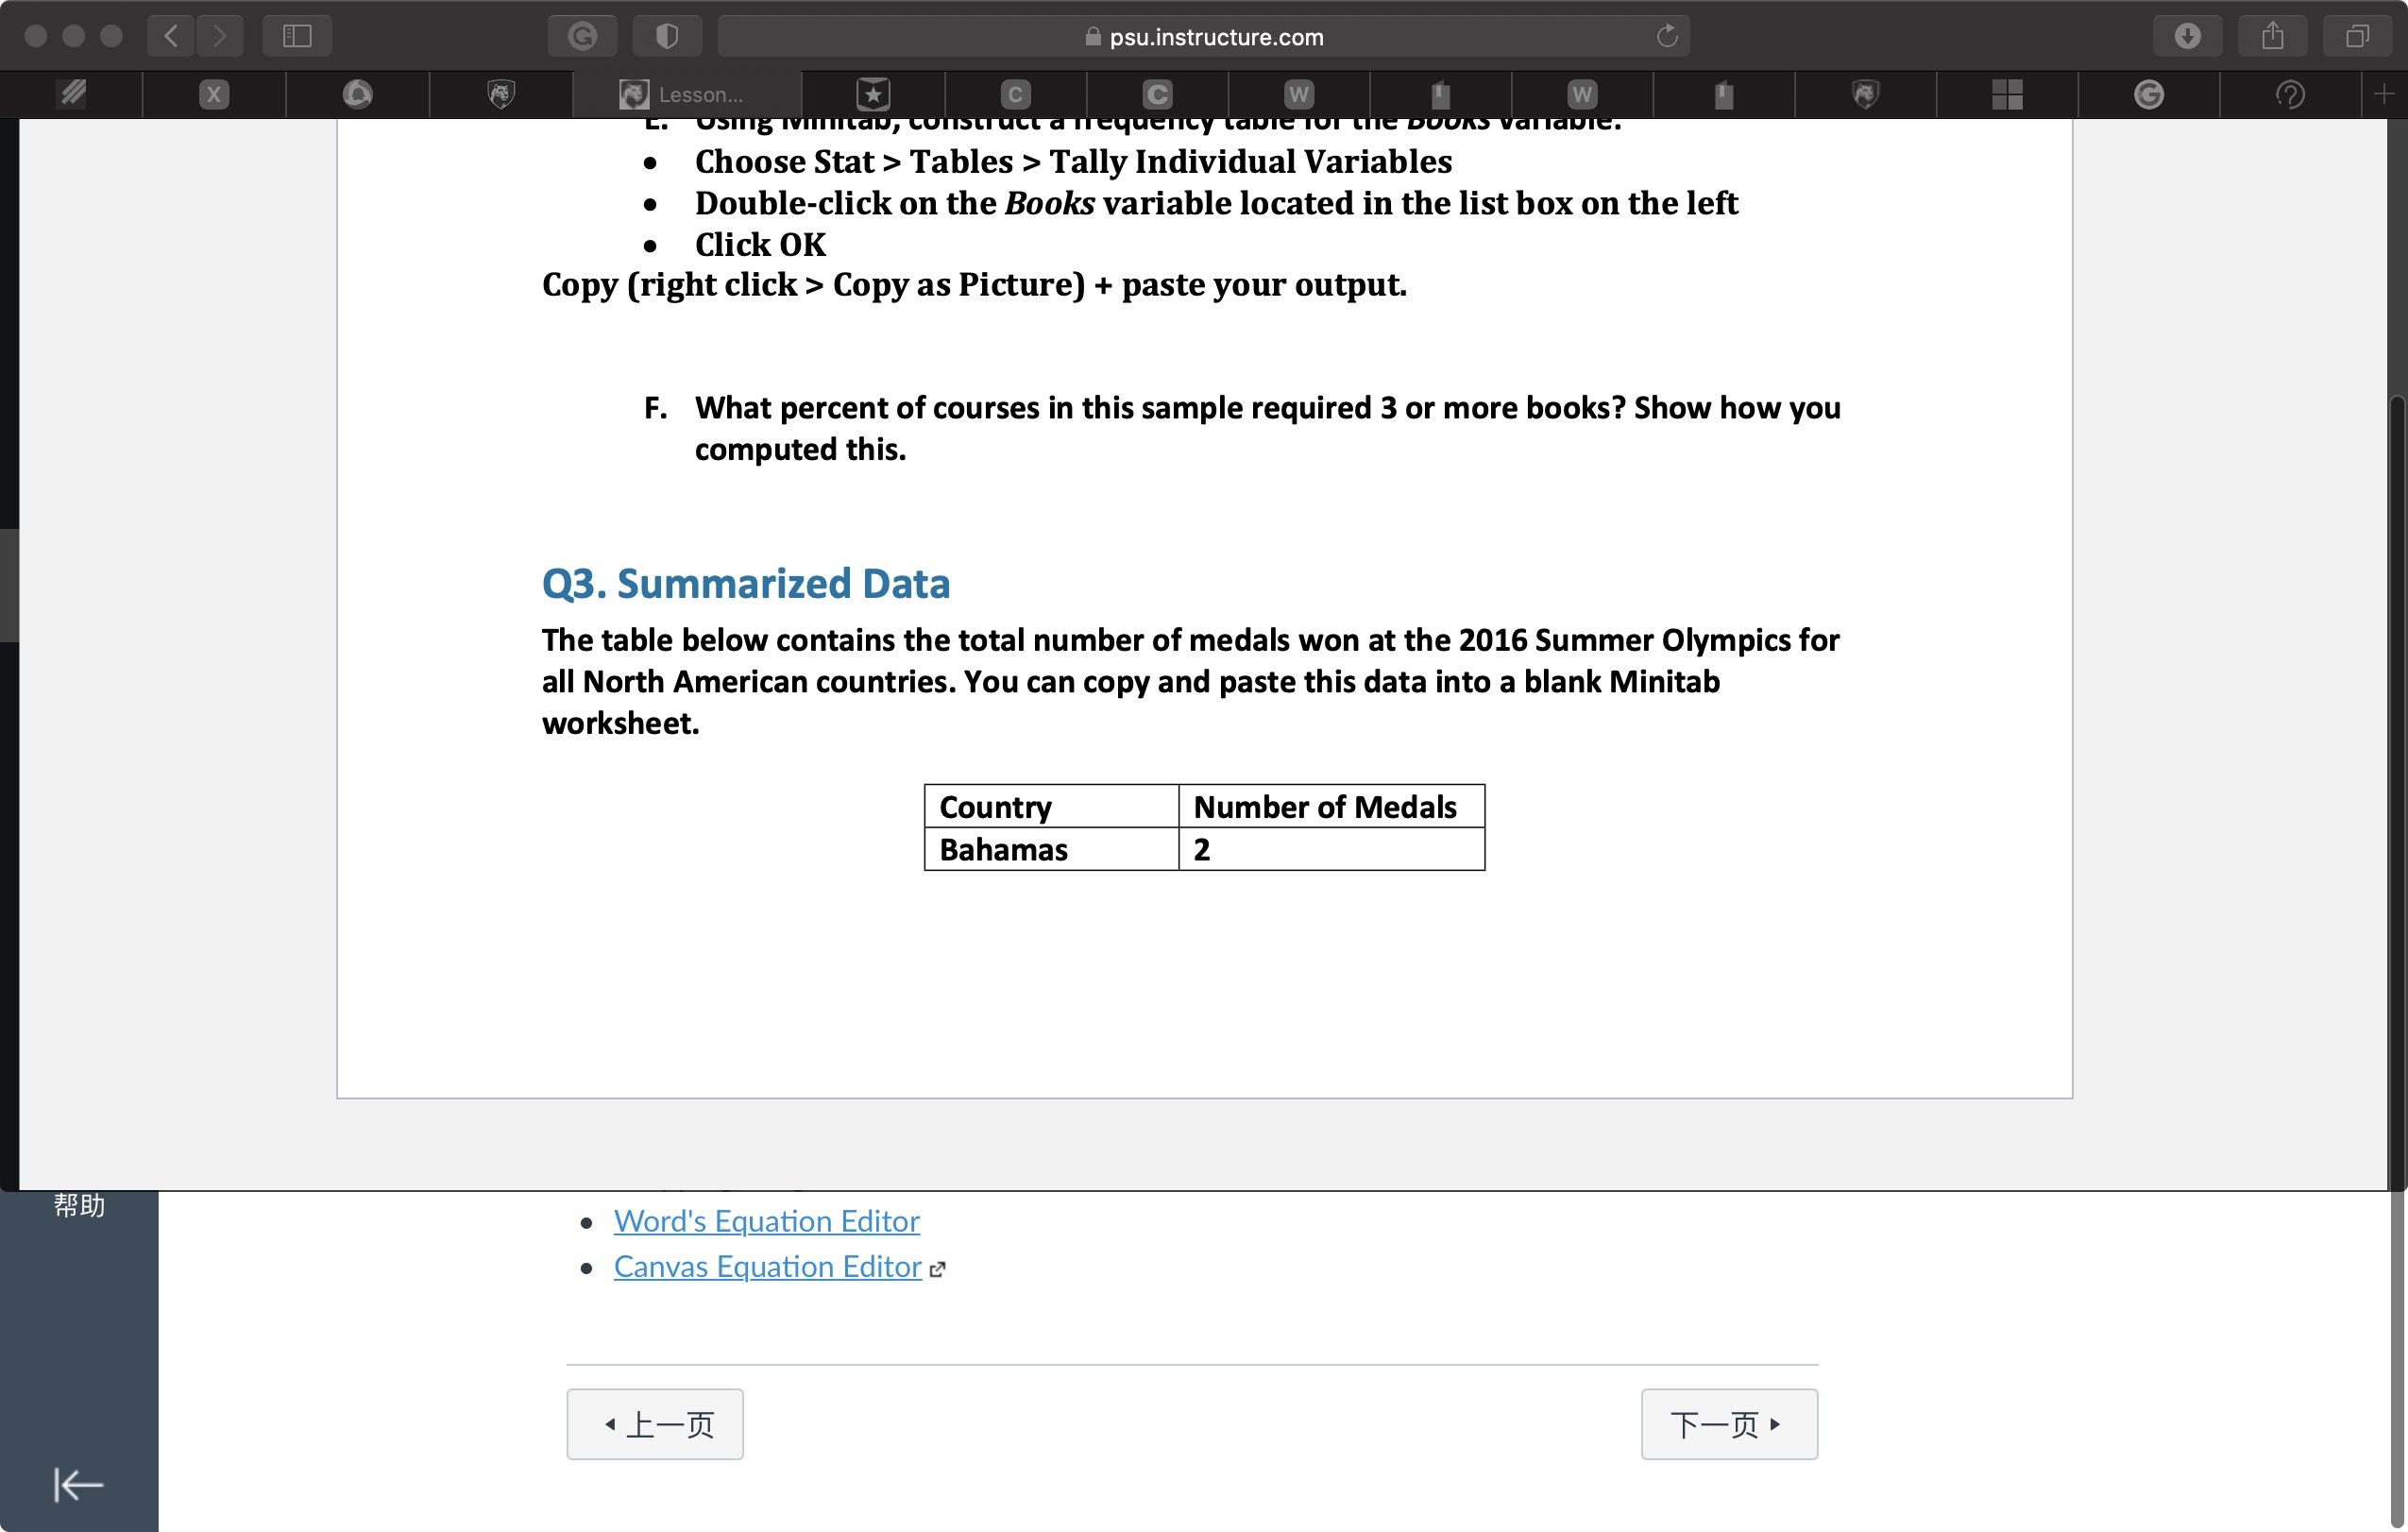
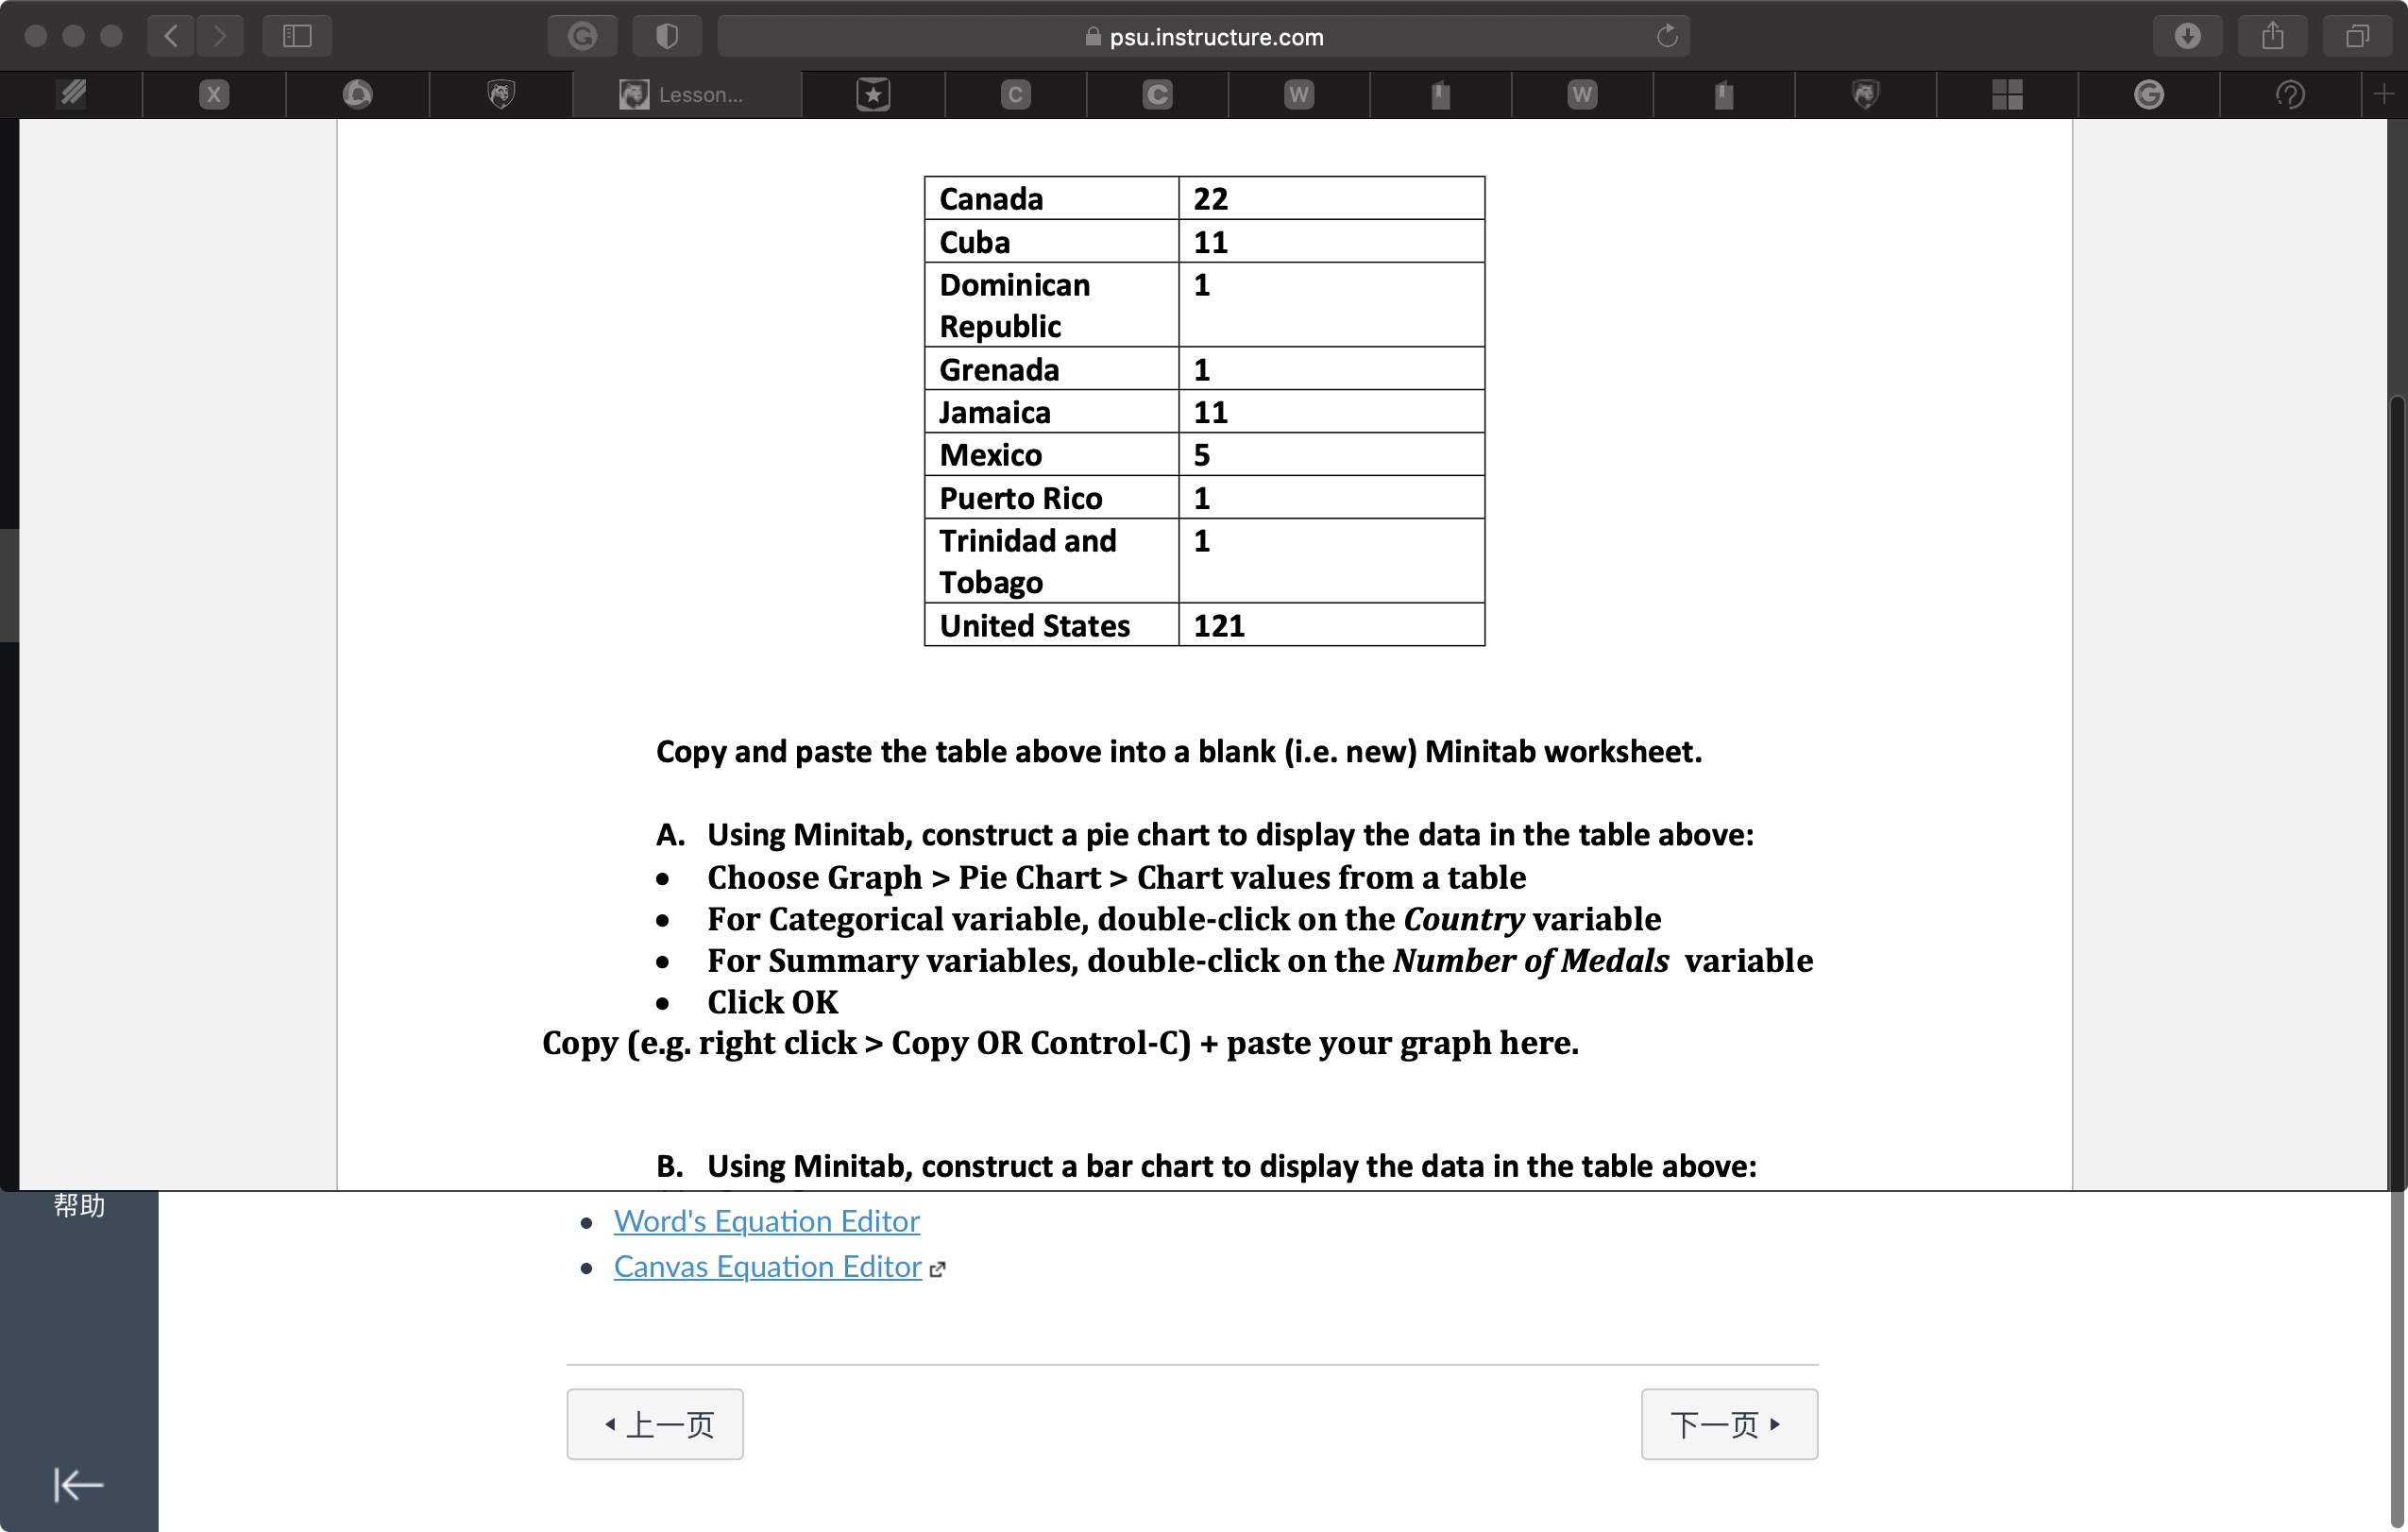
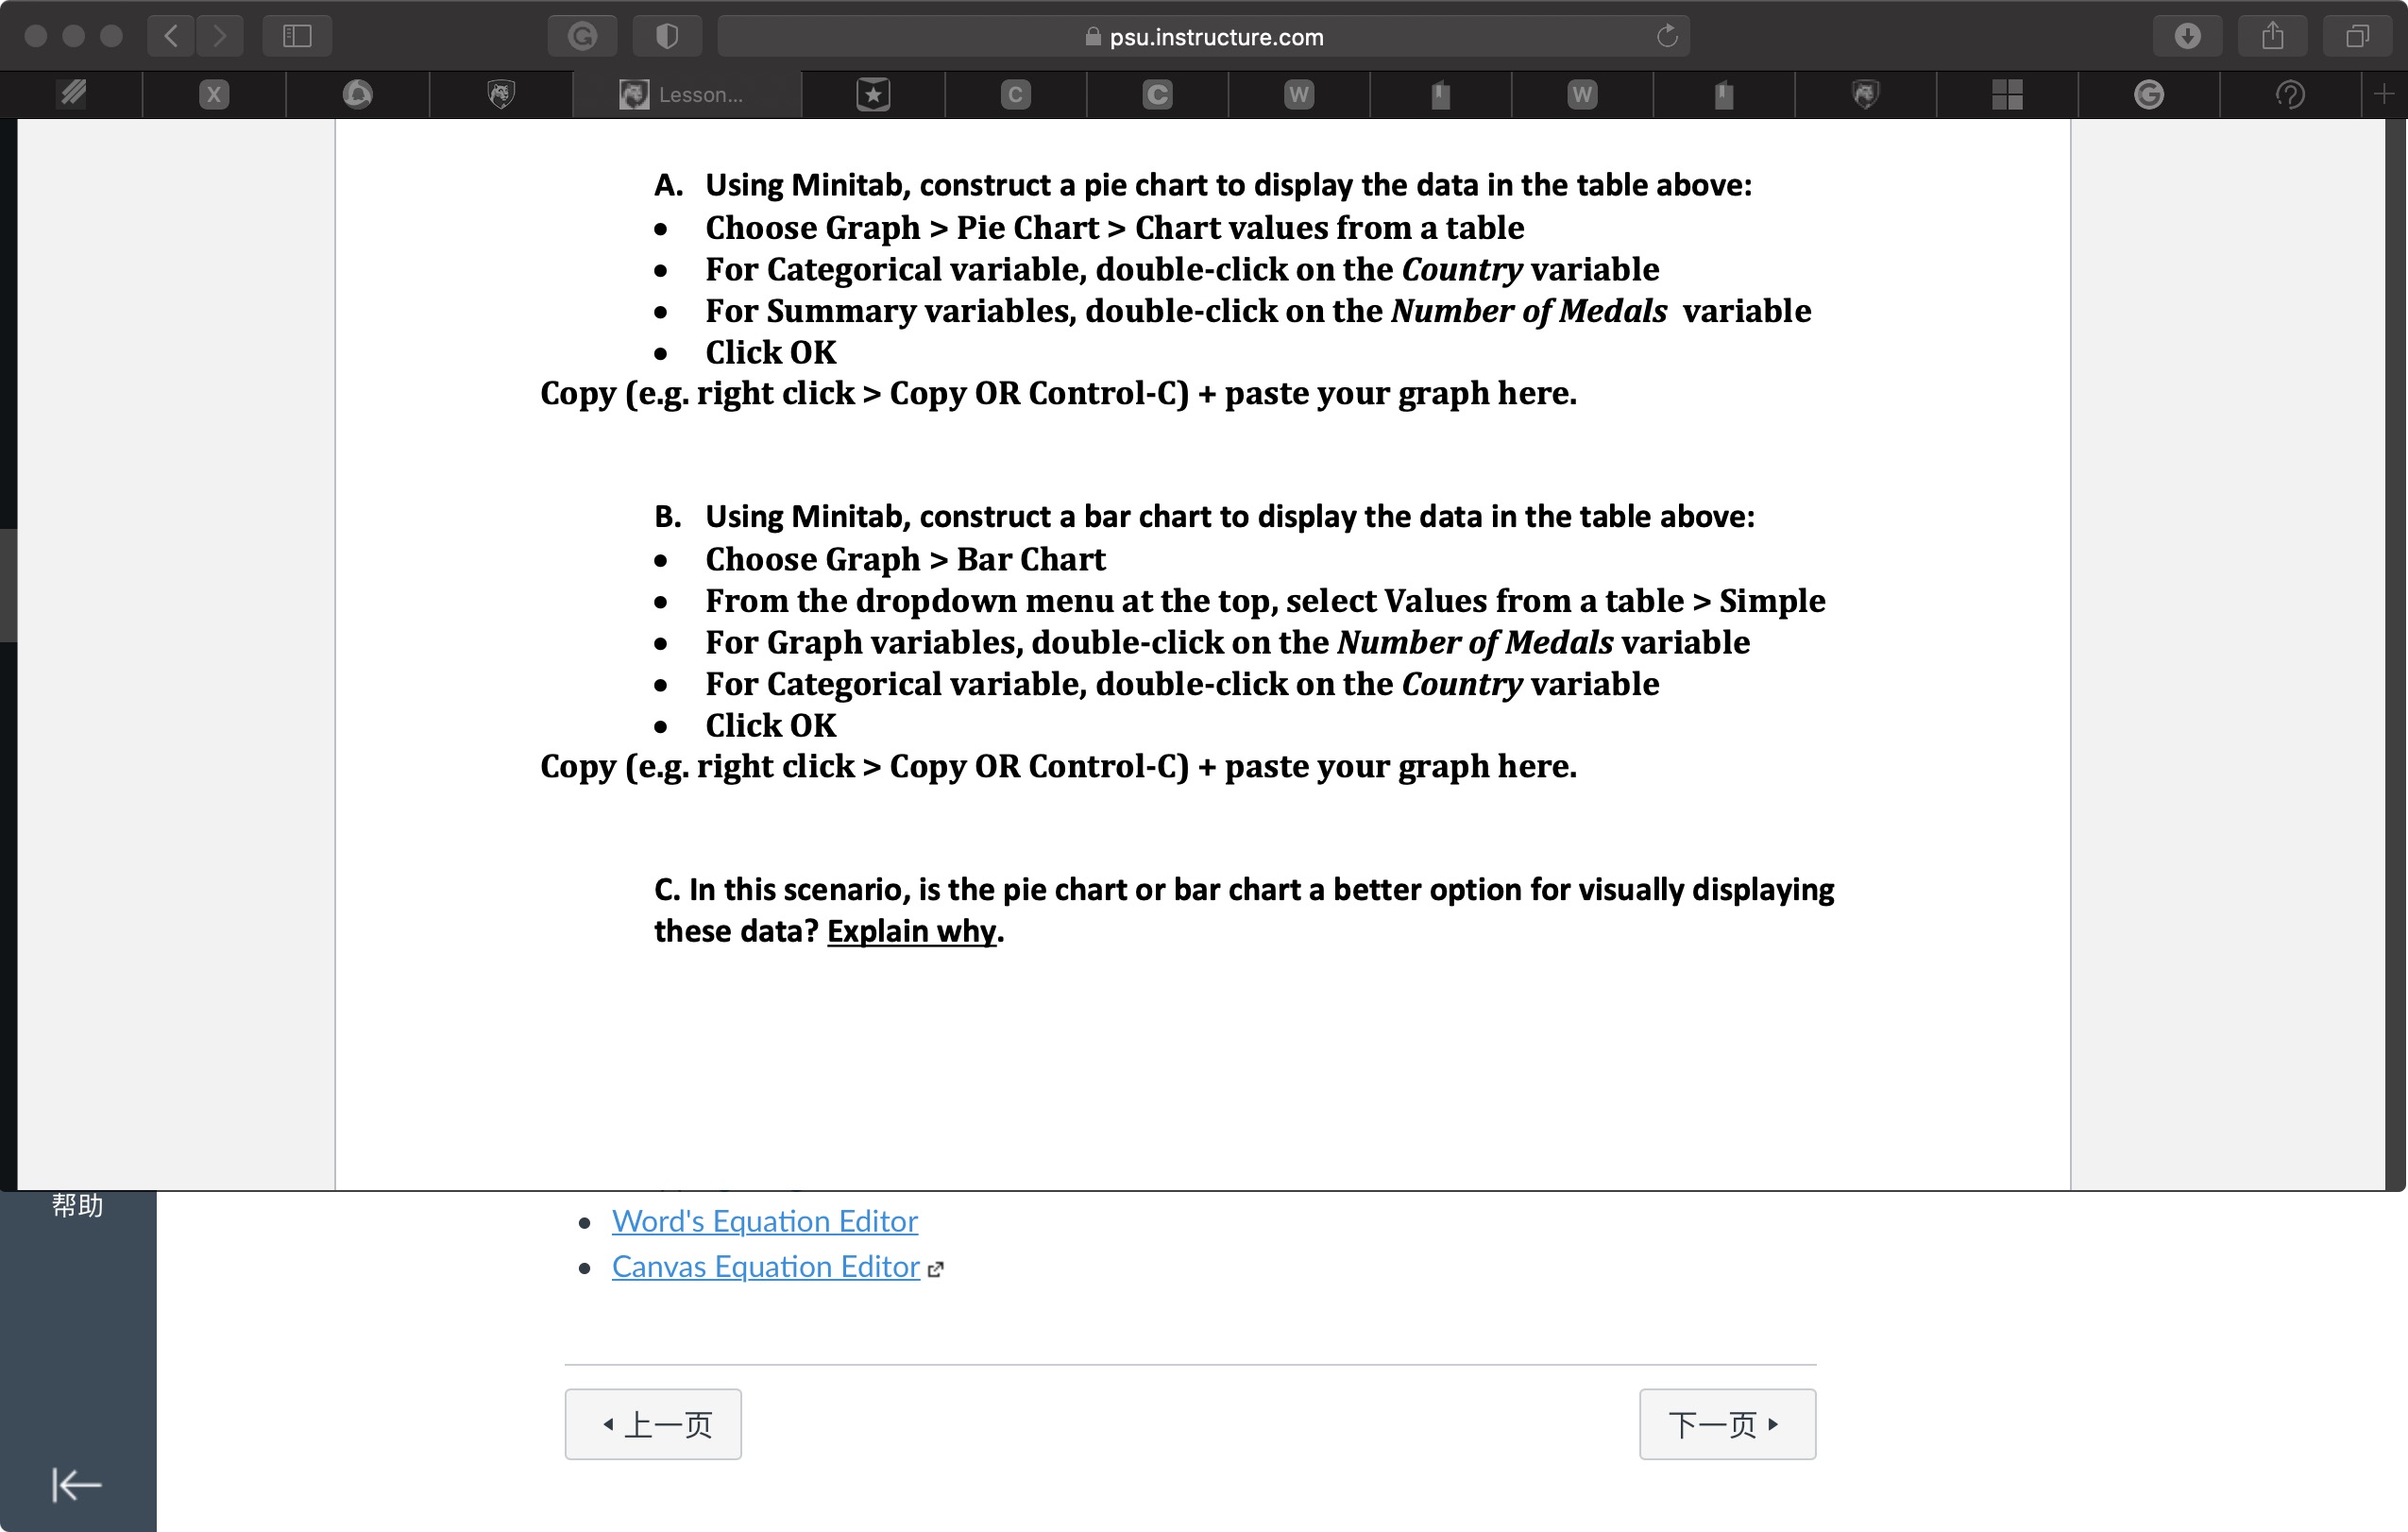
p5u.instructure.com QZ. Raw Data This question set uses the TextbookCostsmtw dataset from the third edition of the Lock5 textbook. These data were collected from a sample of 40 courses offered at one liberal arts college. The Field variable is the general discipline of the course. Books is the number of books required by the course. Cost is the total cost of the required books. Choose Graph > Histogram > Simple Double-click on the Books variable located in the list box on the left - Click OK Copy (e.g. right click > Copy OR Control-C) + paste your graph here. A. Using Minitab, construct a histogram of Books: I O ;tr. "ng o Word's Equation Editor 0 Canvas Equation Editor 2 p5u.instructure.com B. Describe the shape of the distribution of the Books variable. Specically. is the data bell-shaped. left skewed. or right skewed? Explain mgr answer. Hint: See Section 2.2.3 at htt s: online.stat. su.edu statZOU lesson 2 2.2 2.2.3. C. Using Minitab, compute the mean, median, mode, standard deviation, and variance of the Cost variable: 0 Choose Stat > Basic Statistics > Display Descriptive Statistics 0 Double-click on the Cost variable located in the list box on the left 0 Click the Statistics tab I Select the statistics you need 0 Click OK Copy (right click > Copy as Picture) + paste your output. D. Fill in this table using your results above. Statistics Your Answers Mean Median Mode Standard Deviation Variance o Word's Equation Editor 0 Canvas Equation Editor 2 5? ED p5u.instructure.com I Choose Stat > Tables > Tally Individual Variables - Double-click on the Books variable located in the list box on the left - Click OK Copy (right click > Copy as Picture) + paste your output. F. What percent of courses in this sample required 3 or more books? Show how you computed this. Q3. Summarized Data The table below contains the total number of medals won at the 2016 Summer Olympics for all North American countries. You can copy and paste this data into a blank Minitab worksheet. Country Number of Medals Bahamas 2 o Word's Equation Editor 0 Canvas Equation Editor 2 Pie Chart > Chart values from a table . For Categorical variable, double-click on the Country variable . For Summary variables, double-click on the Number of Medals variable Click OK Copy (e.g. right click > Copy OR Control-C) + paste your graph here. B. Using Minitab, construct a bar chart to display the data in the table above: . Word's Equation Editor . Canvas Equation Editor KA. o o o o p5u.instructure.com Using Minitab, construct a pie chart to display the data in the table above: Choose Graph > Pie Chart > Chart values from a table For Categorical variable, double-click on the Country variable For Summary variables, double-click on the Number of Medals variable Click OK Copy (e.g. right click > Copy 0R ControlC] + paste your graph here. Using Minitab, construct a bar chart to display the data in the table above: Choose Graph > Bar Chart From the dropdown menu at the top, select Values from a table > Simple For Graph variables, double-click on the Number of Medals variable For Categorical variable, double-click on the Country variable Click OK Copy (e.g. right click > Copy 0R Control-C) + paste your graph here. C. In this scenario, is the pie chart or bar chart a better option for visually displaying these data? Explaln why. W} E?) o Word's Equation Editor 0 Canvas Equation Editor :2 V
Step by Step Solution
There are 3 Steps involved in it

Get step-by-step solutions from verified subject matter experts