

Question: pa help po dito SUBJ: STATISTICS AND PROBABILITY Make Your Own Directions: Using the given set of values /parts of the test of hypothesis involving
pa help po dito
SUBJ: STATISTICS AND PROBABILITY
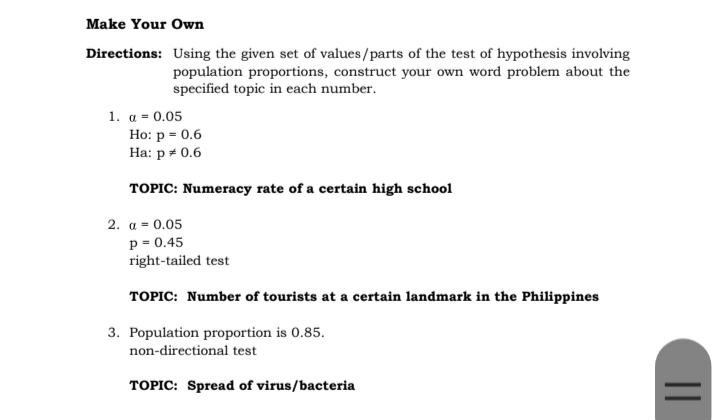
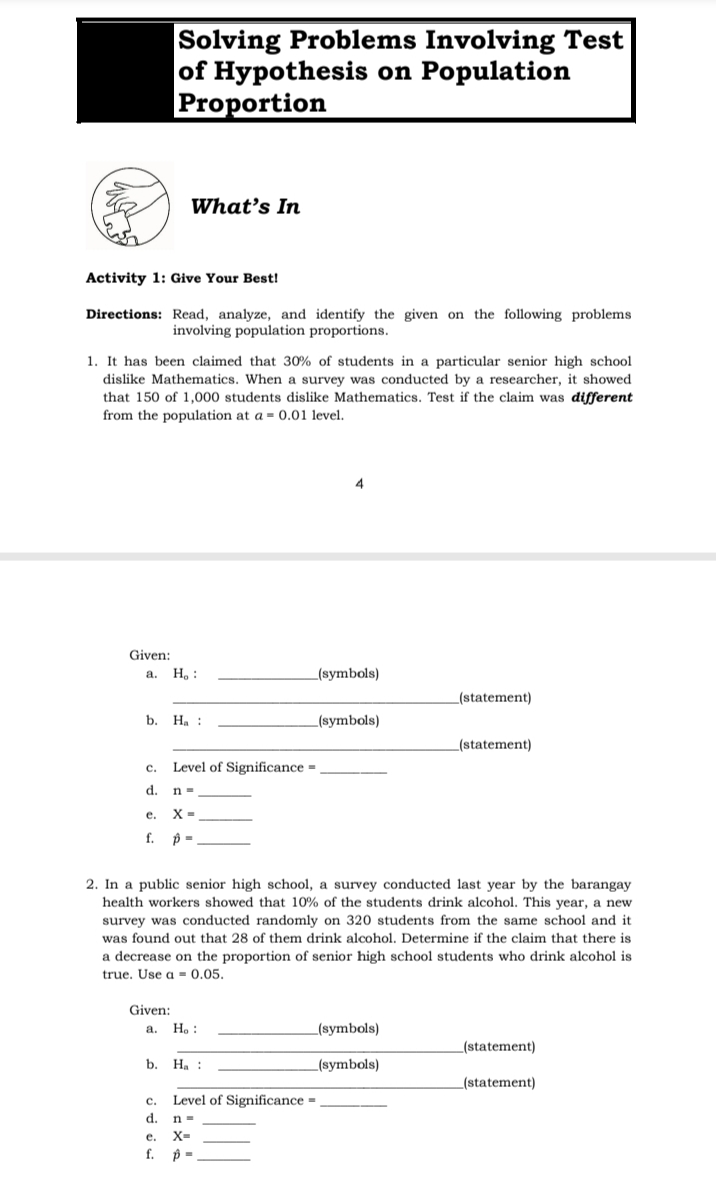
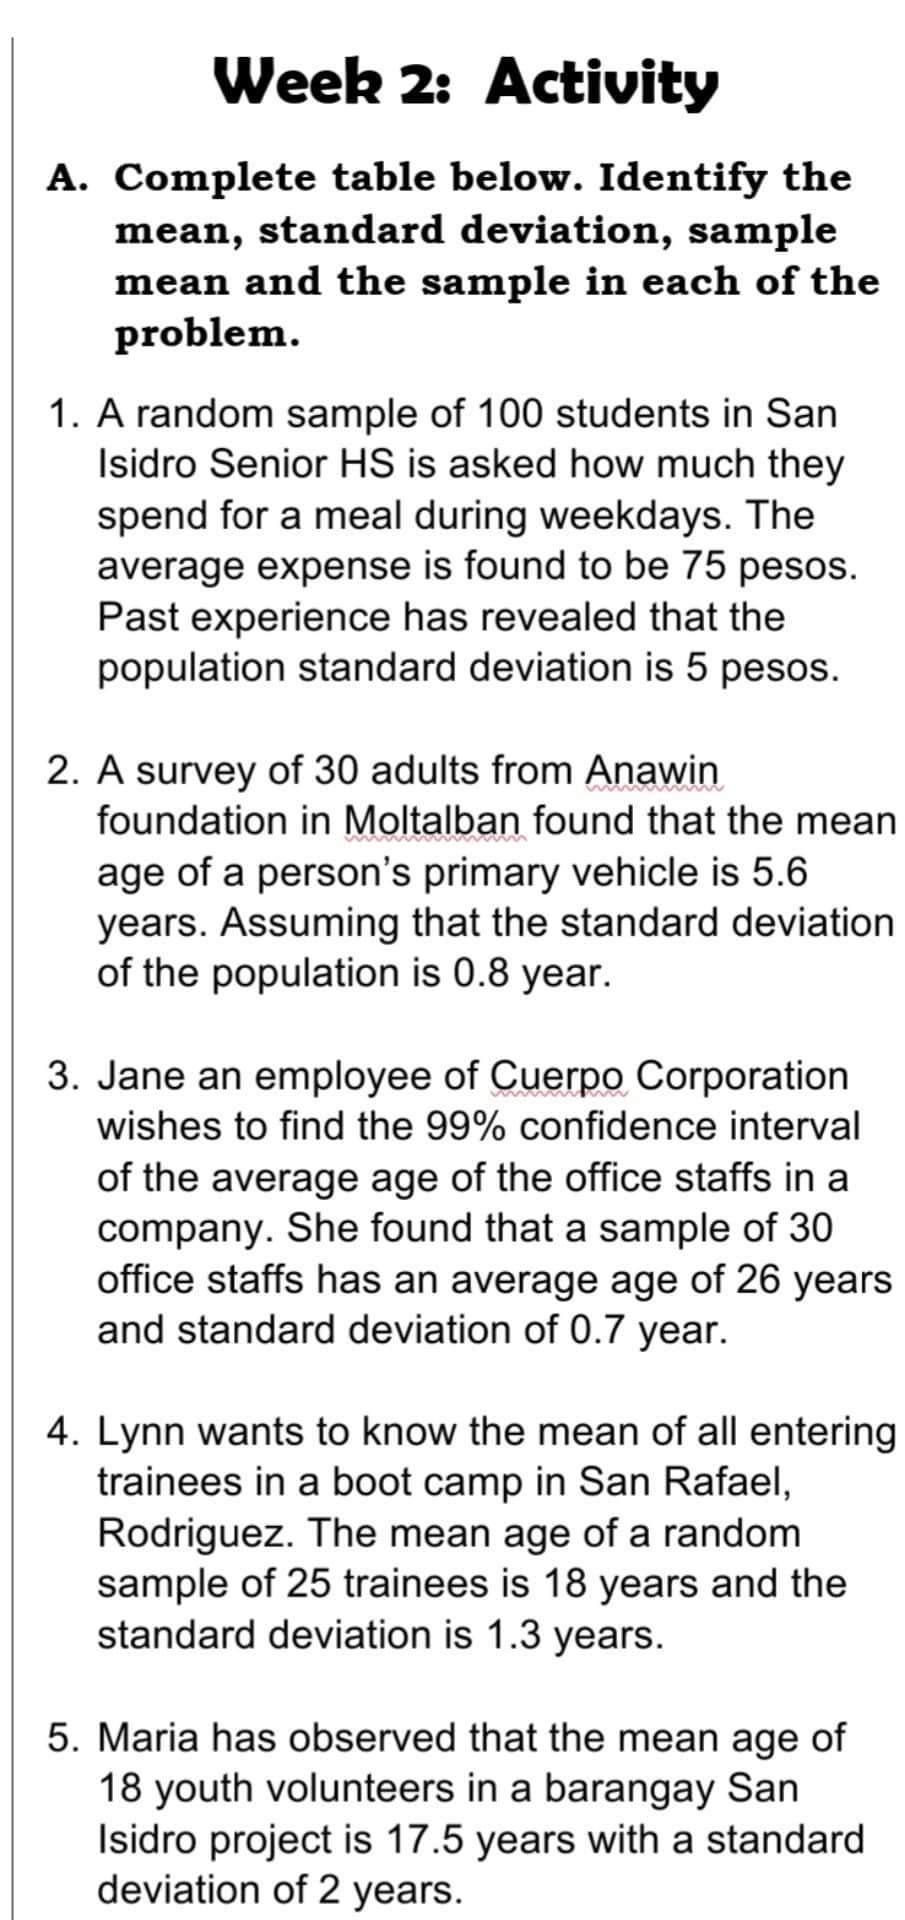
Make Your Own Directions: Using the given set of values /parts of the test of hypothesis involving population proportions, construct your own word problem about the specified topic in each number. 1. a = 0.05 Ho: p = 0.6 Ha: p = 0.6 TOPIC: Numeracy rate of a certain high school 2. a = 0.05 p = 0.45 right-tailed test TOPIC: Number of tourists at a certain landmark in the Philippines 3. Population proportion is 0.85. non-directional test TOPIC: Spread of virus/bacteria =Solving Problems Involving Test of Hypothesis on Population Proportion What's In Activity 1: Give Your Best! Directions: Read, analyze, and identify the given on the following problems involving population proportions. 1. It has been claimed that 30% of students in a particular senior high school dislike Mathematics. When a survey was conducted by a researcher, it showed that 150 of 1,000 students dislike Mathematics. Test if the claim was different from the population at a = 0.01 level. Given: a. H. : (symbols) (statement) b. Ha : (symbols) (statement) c. Level of Significance = d. n = e. X - p = 2. In a public senior high school, a survey conducted last year by the barangay health workers showed that 10% of the students drink alcohol. This year, a new survey was conducted randomly on 320 students from the same school and it was found out that 28 of them drink alcohol. Determine if the claim that there is a decrease on the proportion of senior high school students who drink alcohol is true. Use a = 0.05. Given: a. Ho : (symbols) (statement) b. Ha : (symbols) (statement) C. Level of Significance = d. n = e. f. p =Week 2: Activity A. Complete table below. Identify the mean, standard deviation, sample mean and the sample in each of the problem. 1. A random sample of 100 students in San Isidro Senior H8 is asked how much they spend for a meal during weekdays. The average expense is found to be 75 pesos. Past experience has revealed that the population standard deviation is 5 pesos. 2. A survey of 30 adults from Win foundation in MQIMQQQ... found that the mean age of a person 5 primary vehicle IS 5.6 years. Assuming that the standard deviation of the population is 0.8 year. 3. Jane an employee of Querpg Corporation wishes to nd the 99% condence interval of the average age of the ofce staffs in a company. She found that a sample of 30 ofce staffs has an average age of 26 years and standard deviation of 0.7 year. 4. Lynn wants to know the mean of all entering trainees in a boot camp in San Rafael, Rodriguez. The mean age of a random sample of 25 trainees is 18 years and the standard deviation is 1.3 years. 5. Maria has observed that the mean age of 18 youth volunteers in a barangay San Isidro project is 17.5 years with a standard deviation of 2 years
Step by Step Solution
There are 3 Steps involved in it

Get step-by-step solutions from verified subject matter experts