

Question: PAC 3.2 Complete the chart. Objective Initial Question Sub-questions Possible Measures Descriptive Analysis:Understand labor information for 2018 - 2019. What happened to labor hours during
PAC 3.2
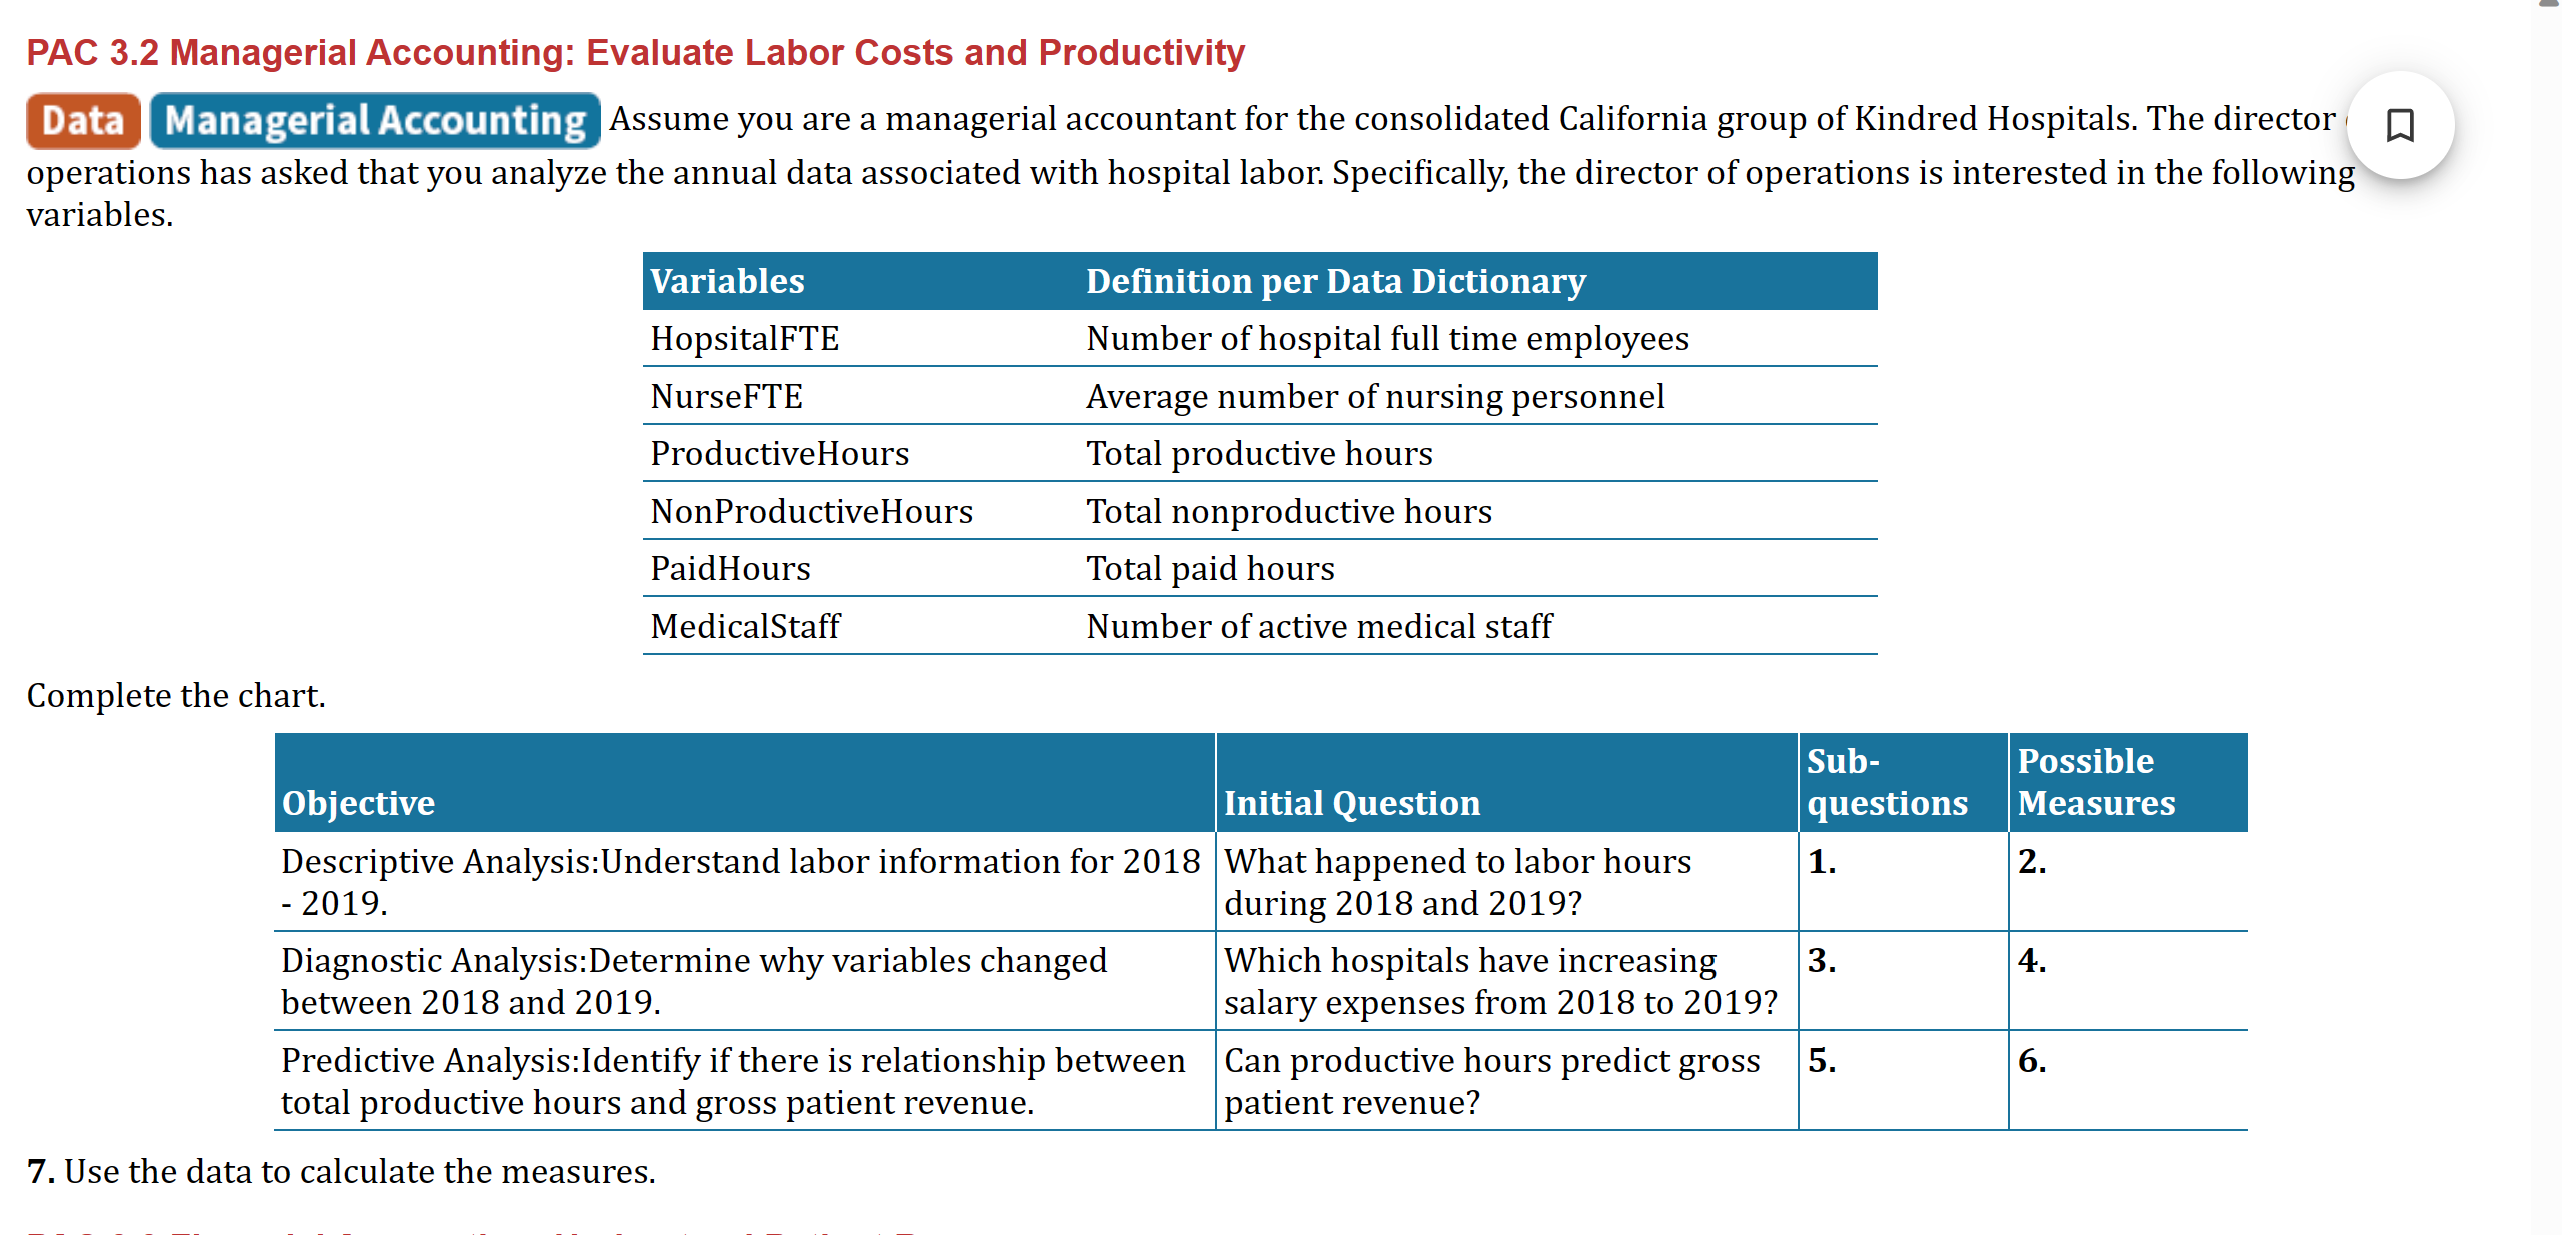
Complete the chart.
Objective Initial Question Sub-questions Possible Measures
Descriptive Analysis:Understand labor information for 2018 - 2019. What happened to labor hours during 2018 and 2019? 1. 2.
Diagnostic Analysis:Determine why variables changed between 2018 and 2019. Which hospitals have increasing salary expenses from 2018 to 2019? 3. 4.
Predictive Analysis:Identify if there is relationship between total productive hours and gross patient revenue. Can productive hours predict gross patient revenue? 5. 6.
7. Use the data to calculate the measures.
Kindred Healthcare is a post-acute healthcare service company that operates long-term acute care and rehabilitation services across the United States. Kindreds hospitals offer the same in-depth care that a patient would receive at a traditional hospital, but for an extended recovery period. The data used in this case is based on actual data from the California Health and Human Services Open Data Portal.
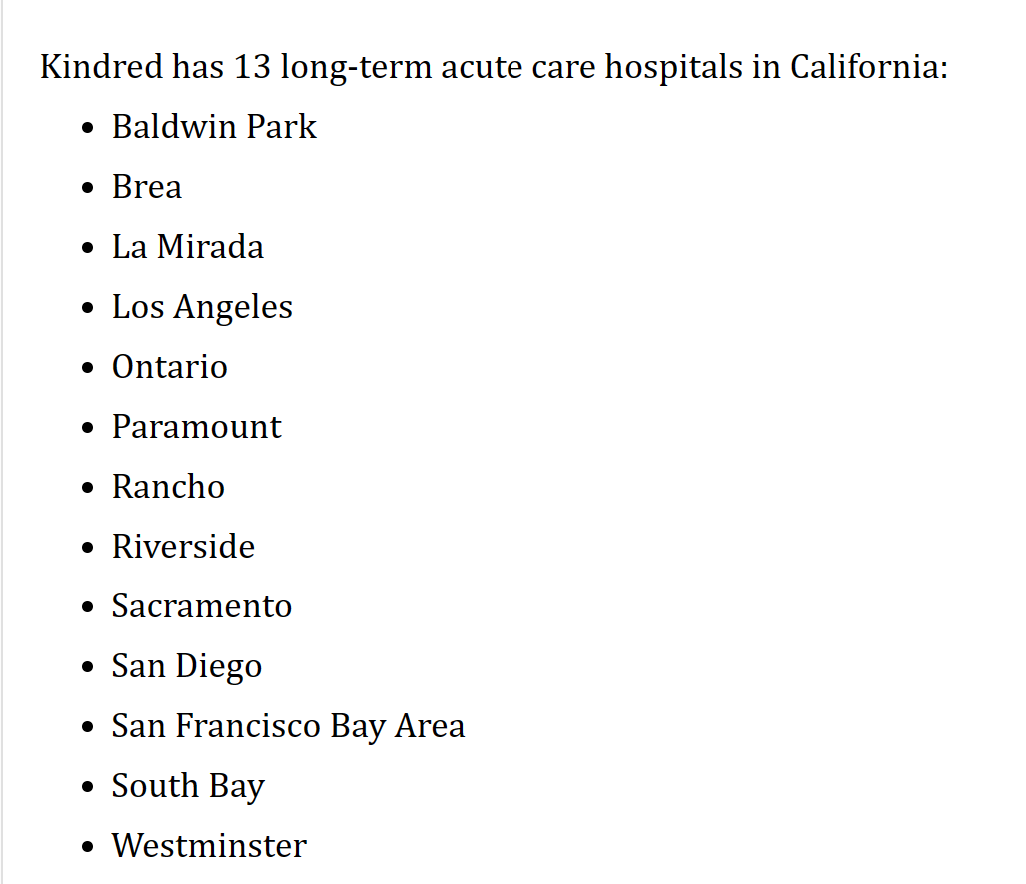
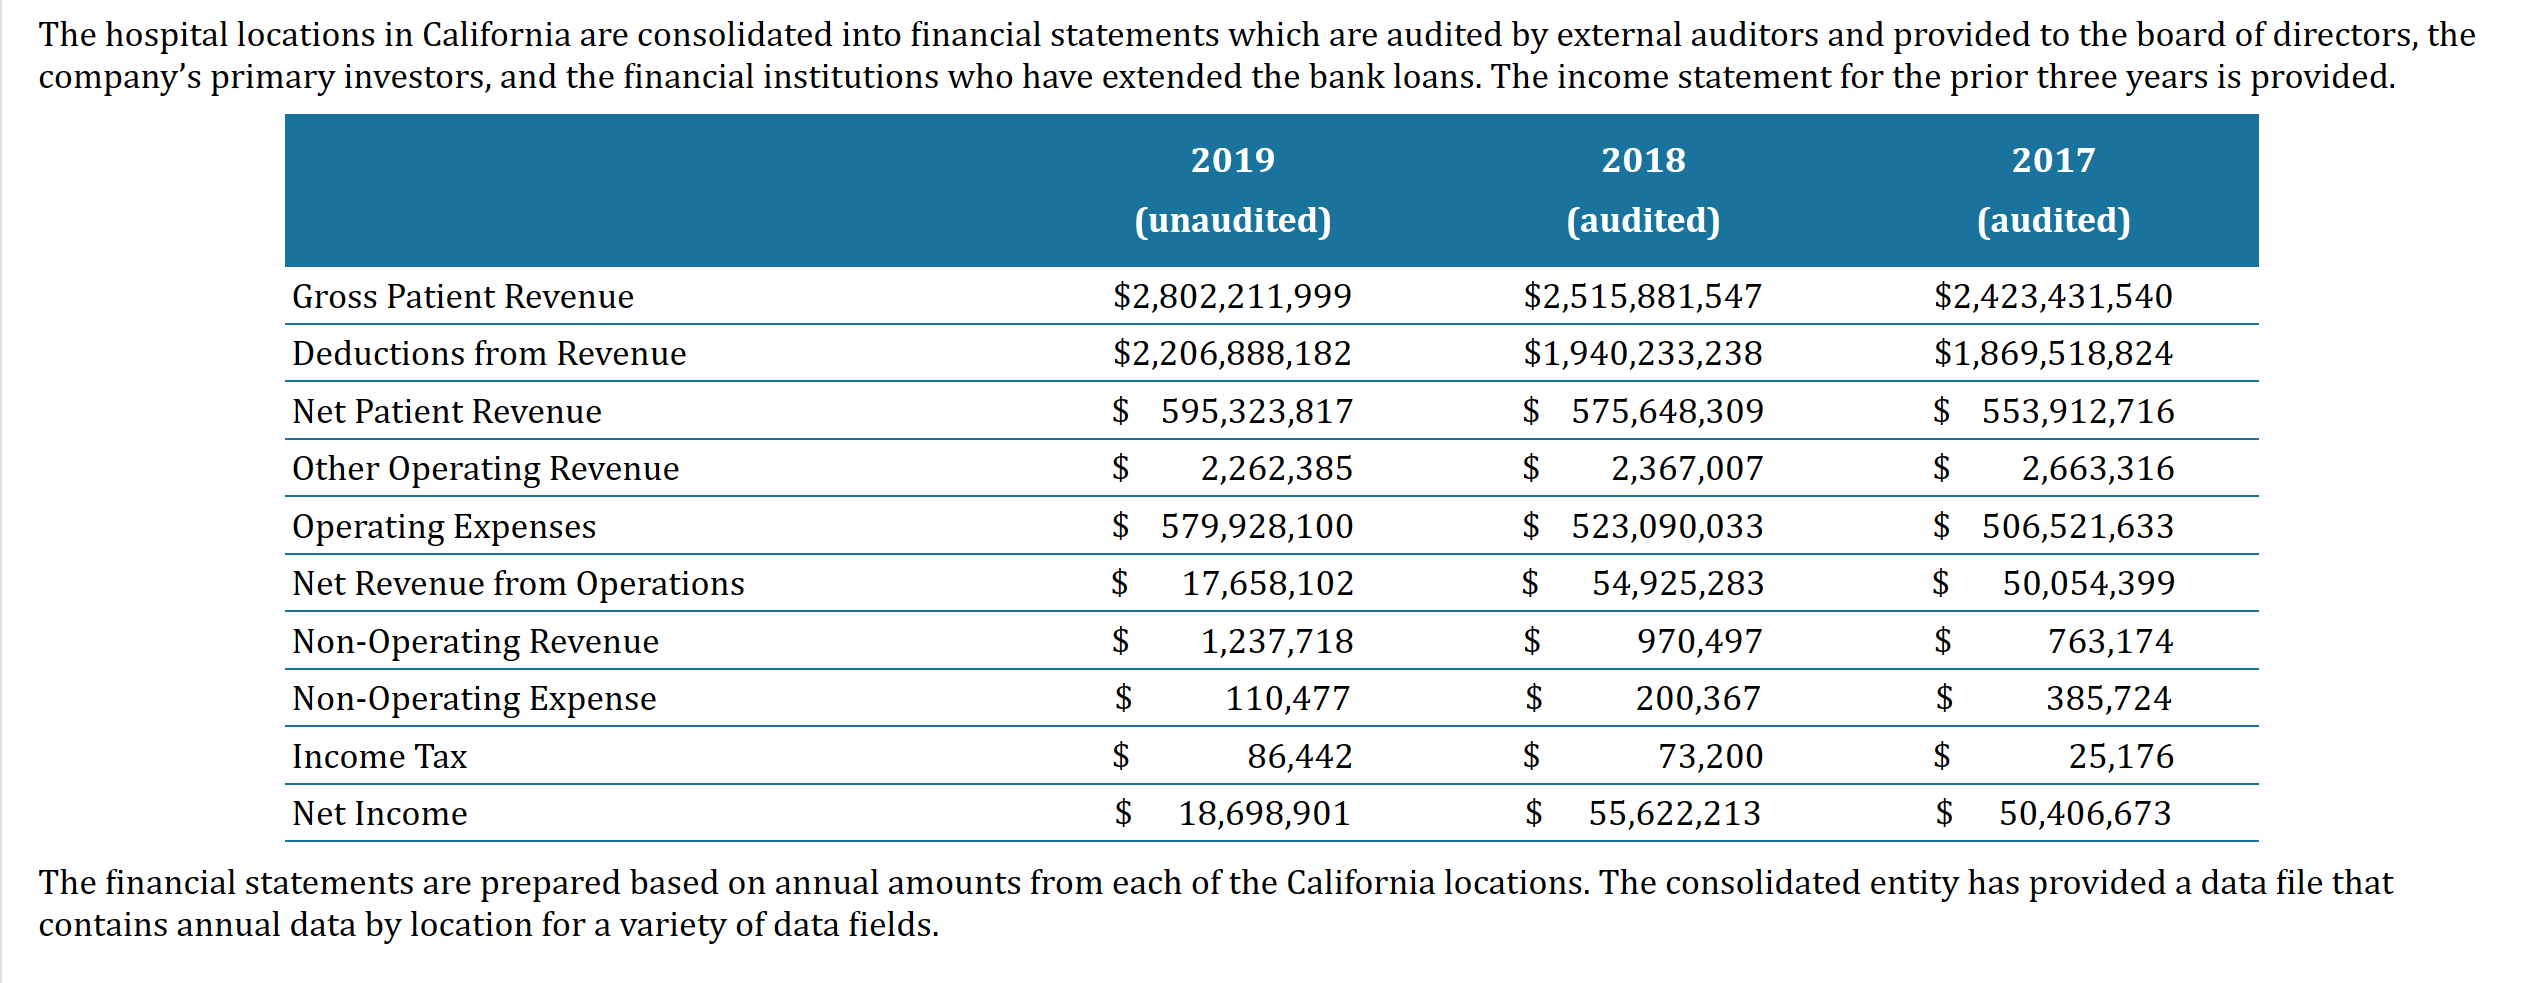
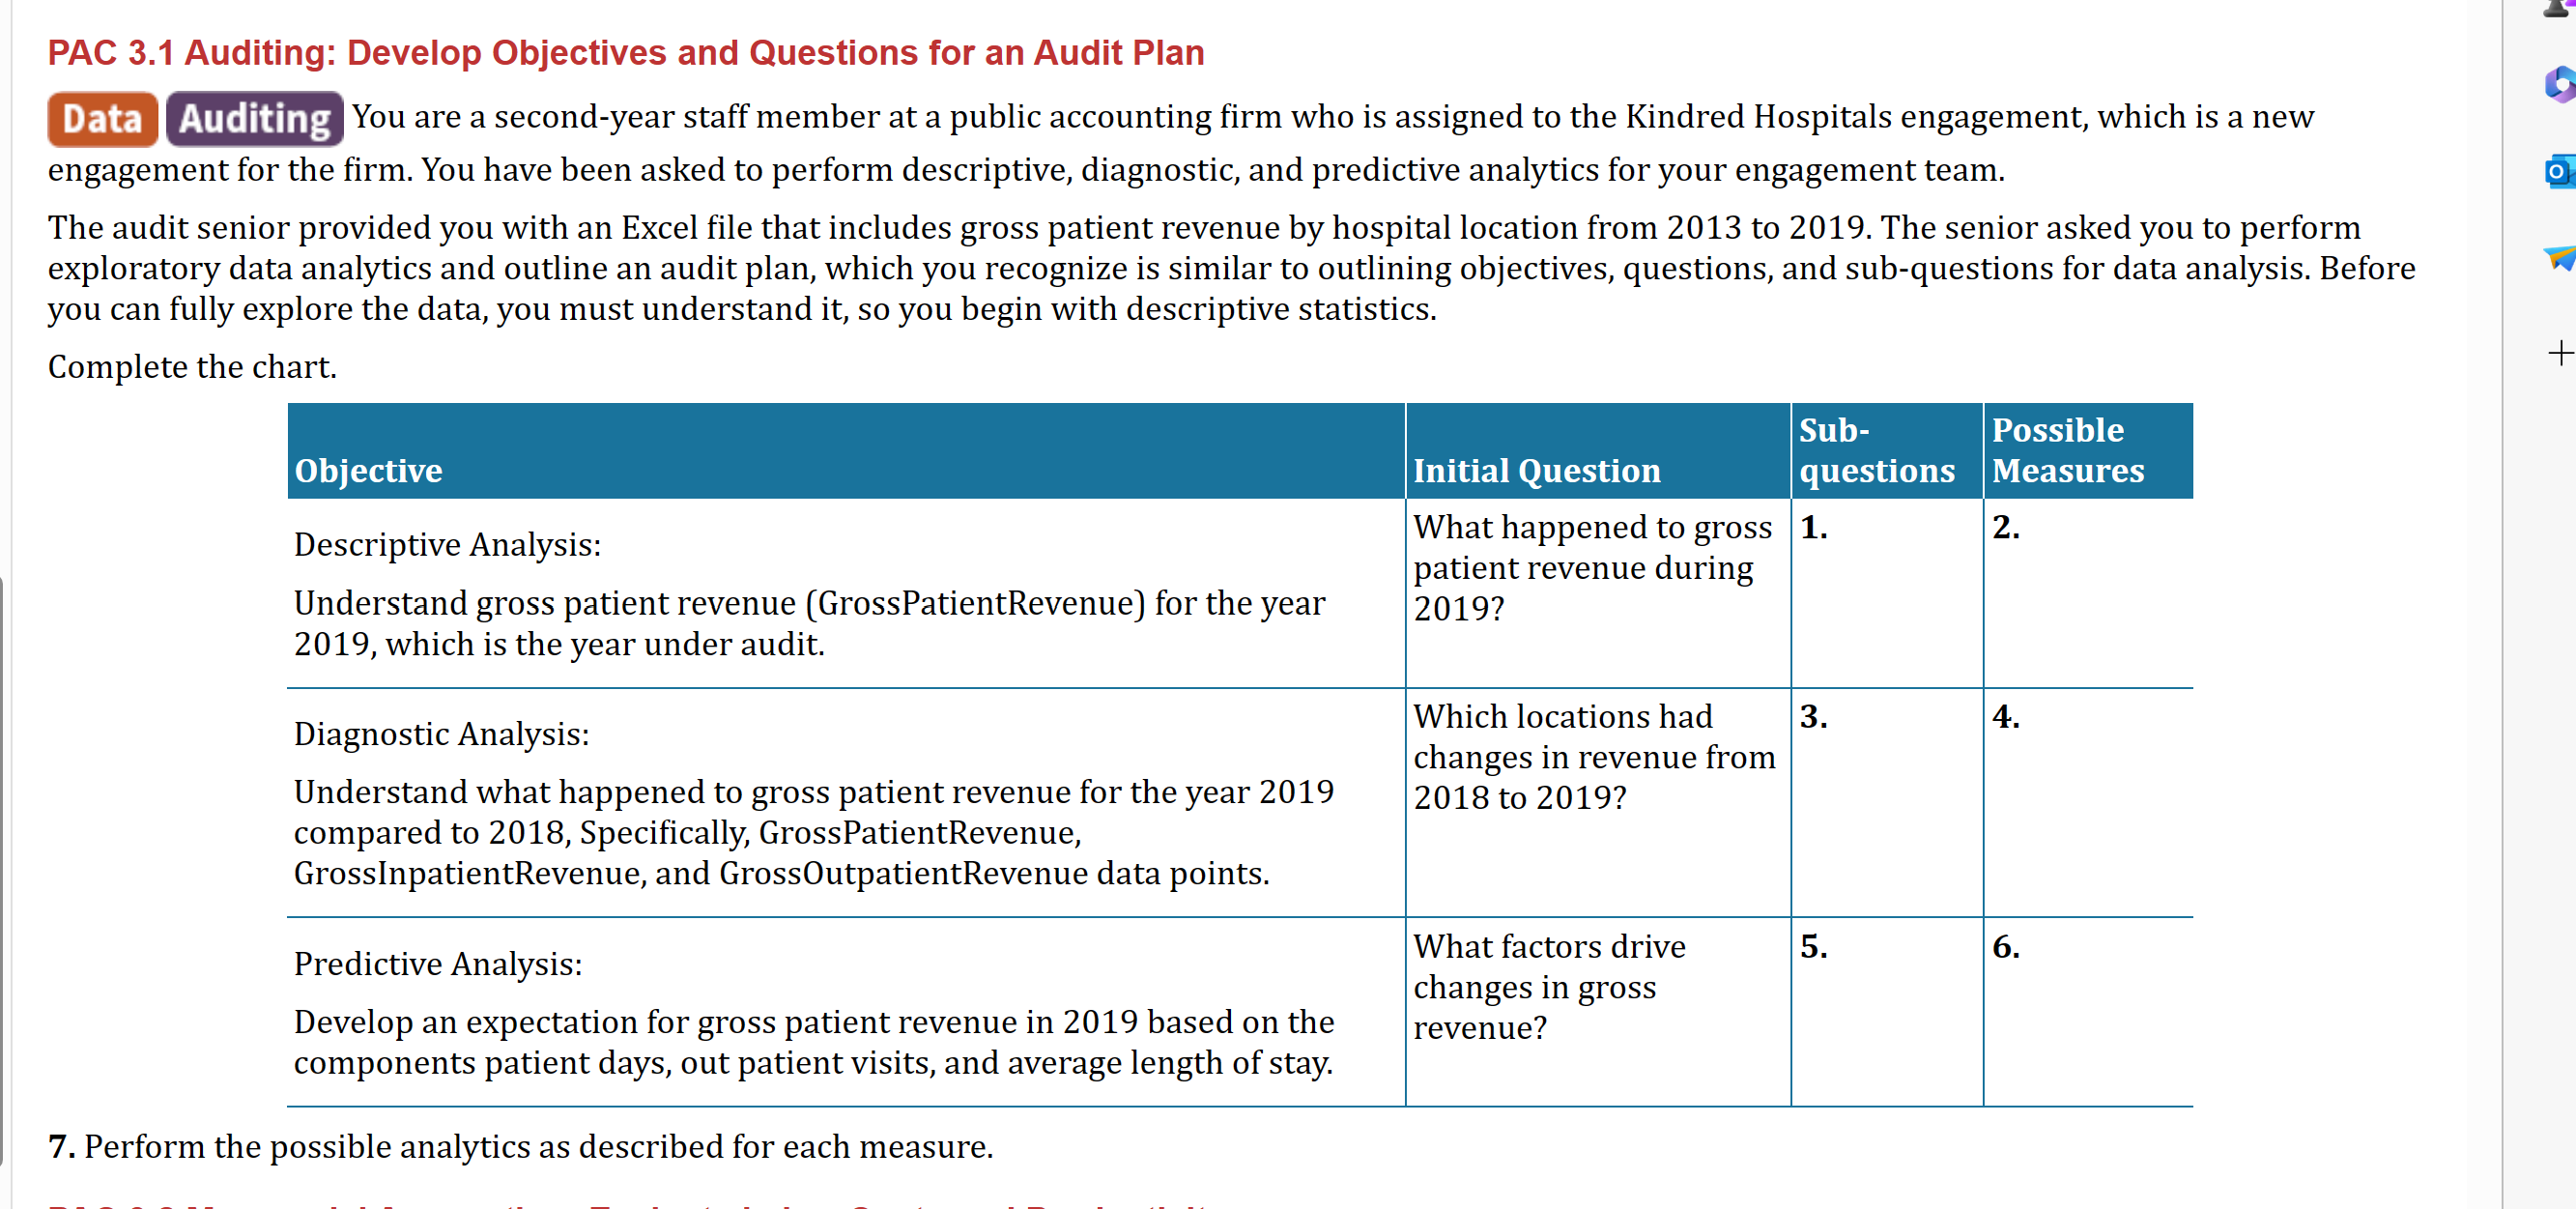
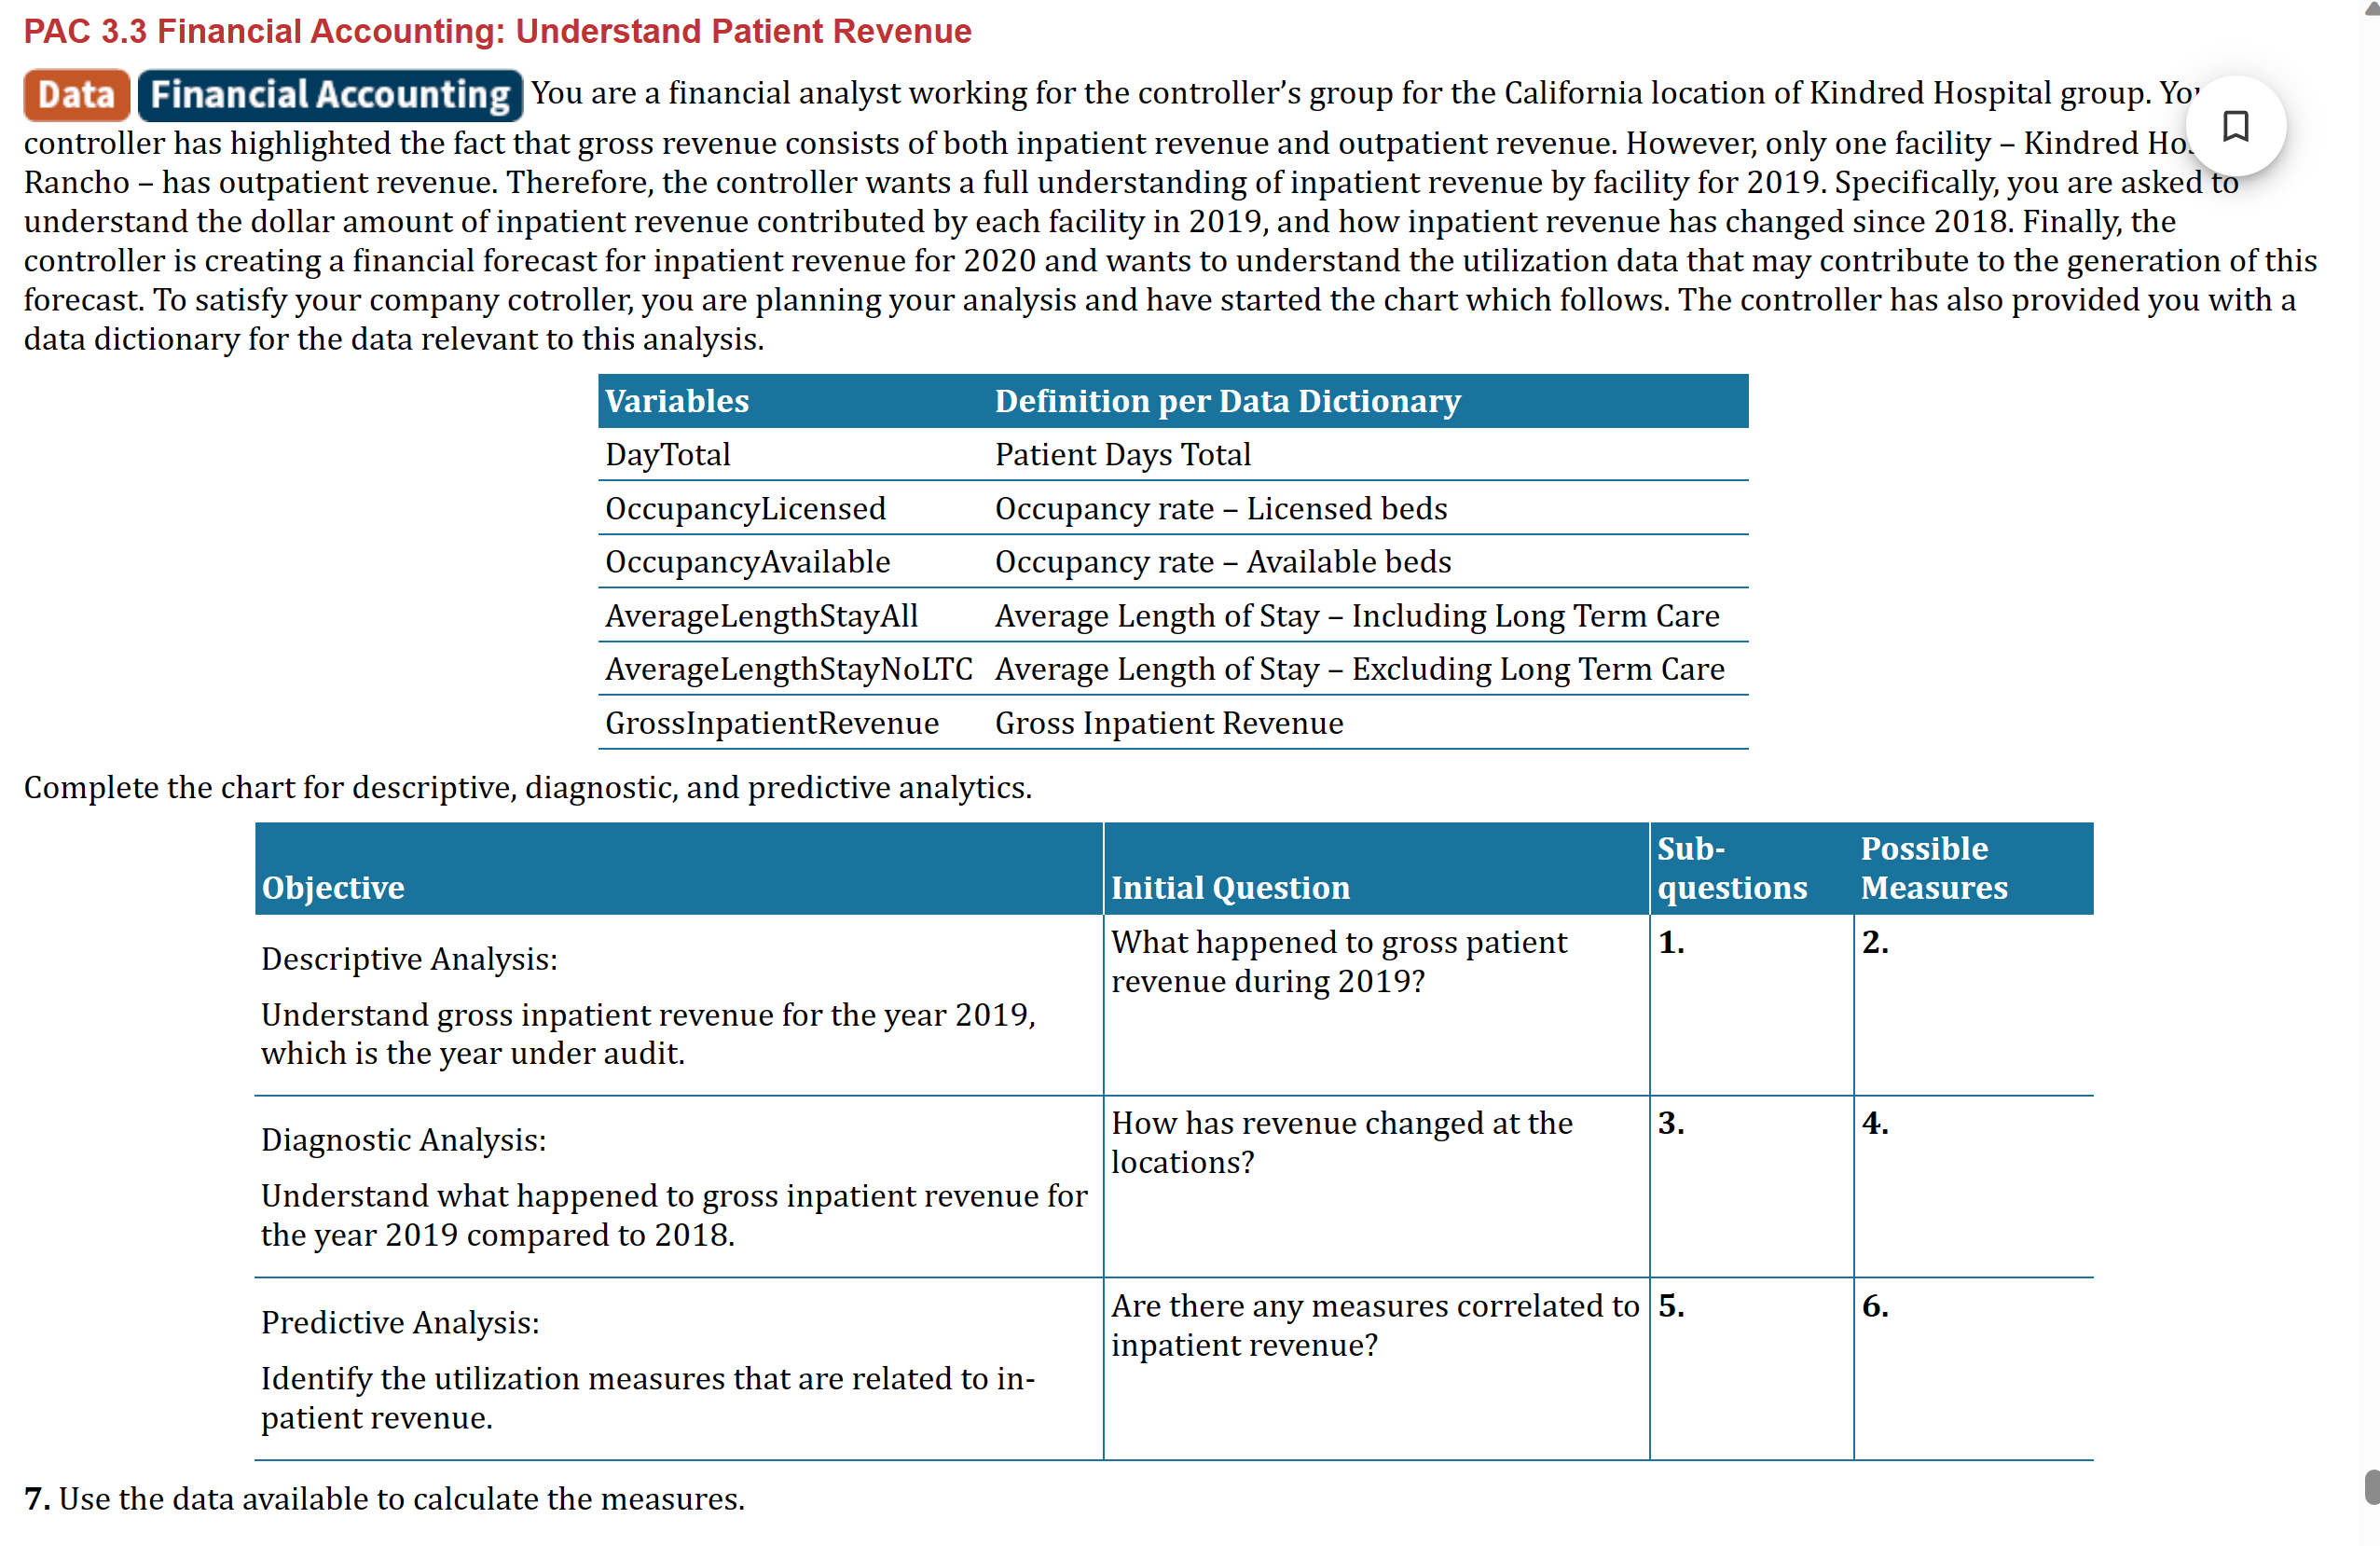
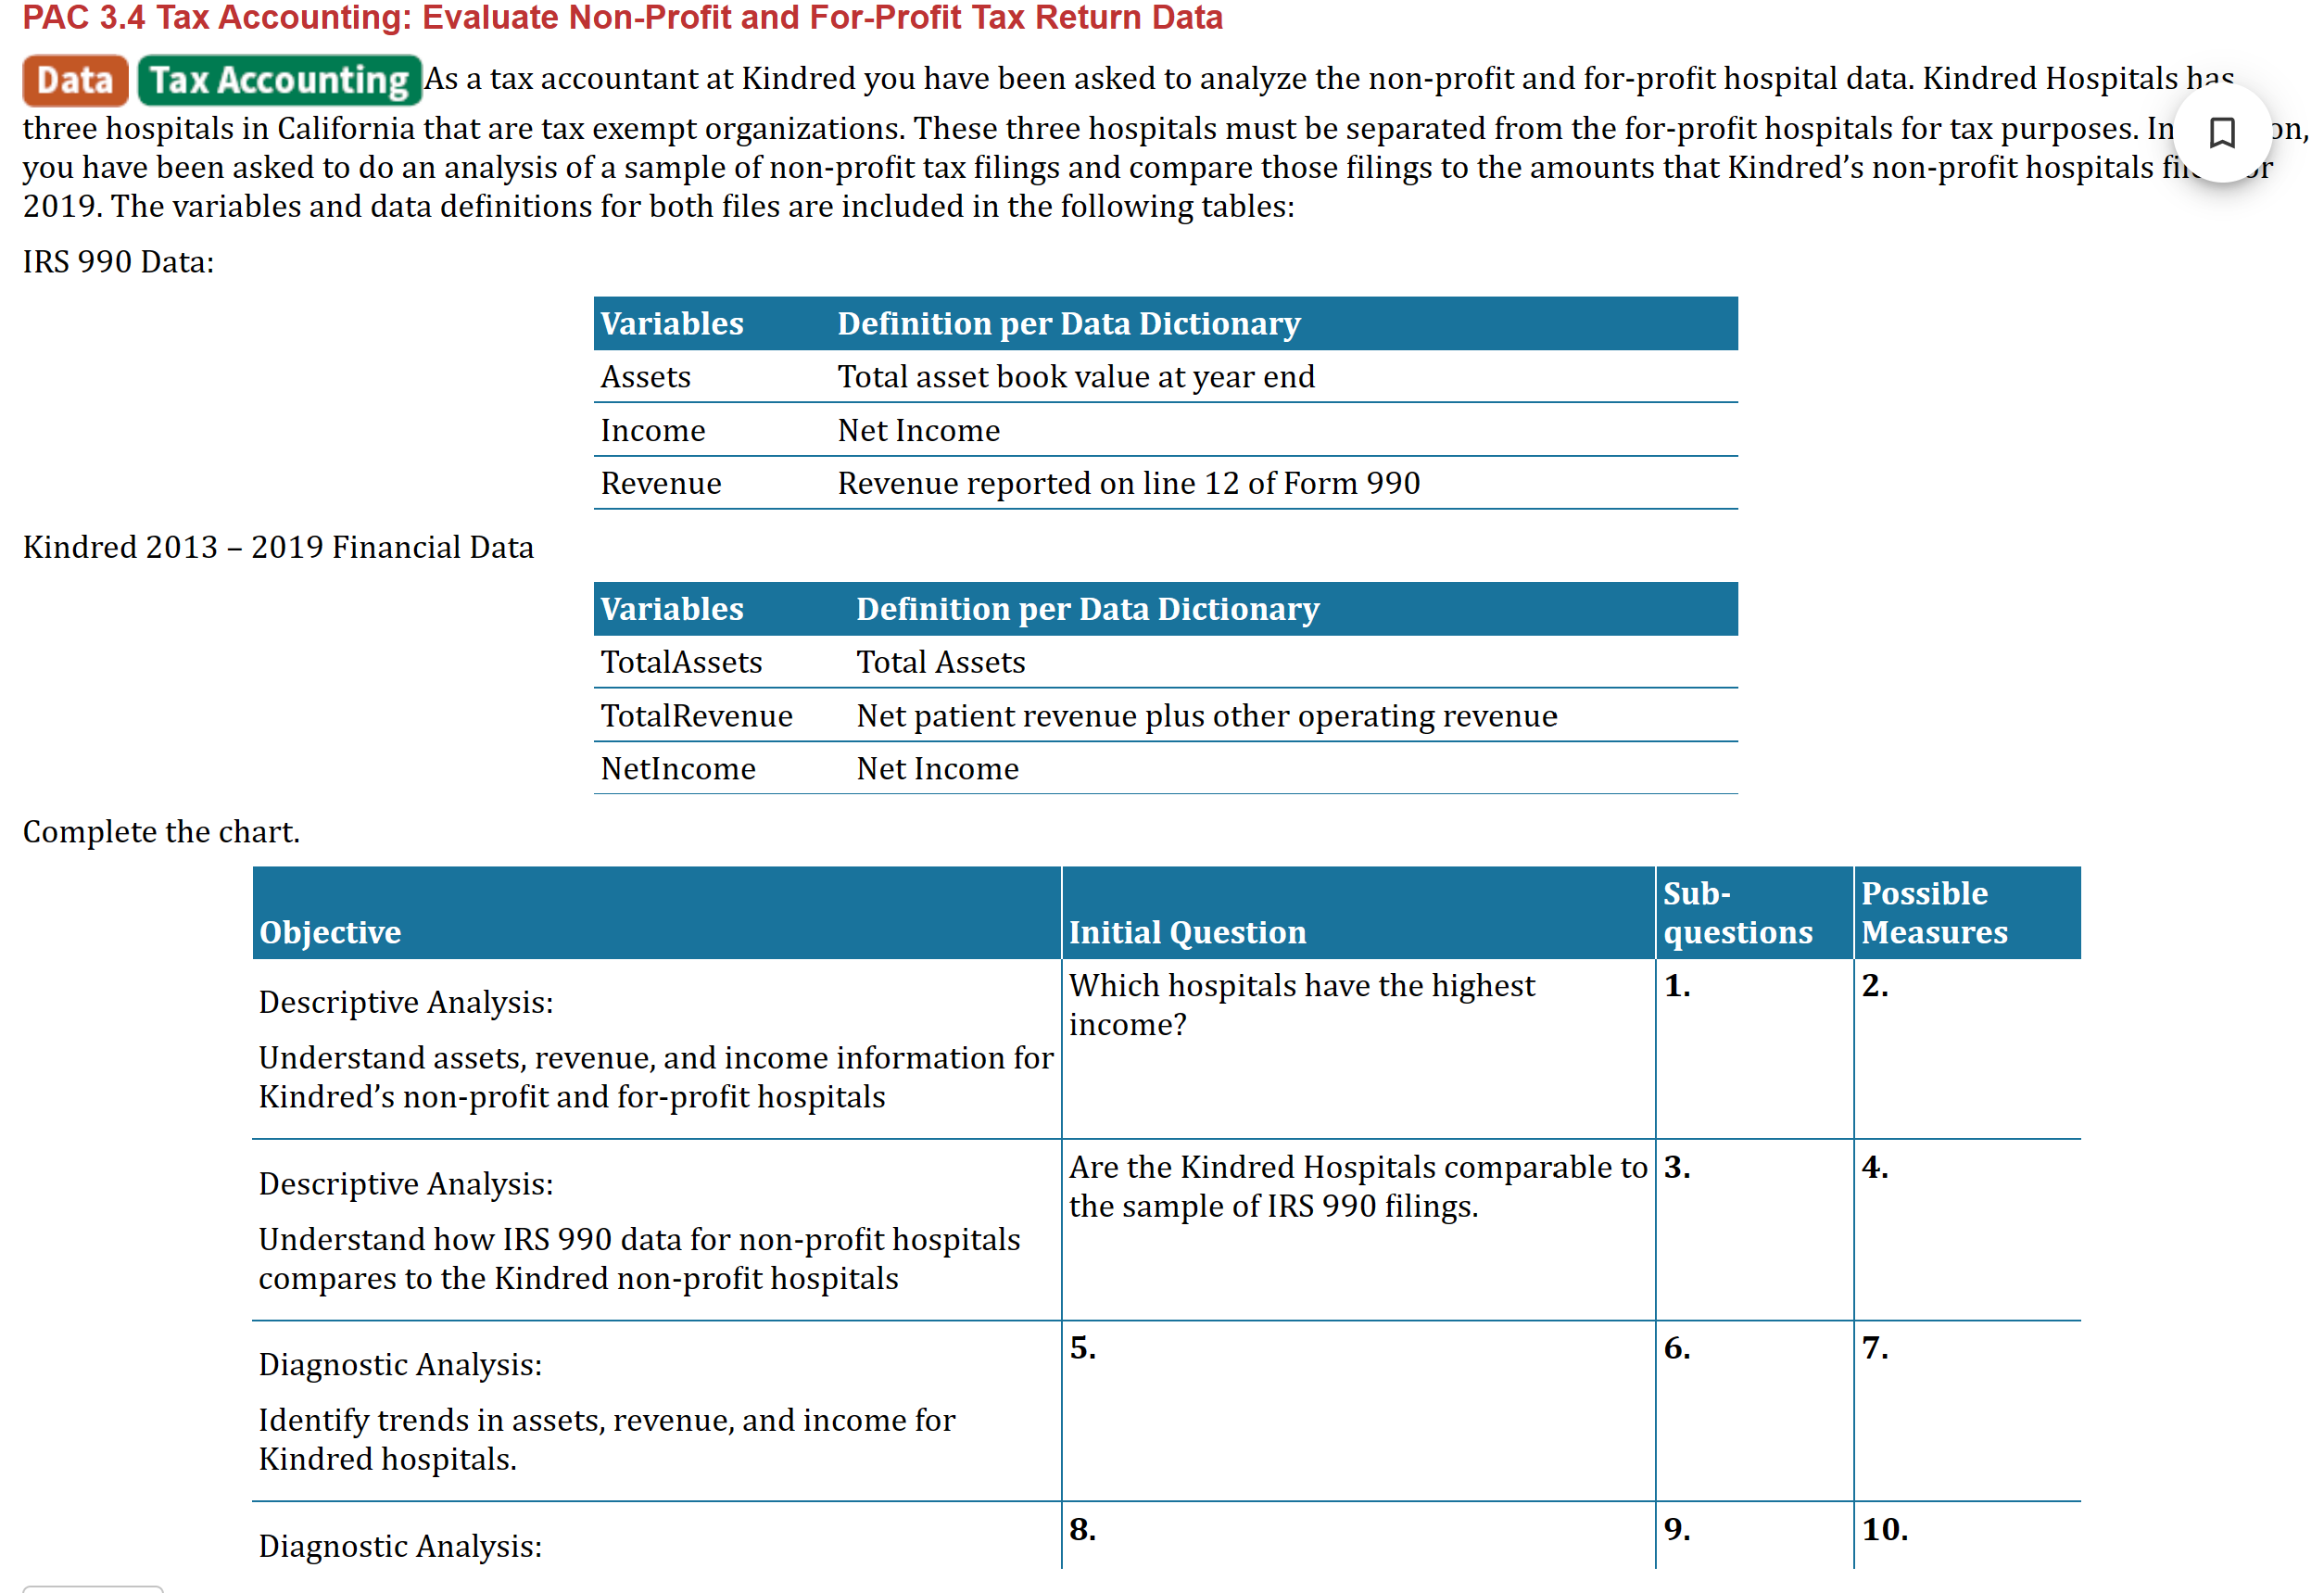

Kindred has 13 long-term acute care hospitals in California: - Baldwin Park - Brea - La Mirada - Los Angeles - Ontario - Paramount - Rancho - Riverside - Sacramento - San Diego - San Francisco Bay Area - South Bay - Westminster The financial statements are prepared based on annual amounts from each of the California locations. The consolidated entity has provided a data file that contains annual data by location for a variety of data fields. PAC 3.1 Auditing: Develop Objectives and Questions for an Audit Plan Auditing You are a second-year staff member at a public accounting firm who is assigned to the Kindred Hospitals engagement, which is a new engagement for the firm. You have been asked to perform descriptive, diagnostic, and predictive analytics for your engagement team. The audit senior provided you with an Excel file that includes gross patient revenue by hospital location from 2013 to 2019 . The senior asked you to perform exploratory data analytics and outline an audit plan, which you recognize is similar to outlining objectives, questions, and sub-questions for data analysis. Before you can fully explore the data, you must understand it, so you begin with descriptive statistics. Complete the chart. 7. Perforl PAC 3.2 Managerial Accounting: Evaluate Labor Costs and Productivity Assume you are a managerial accountant for the consolidated California group of Kindred Hospitals. The director operations has asked that you analyze the annual data associated with hospital labor. Specifically, the director of operations is interested in the following variables. Complete the chart. 7. Use the data to calculate the measures. PAC 3.3 Financial Accounting: Understand Patient Revenue You are a financial analyst working for the controller's group for the California location of Kindred Hospital group. Yo' controller has highlighted the fact that gross revenue consists of both inpatient revenue and outpatient revenue. However, only one facility - Kindred Ho. Rancho - has outpatient revenue. Therefore, the controller wants a full understanding of inpatient revenue by facility for 2019 . Specifically, you are asked to understand the dollar amount of inpatient revenue contributed by each facility in 2019, and how inpatient revenue has changed since 2018 . Finally, the controller is creating a financial forecast for inpatient revenue for 2020 and wants to understand the utilization data that may contribute to the generation of this forecast. To satisfy your company cotroller, you are planning your analysis and have started the chart which follows. The controller has also provided you with a data dictionary for the data relevant to this analysis. Complete the chart for descriptive, diagnostic, and predictive analytics. 7. Use th PAC 3.4 Tax Accounting: Evaluate Non-Profit and For-Profit Tax Return Data As a tax accountant at Kindred you have been asked to analyze the non-profit and for-profit hospital data. Kindred Hospitals has three hospitals in California that are tax exempt organizations. These three hospitals must be separated from the for-profit hospitals for tax purposes. In you have been asked to do an analysis of a sample of non-profit tax filings and compare those filings to the amounts that Kindred's non-profit hospitals fih or 2019. The variables and data definitions for both files are included in the following tables: IRS 990 Data: Kindred 2013 - 2019 Financial Data Complete the chart. 11. Use the data to calculate the measures
Step by Step Solution
There are 3 Steps involved in it

Get step-by-step solutions from verified subject matter experts