

Question: Page 1 Exam Score Study Tool Used 76 Study Guide 78 Study Videos 79 Study Guide 67 Did not study 74 Study Guide 70 Study
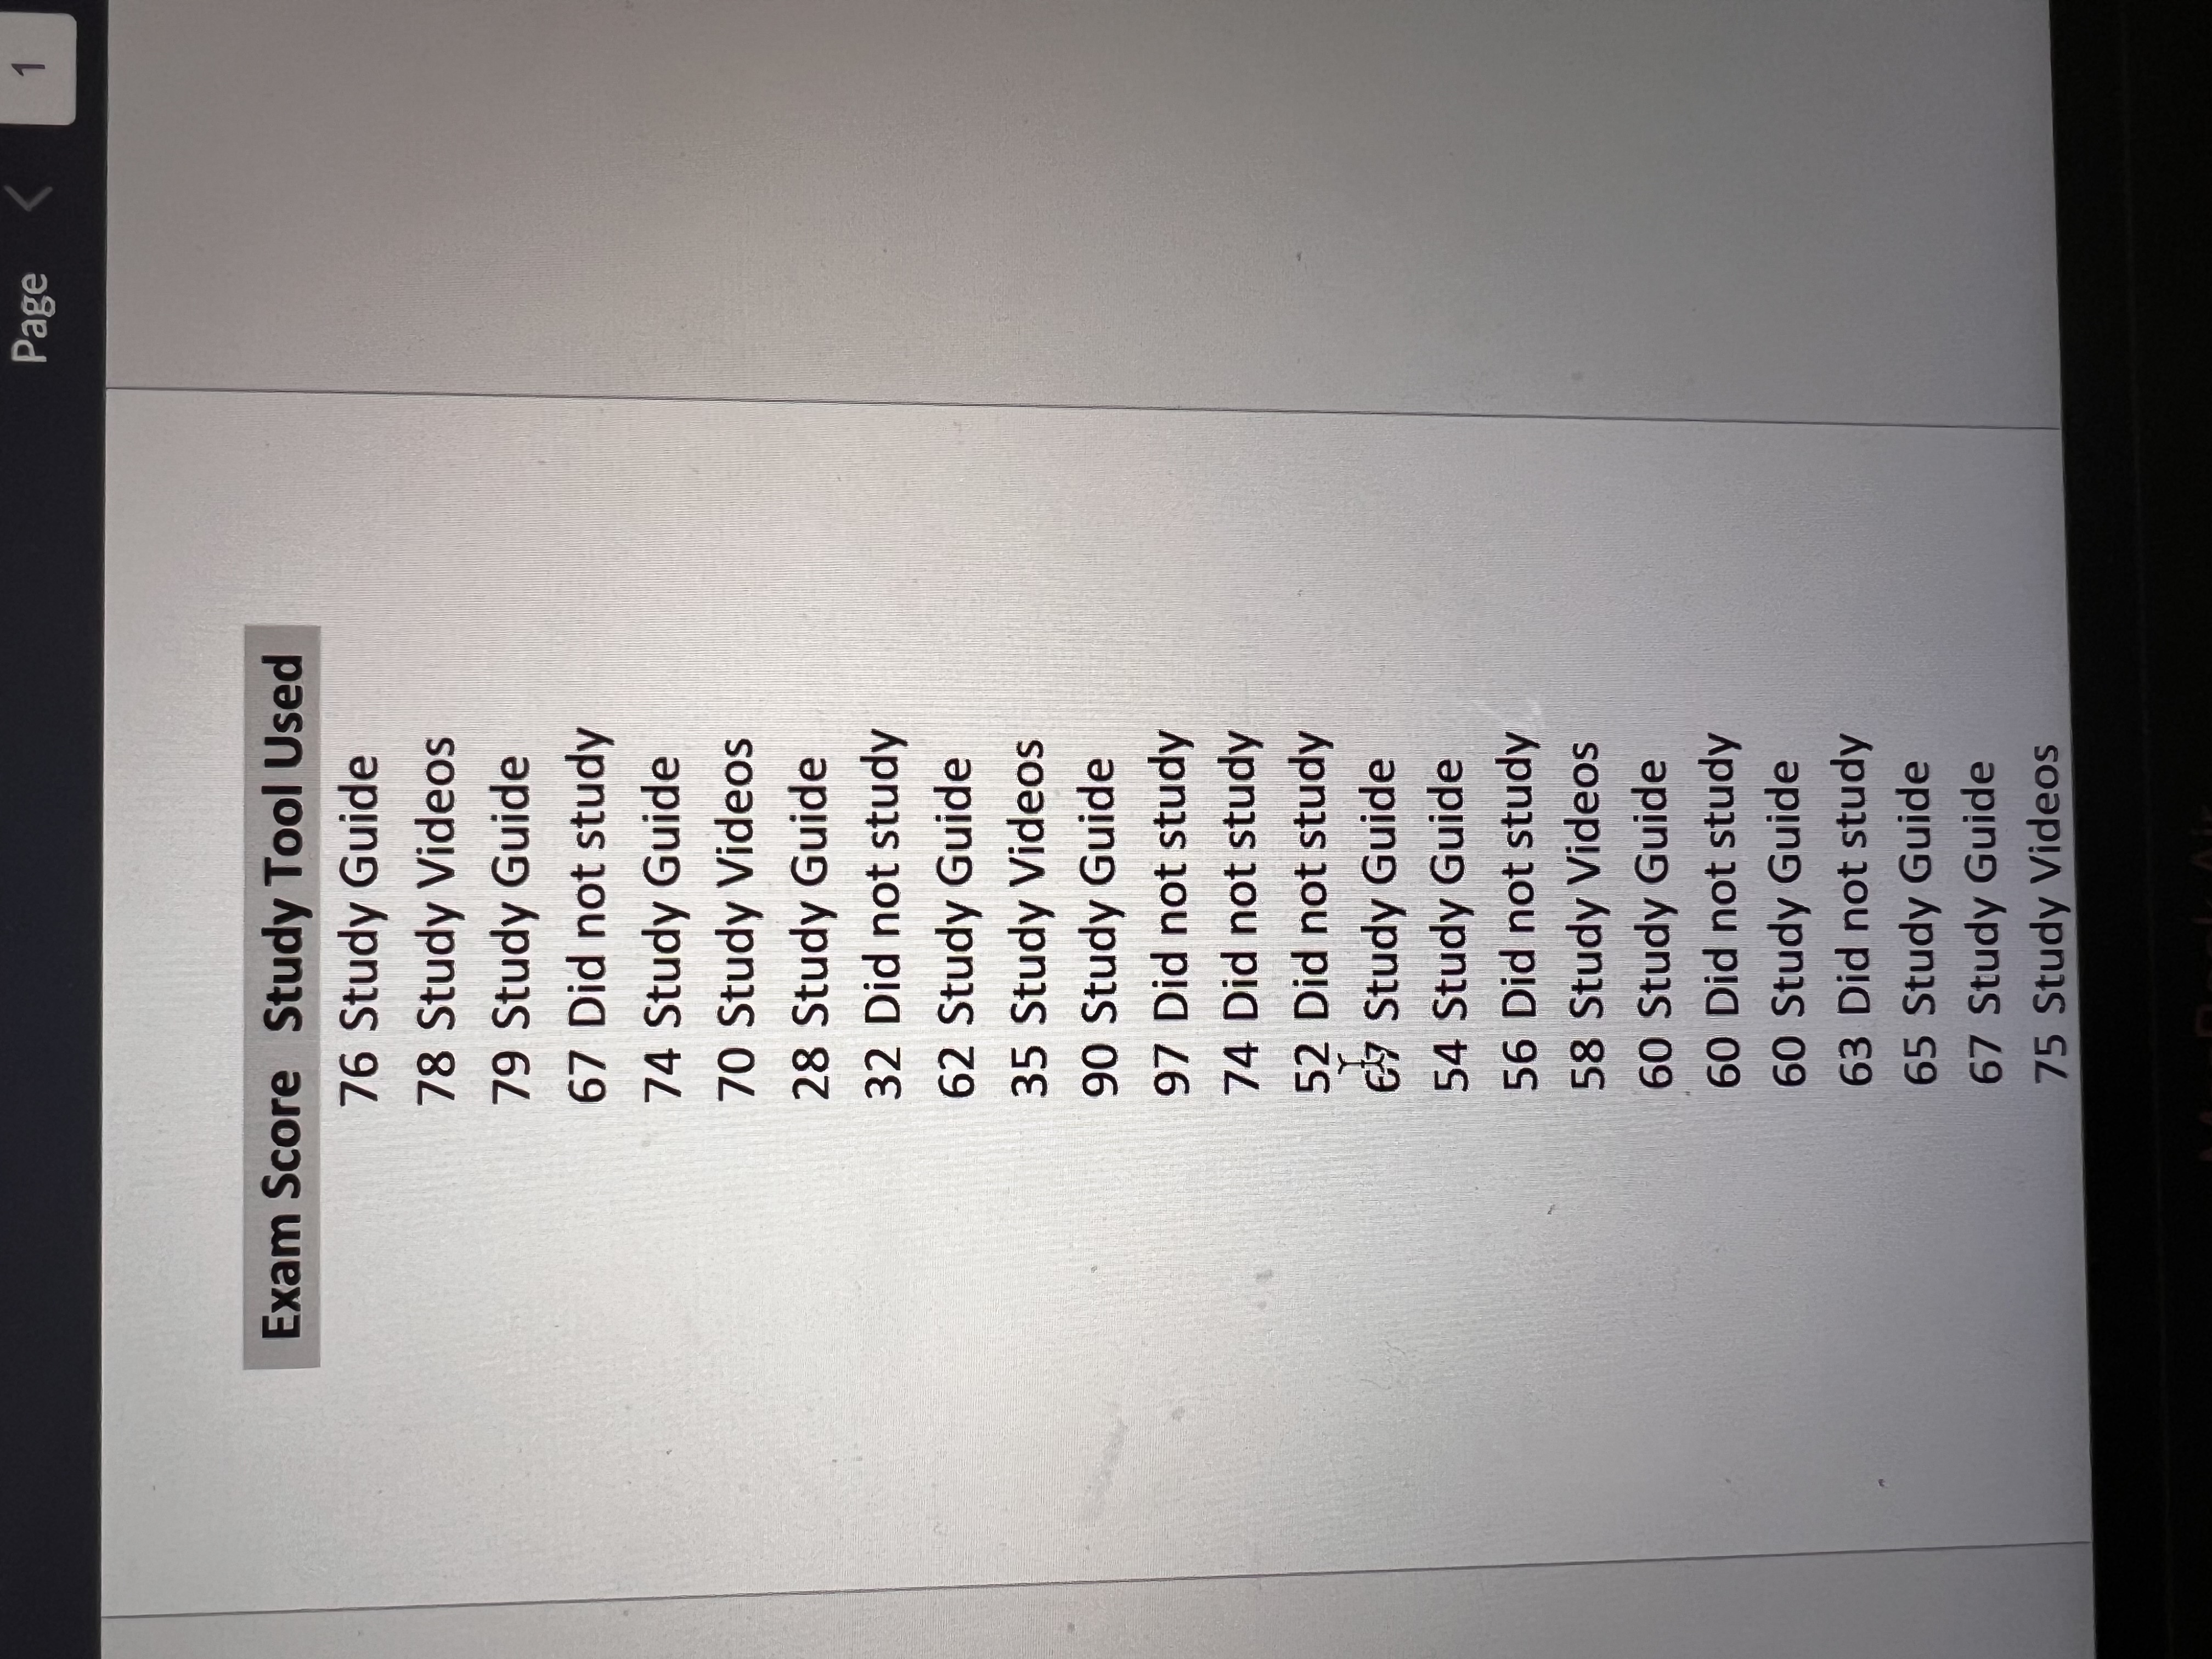
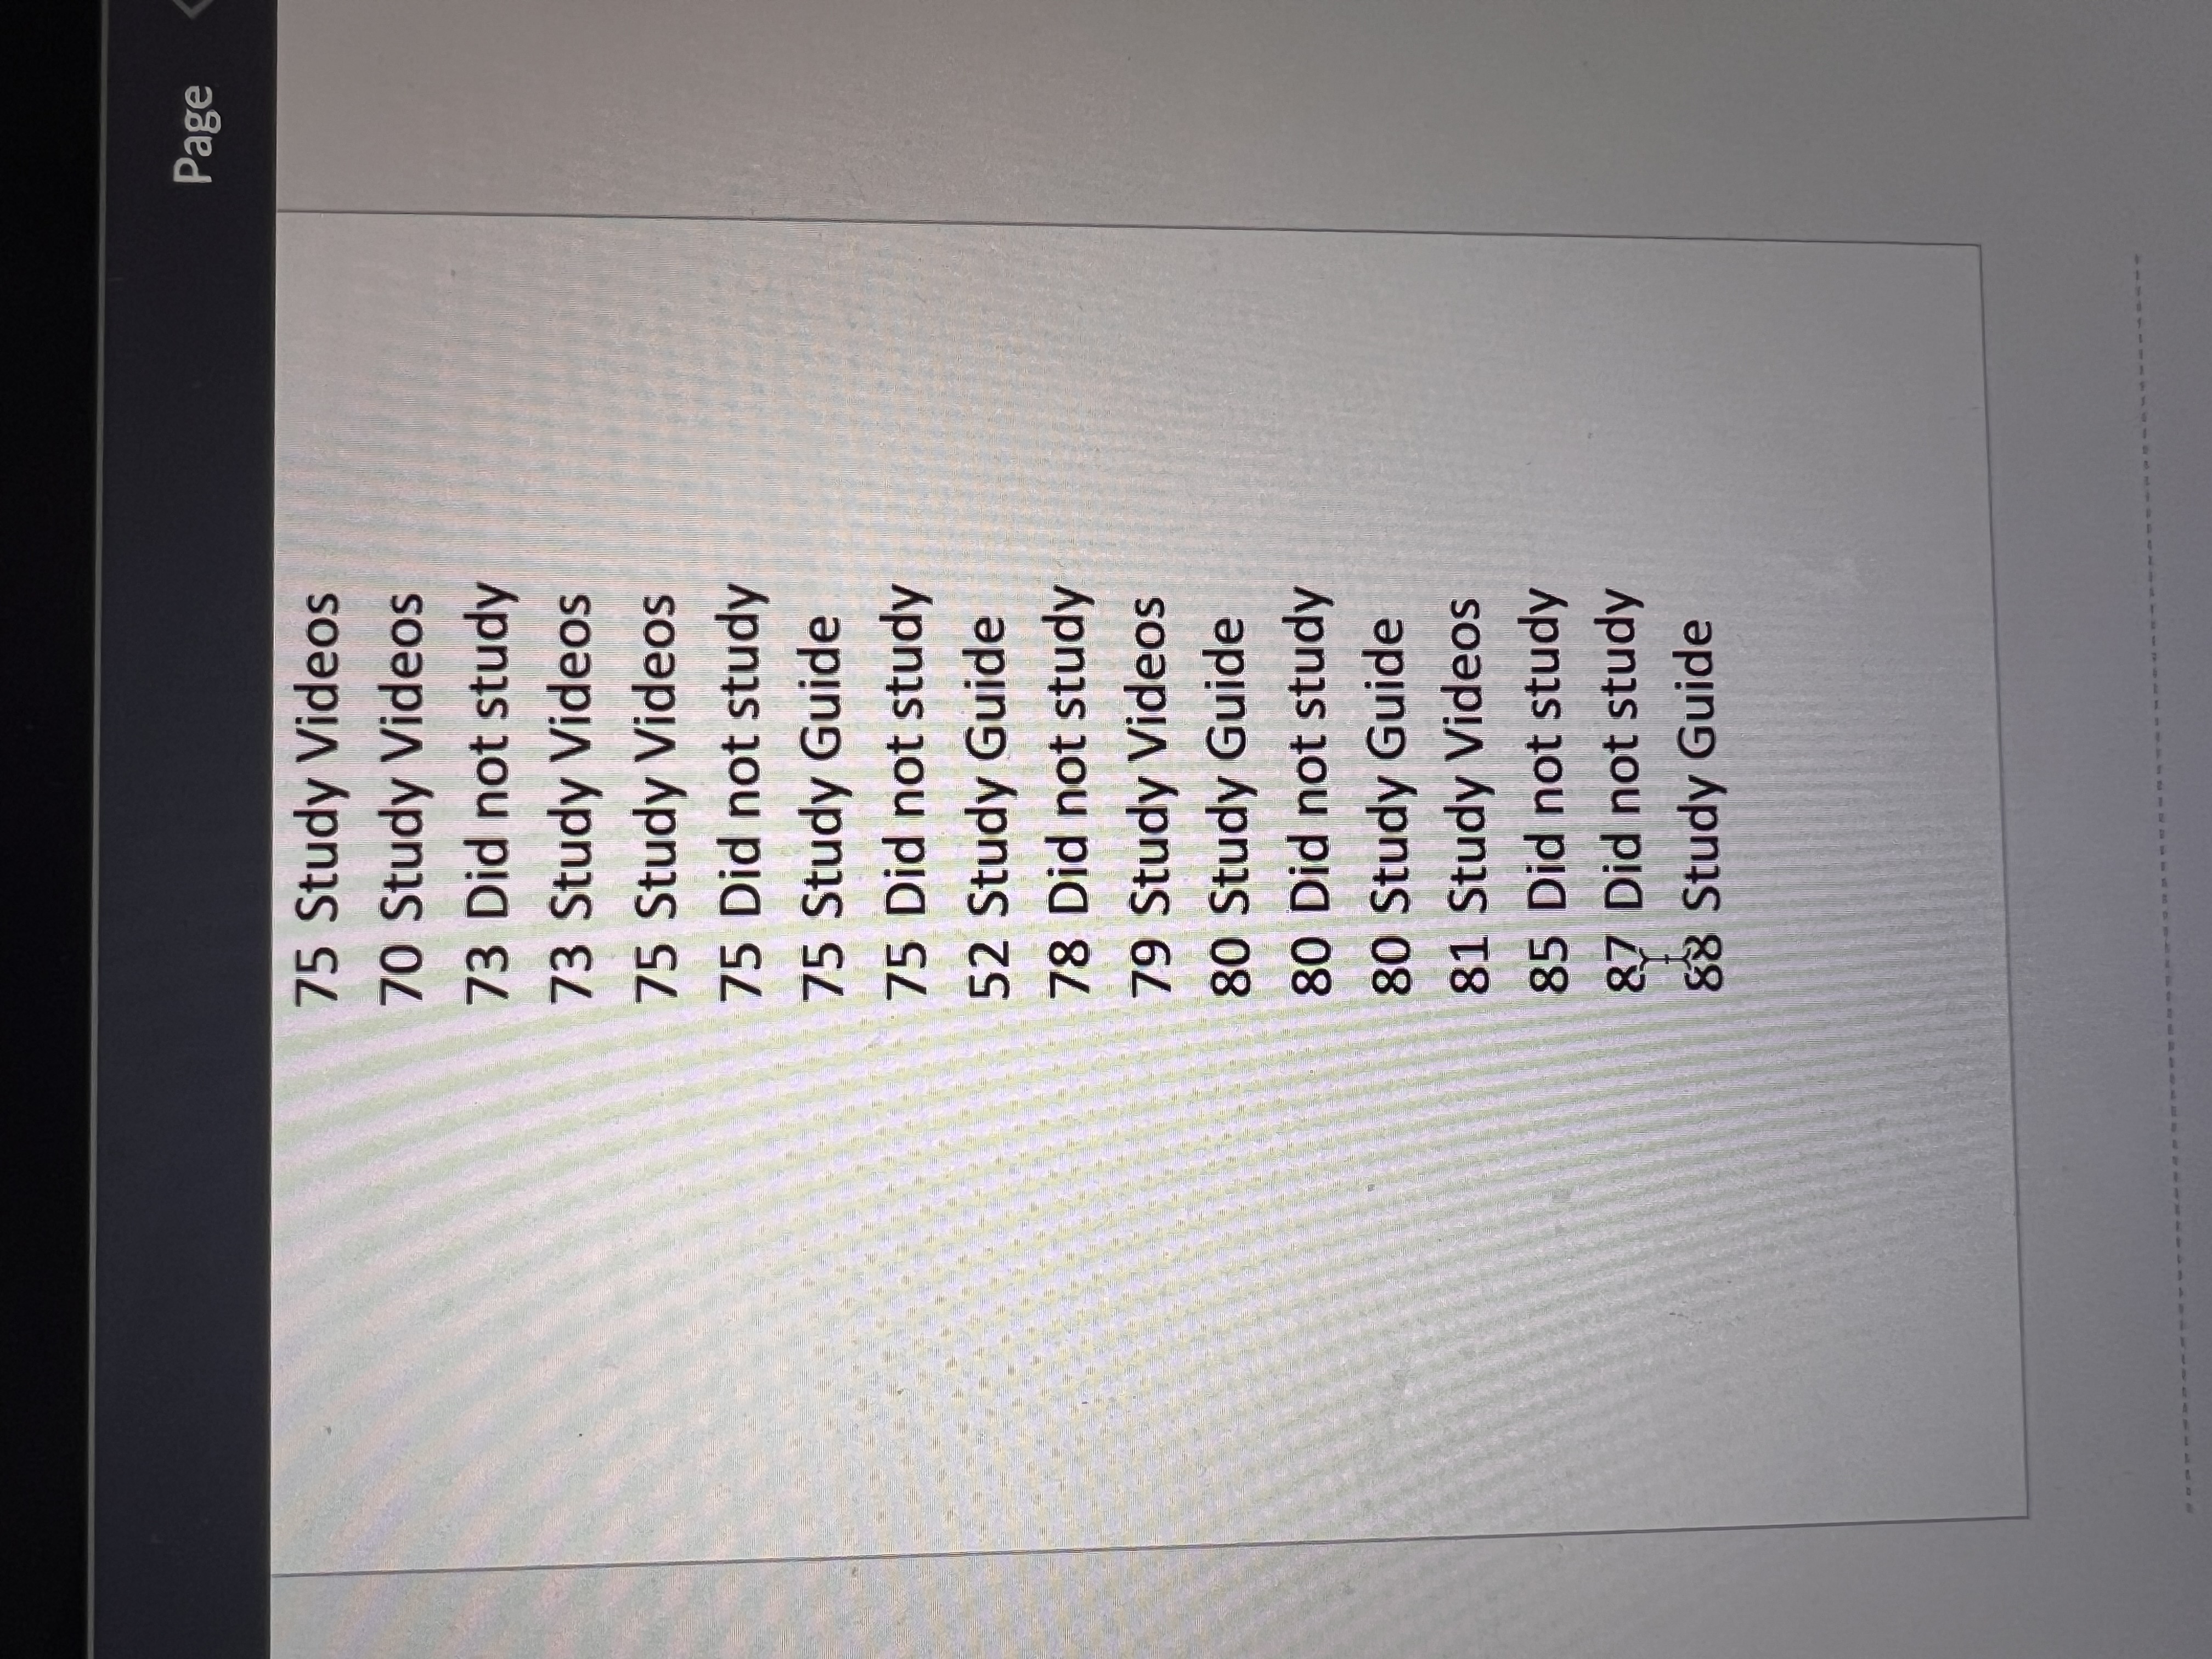
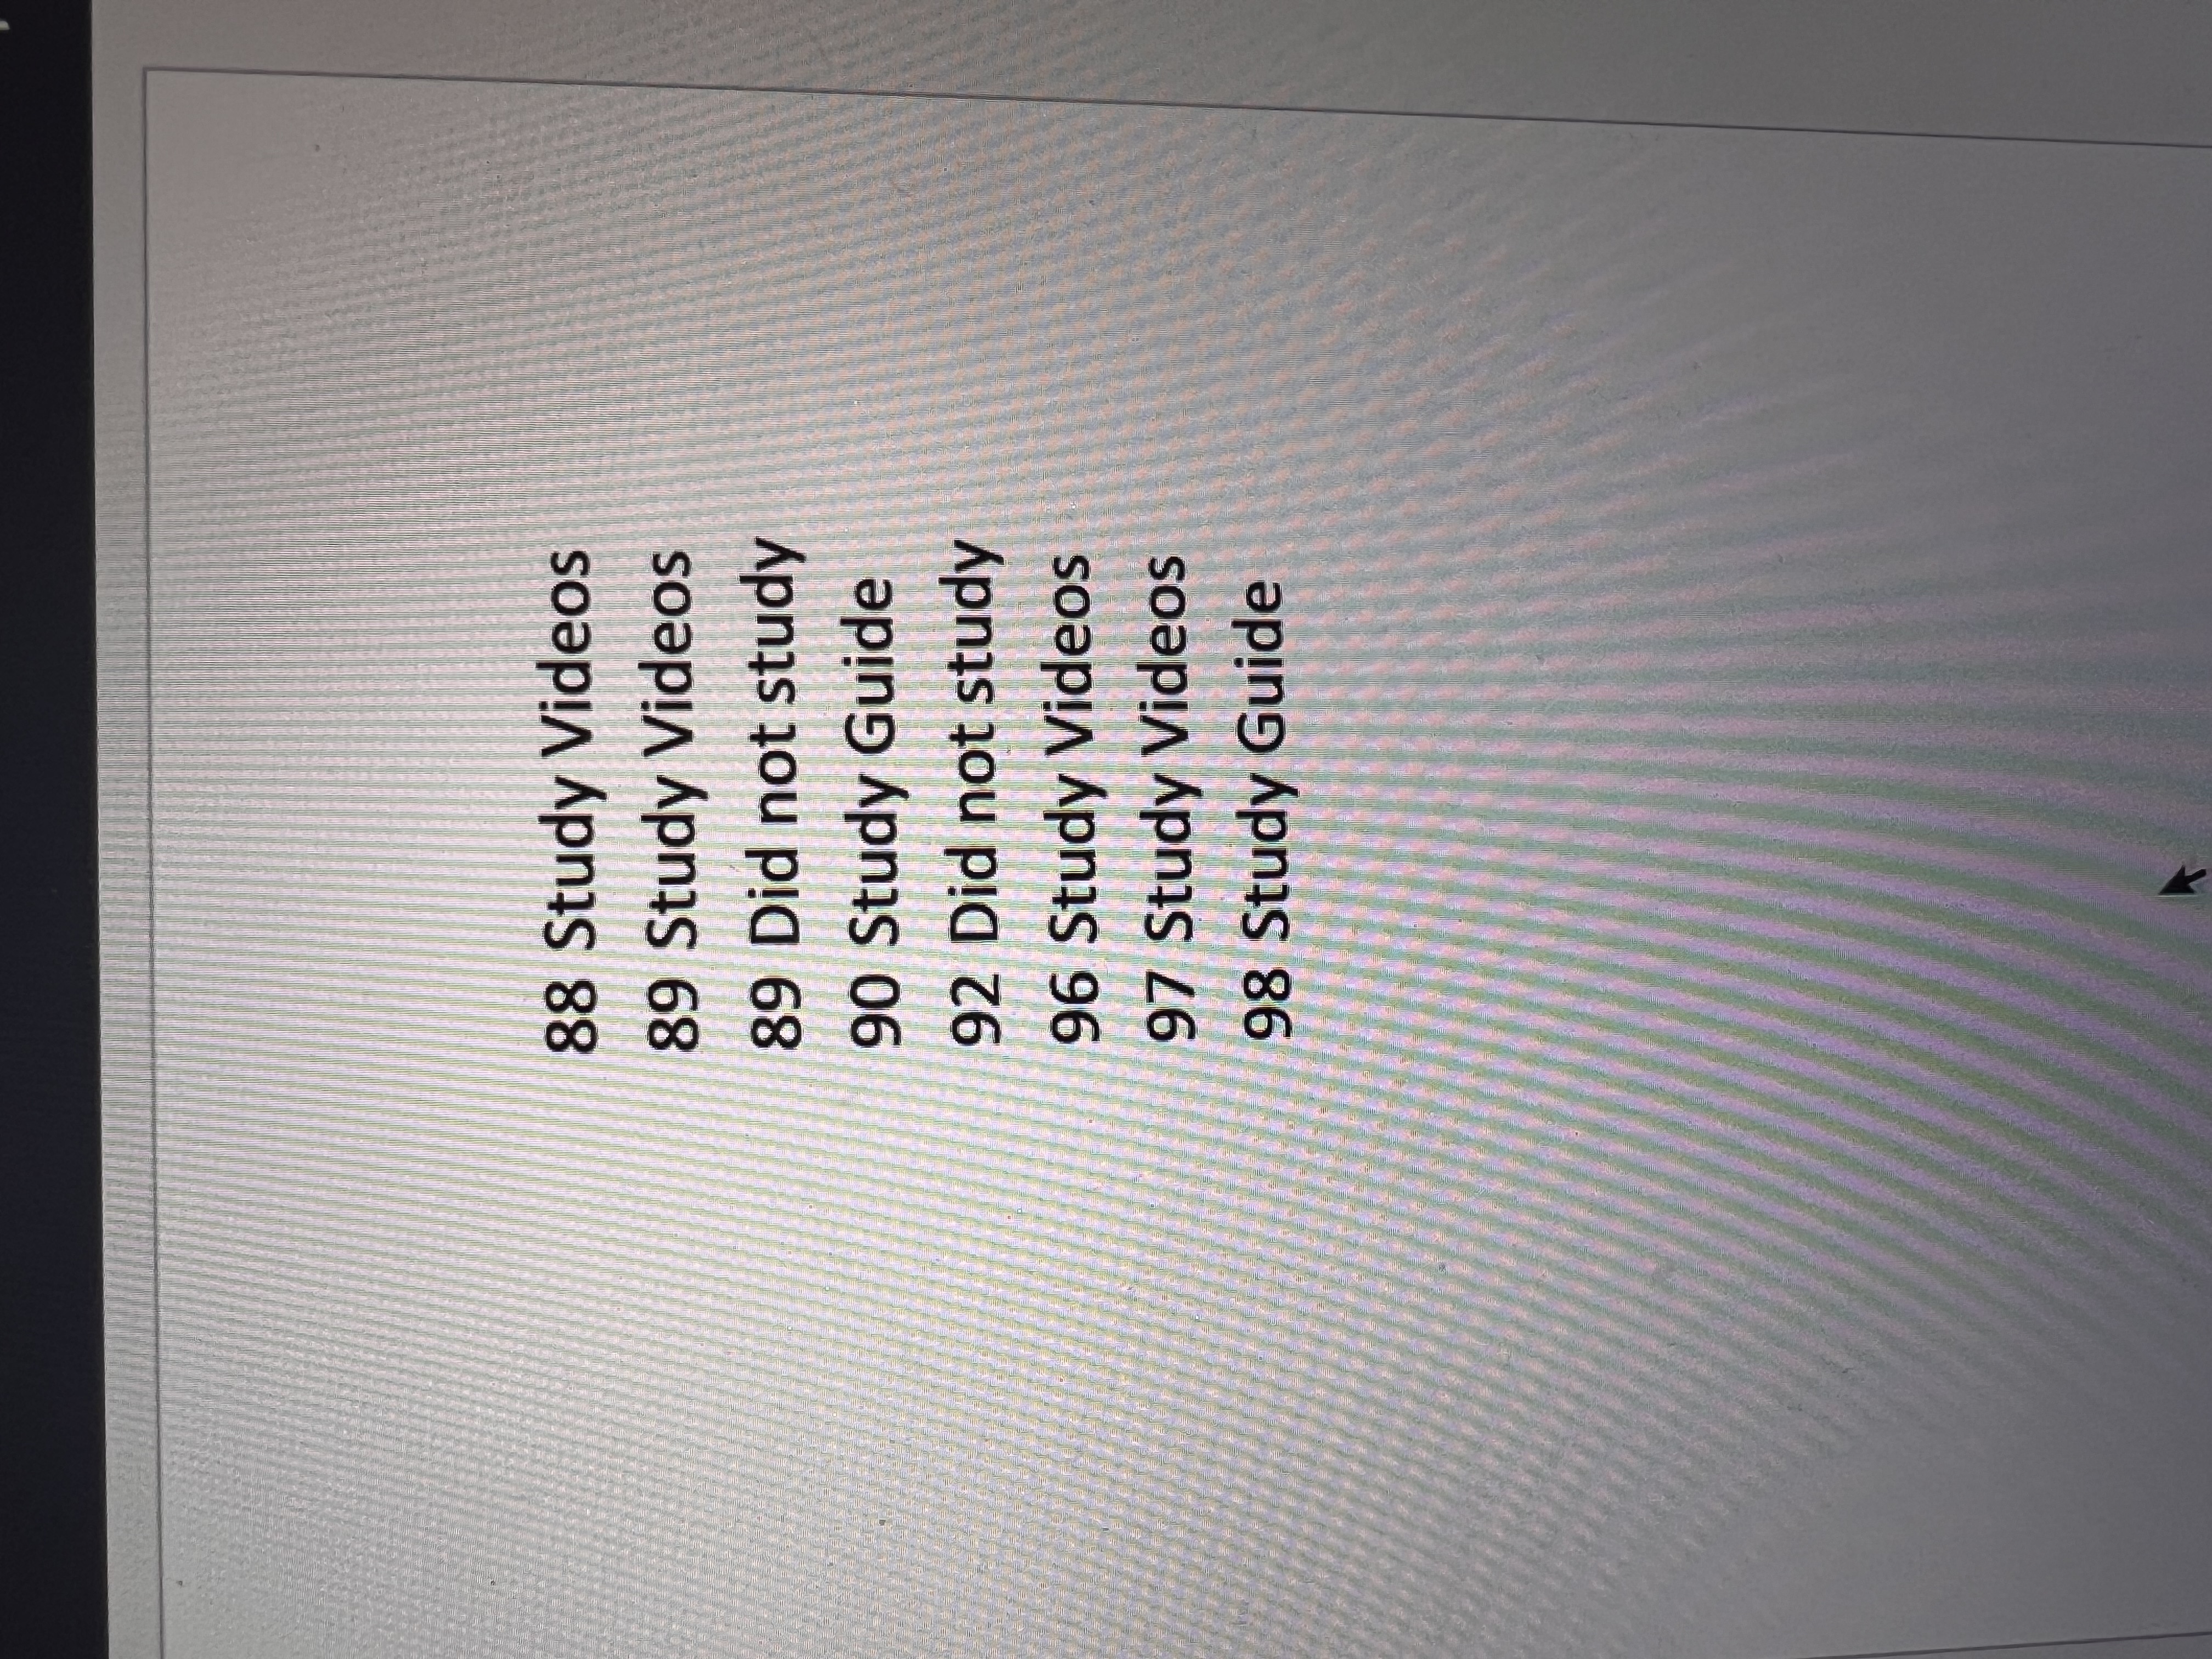
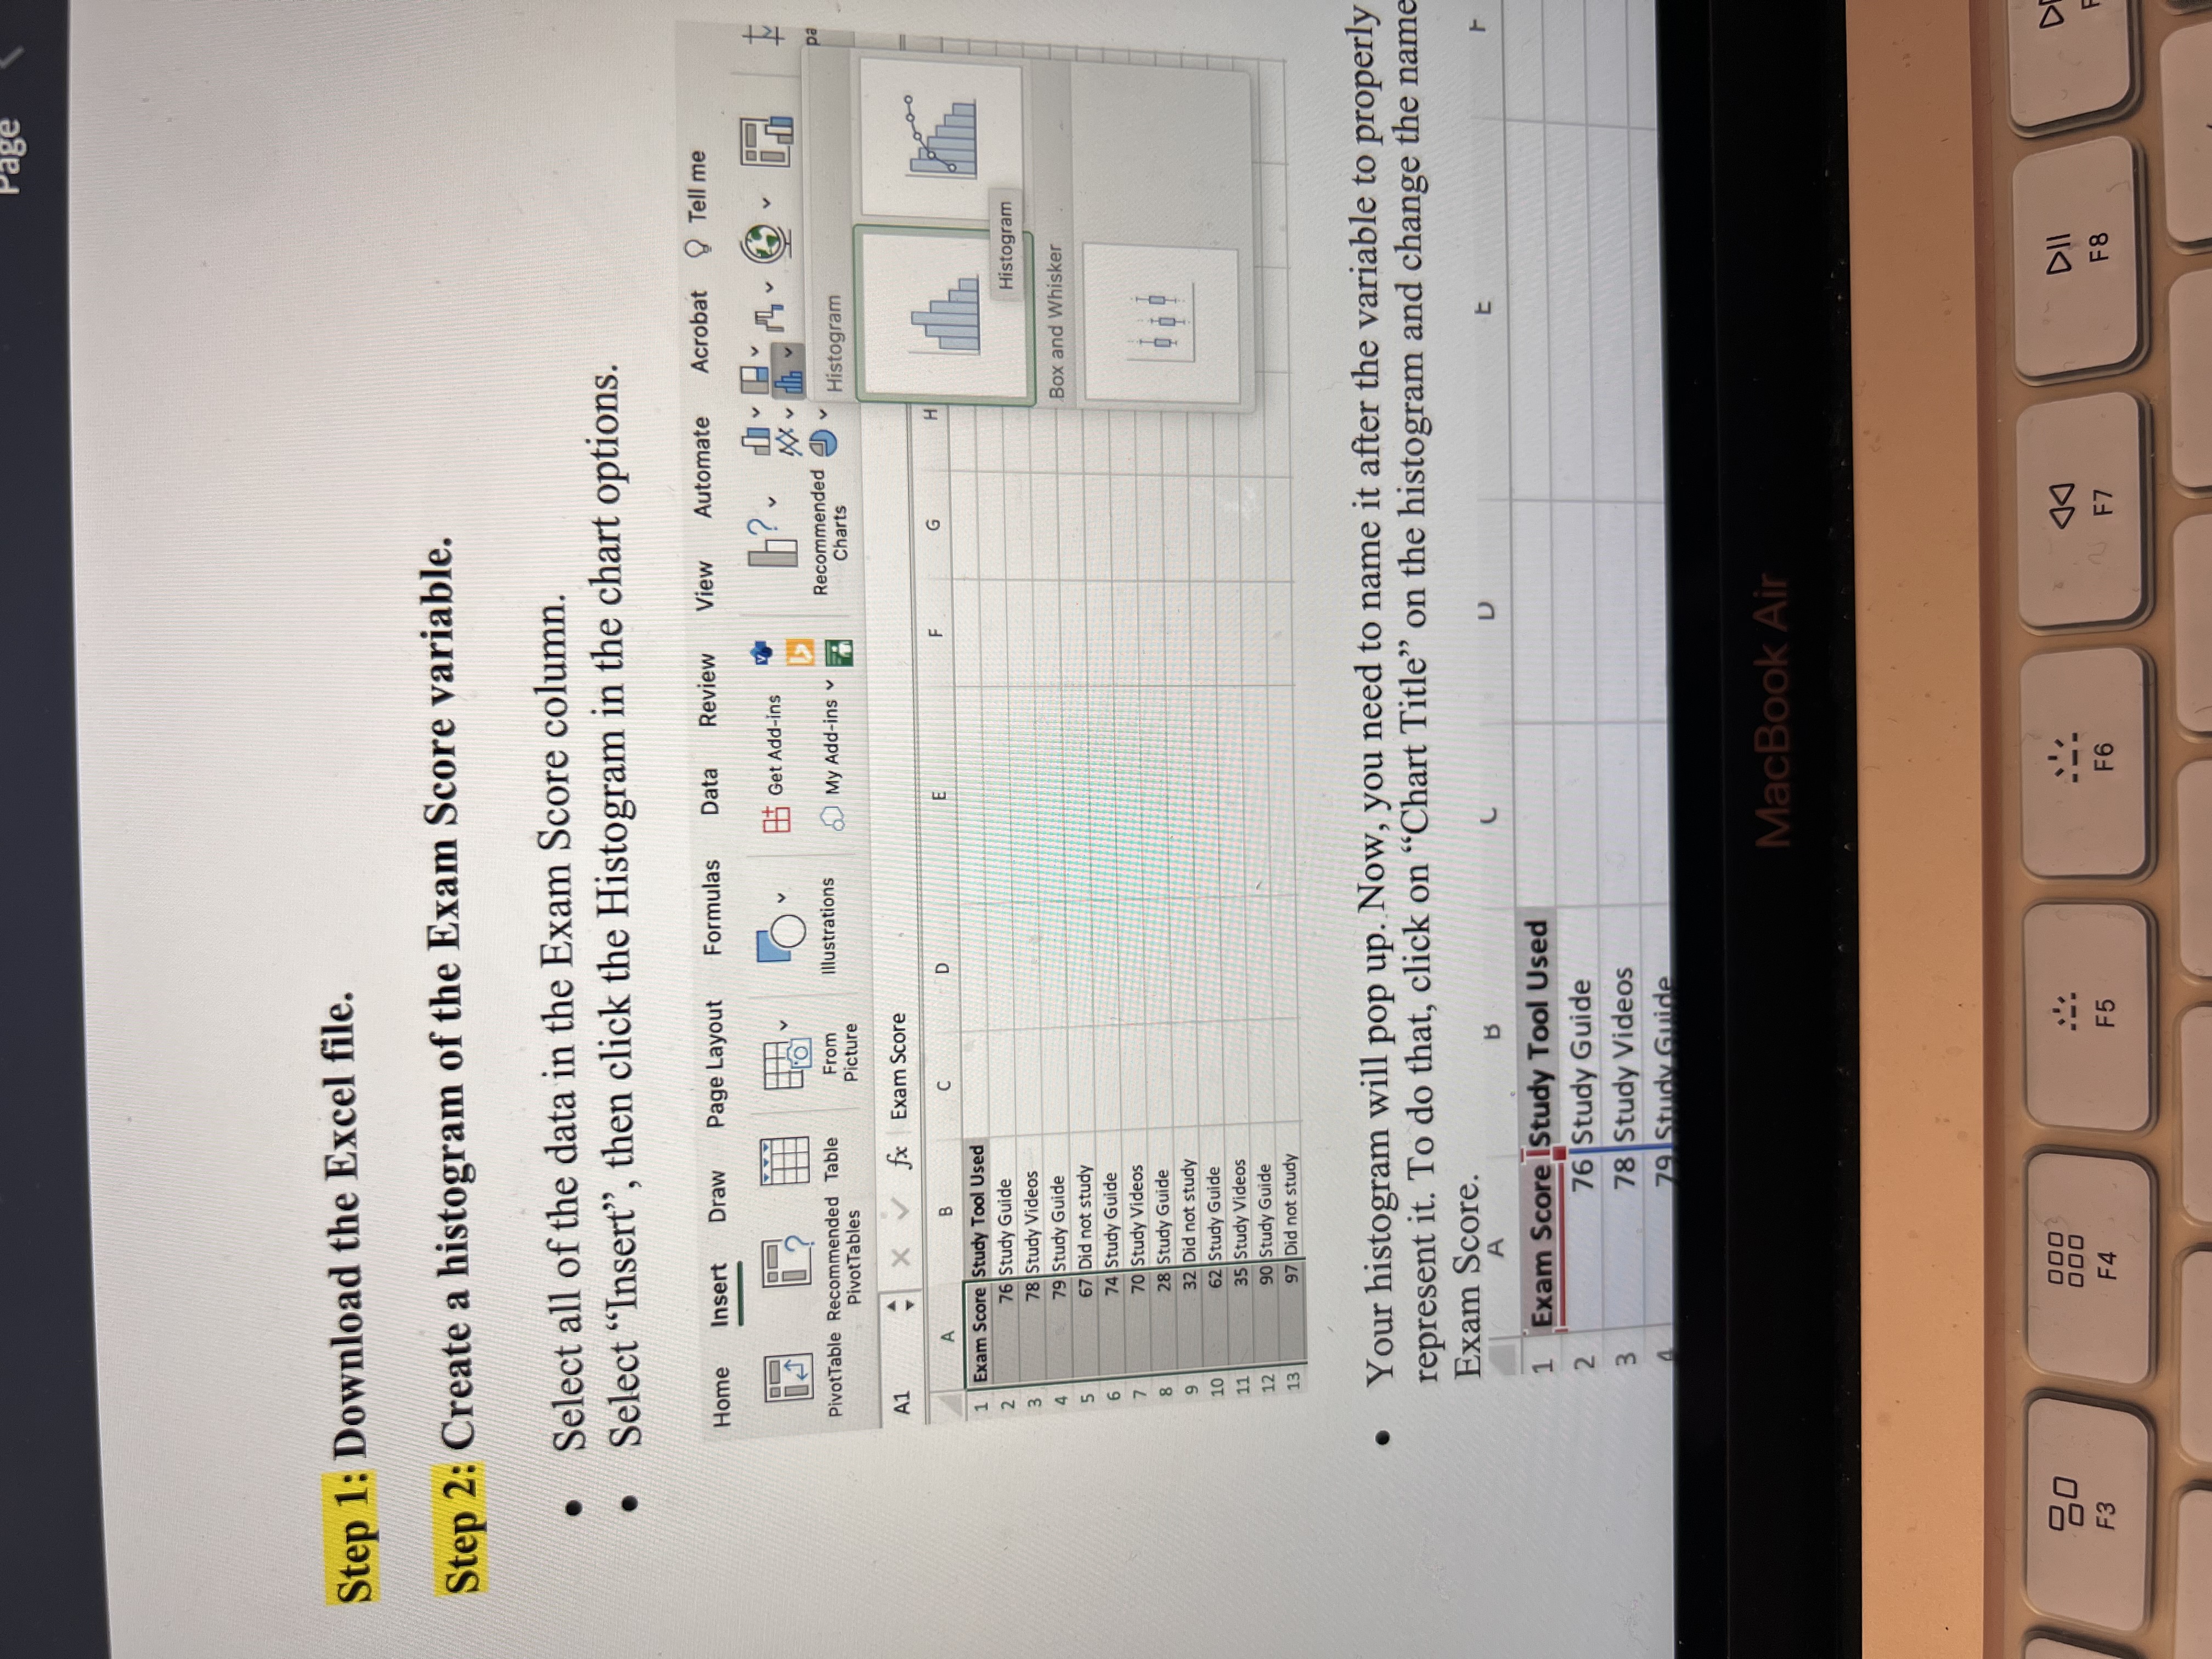
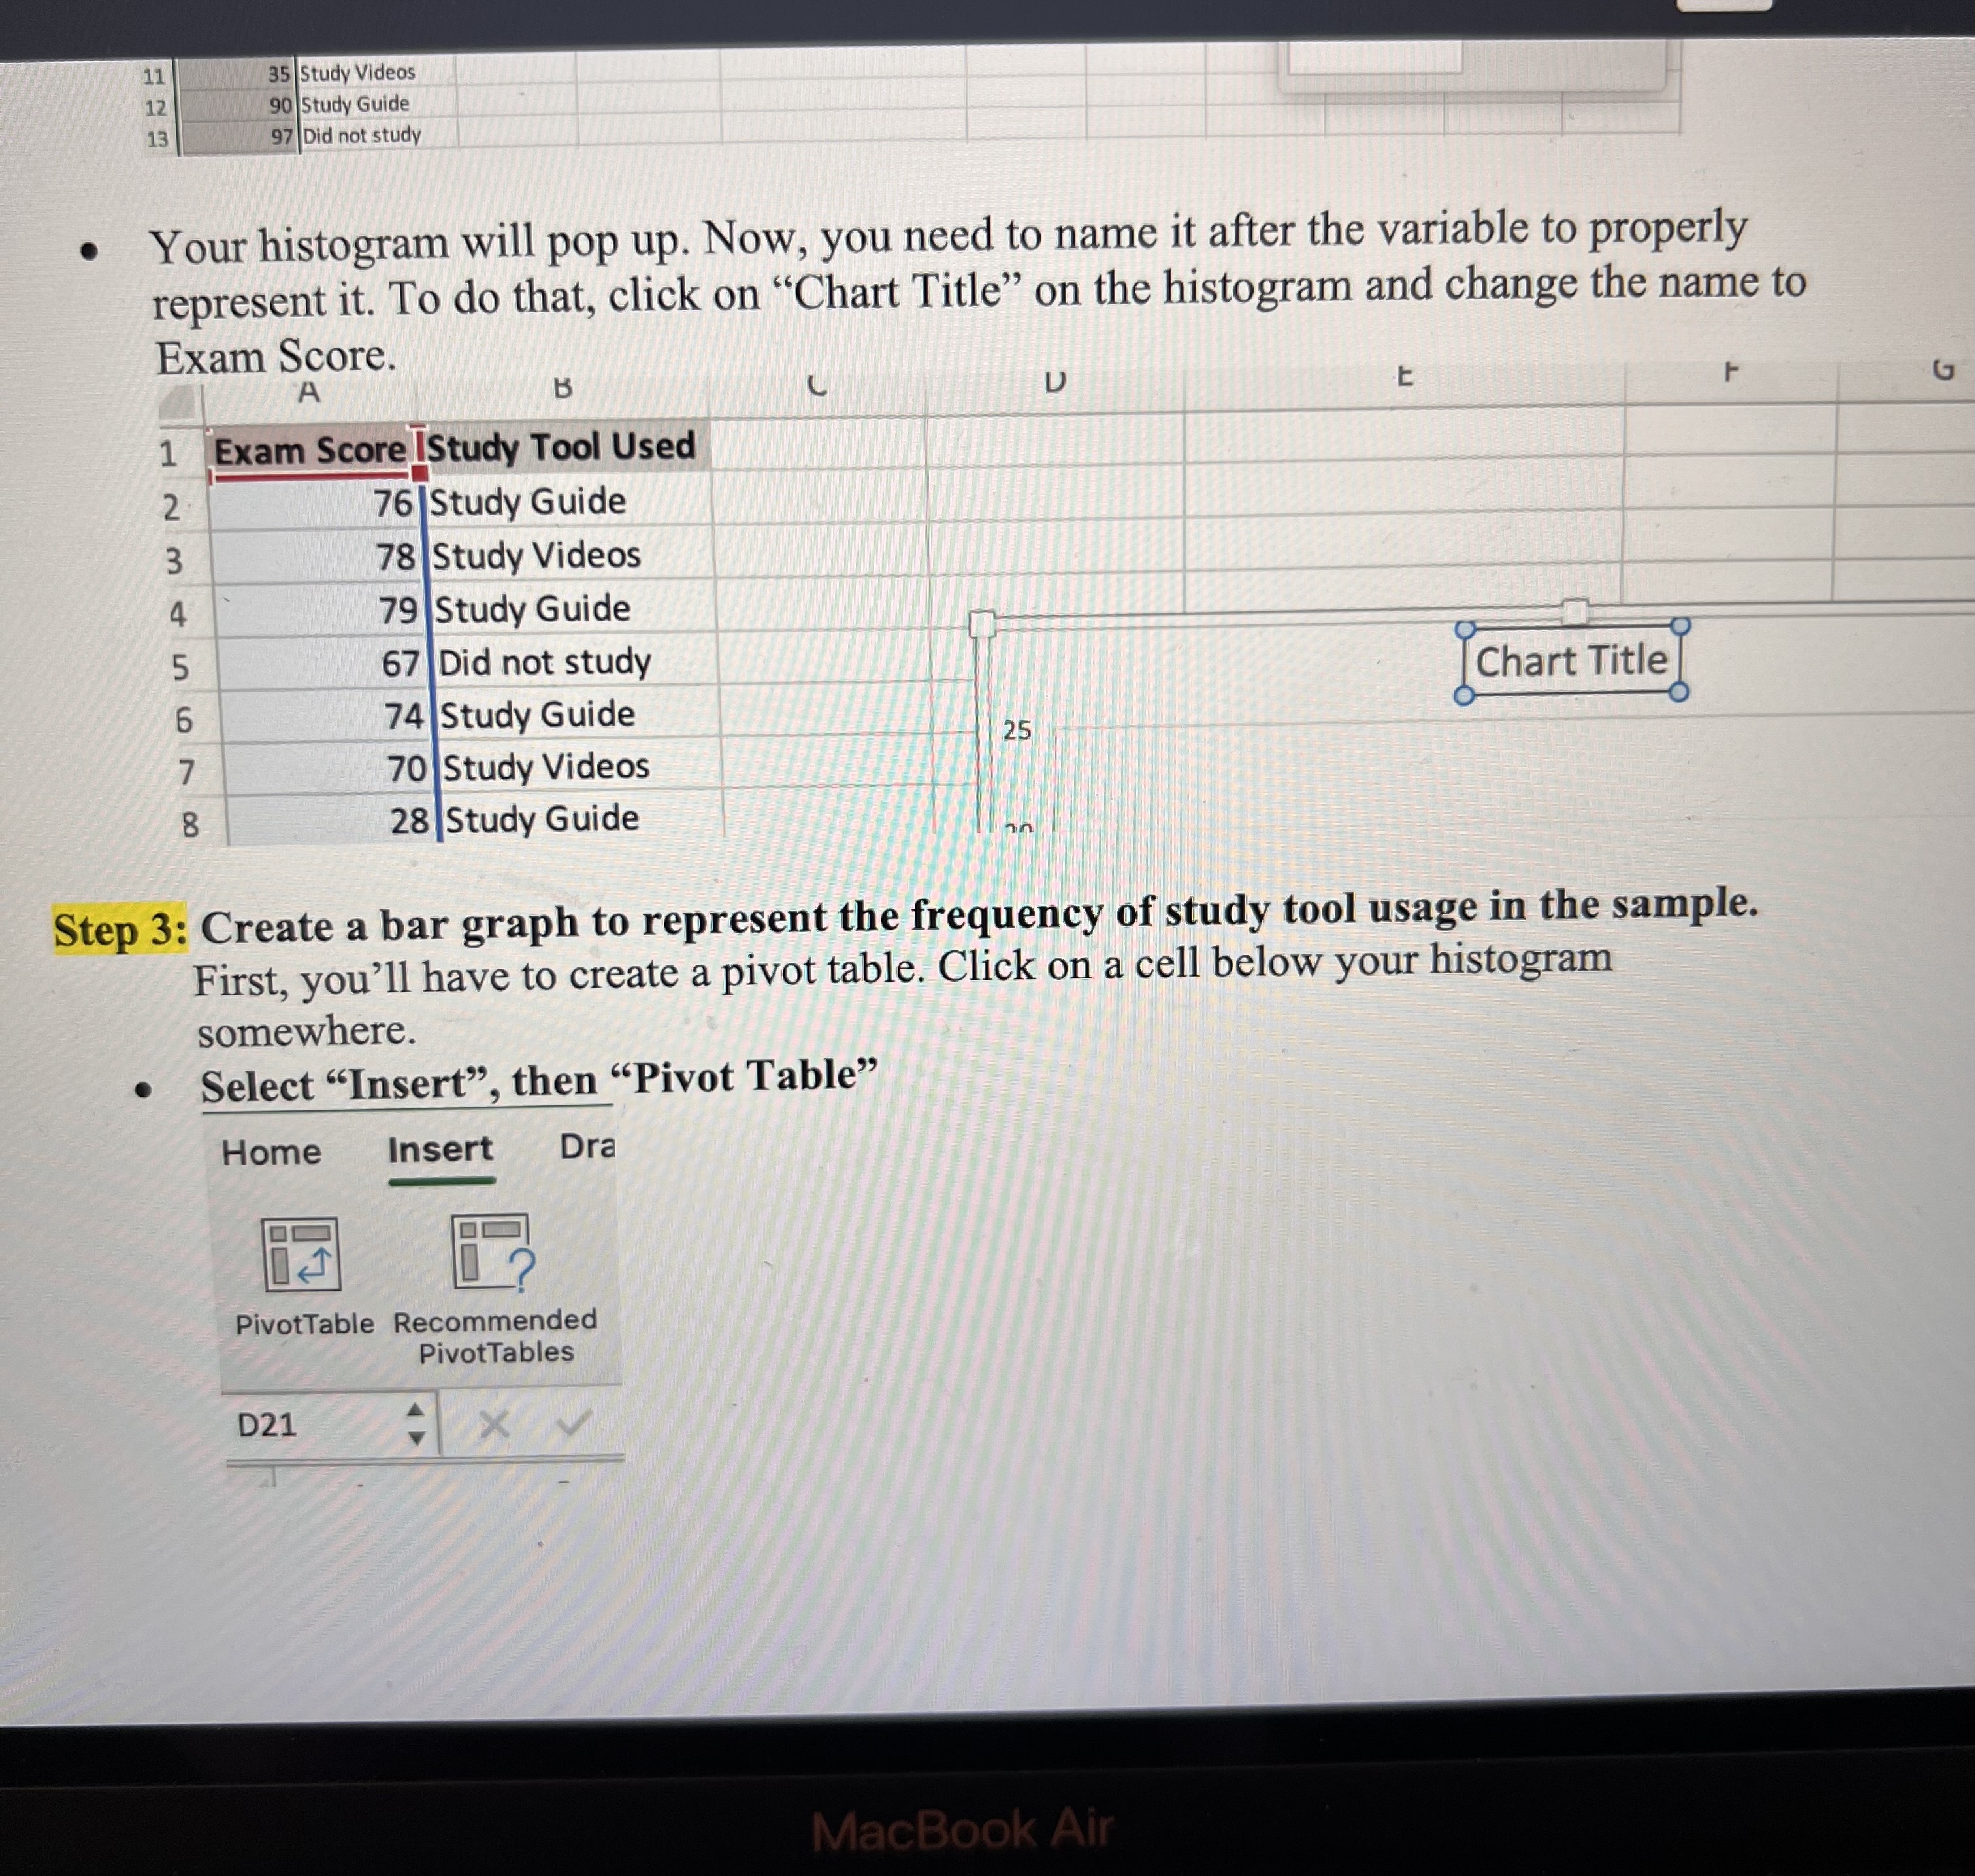
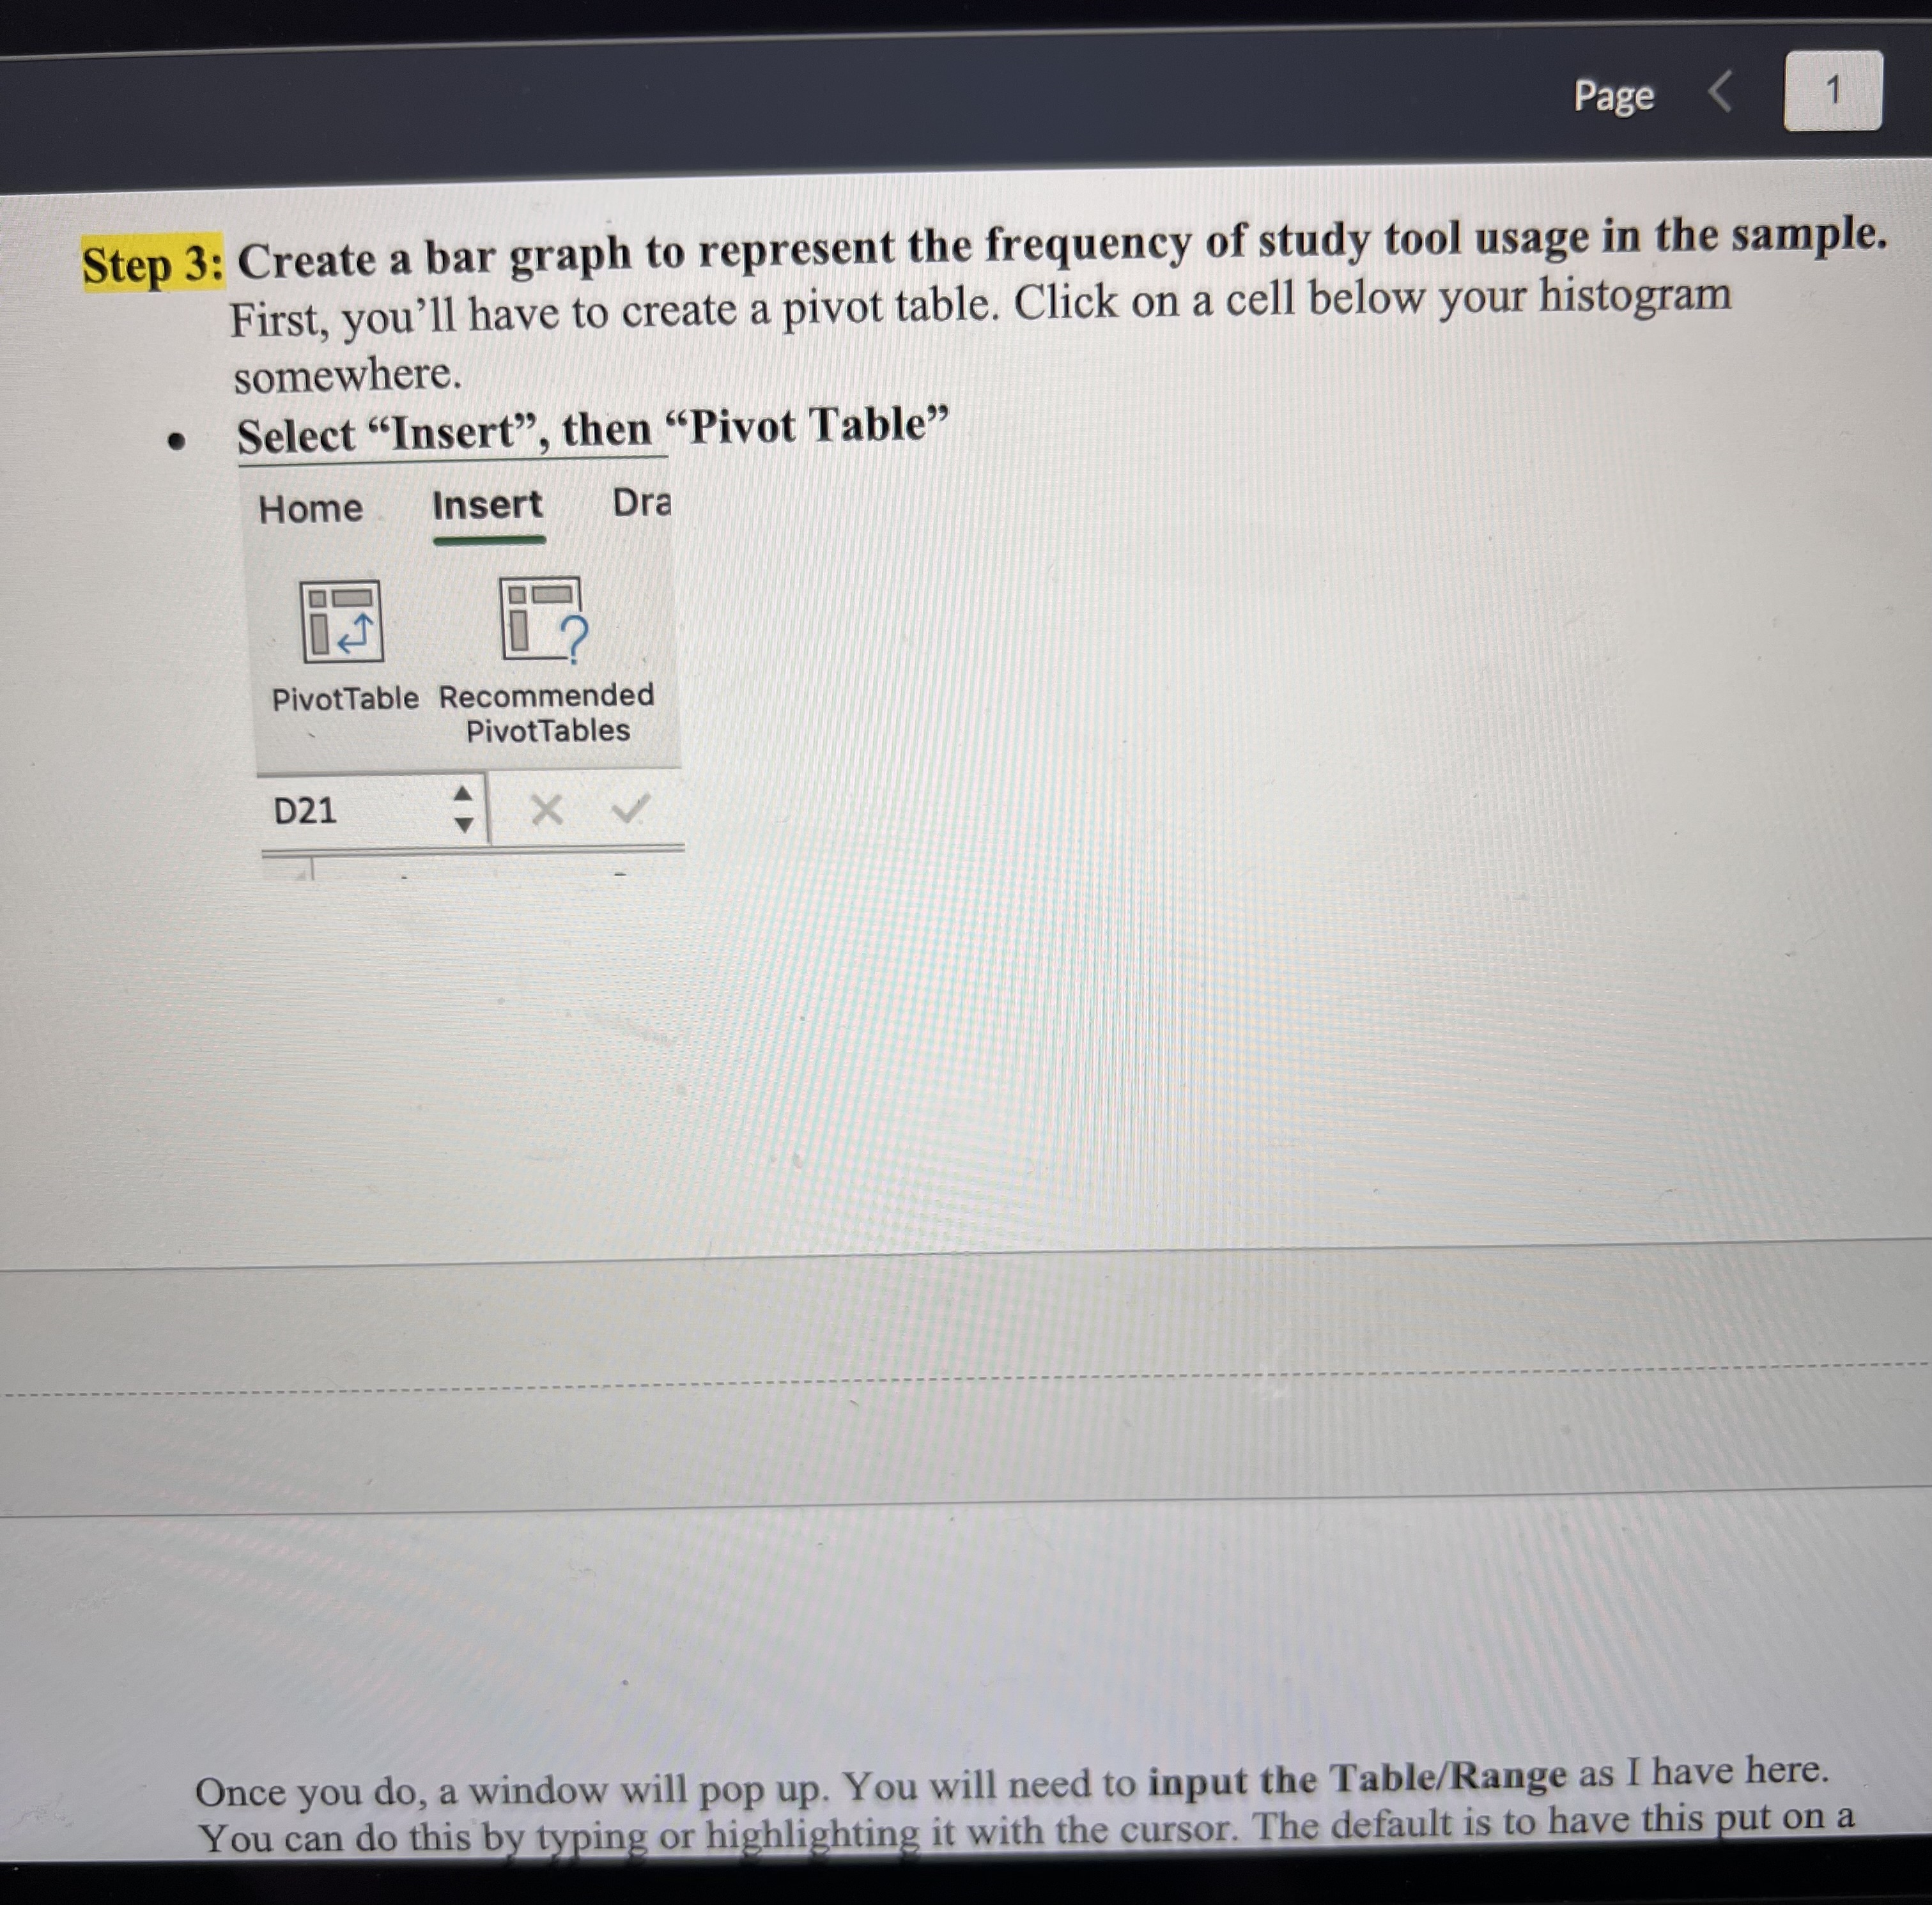
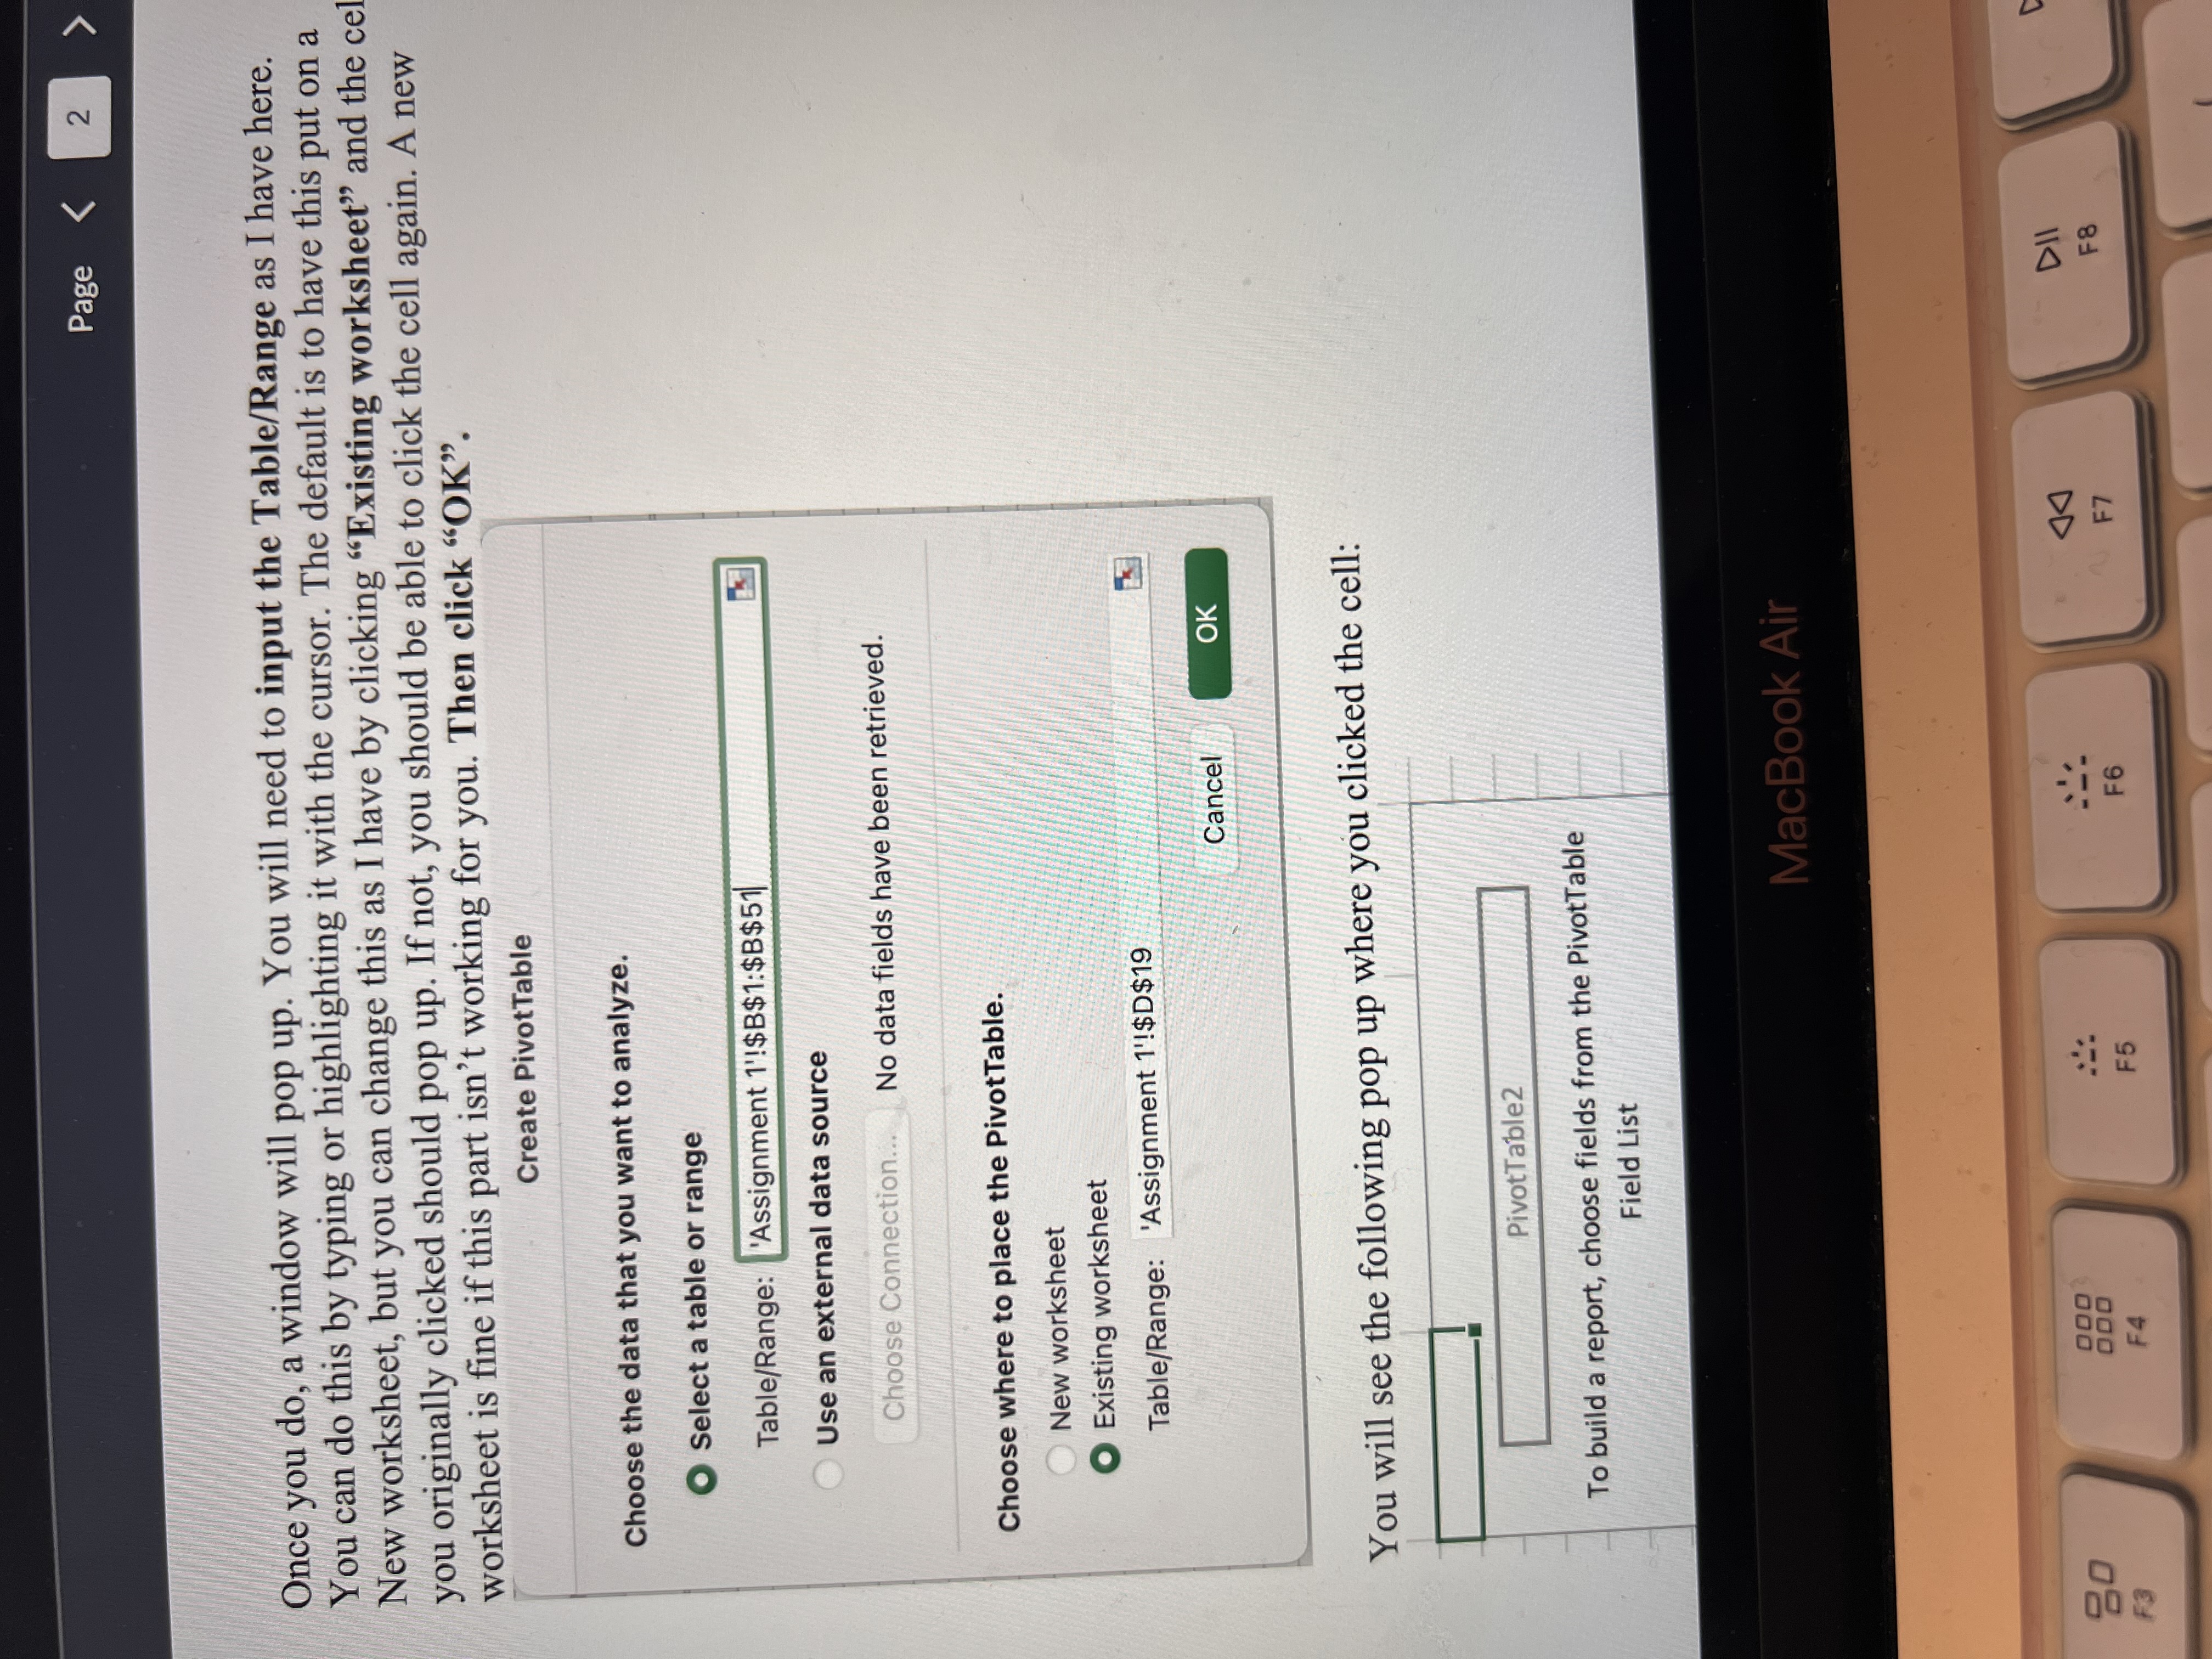
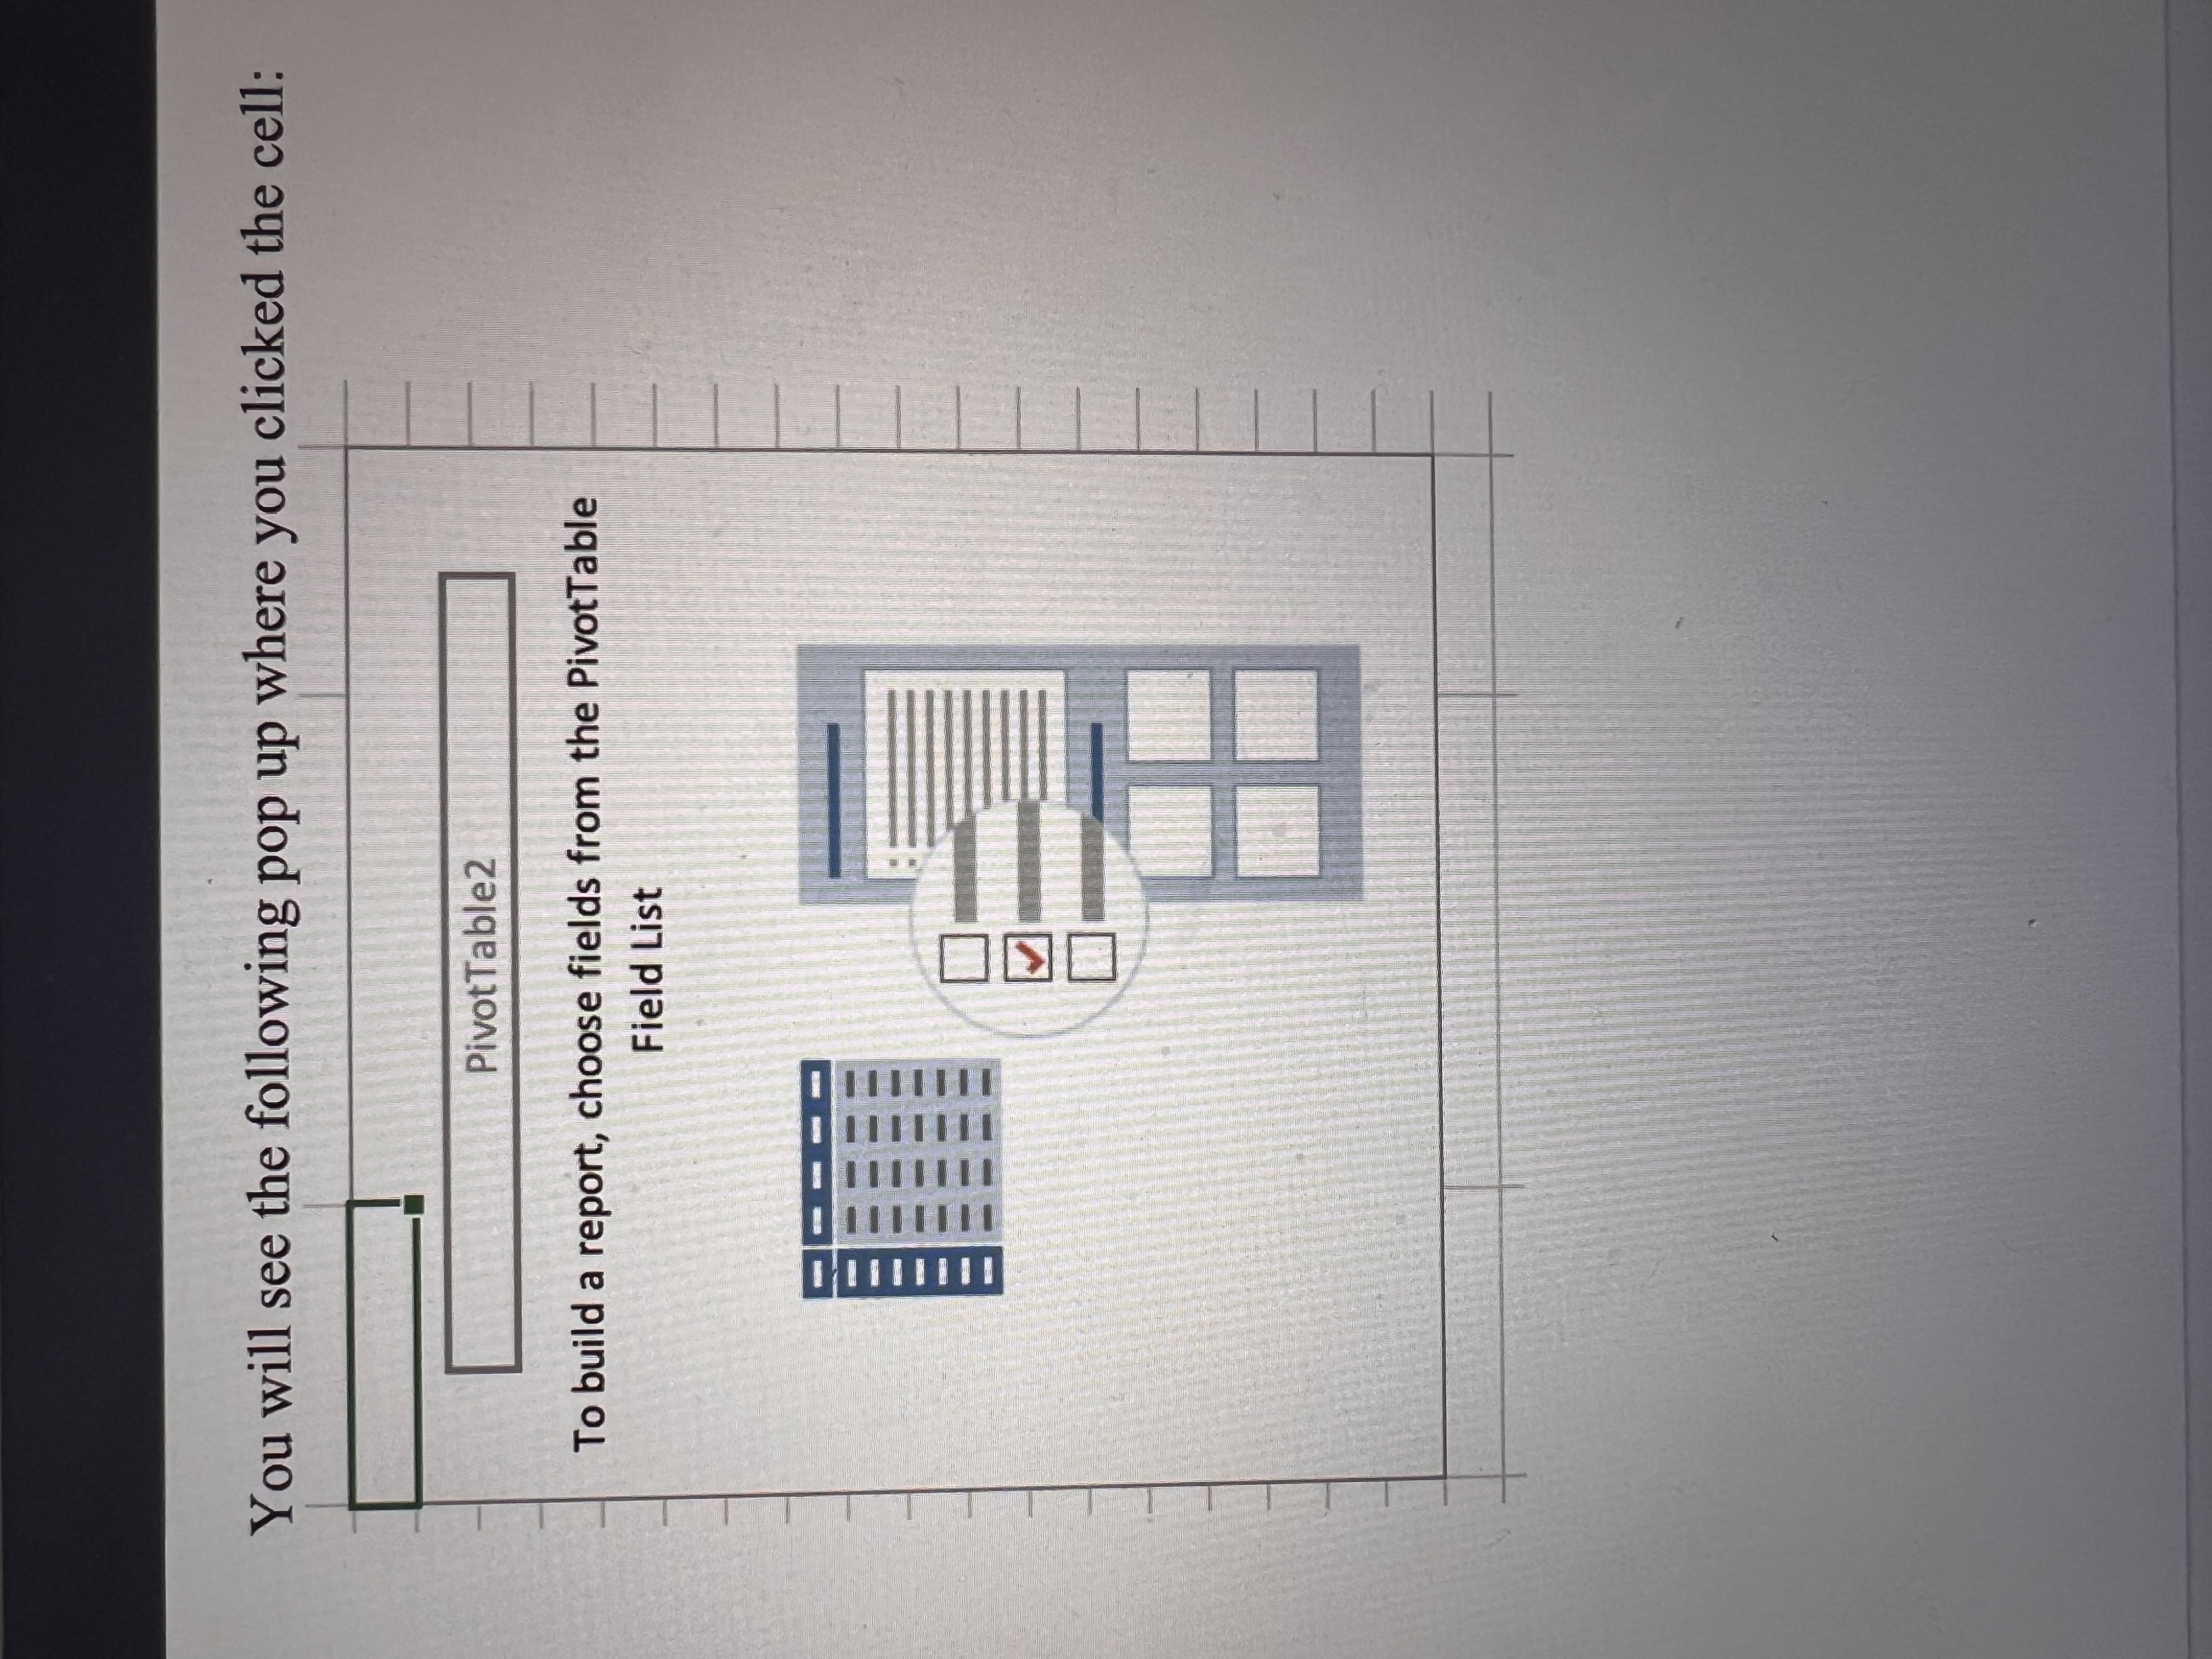
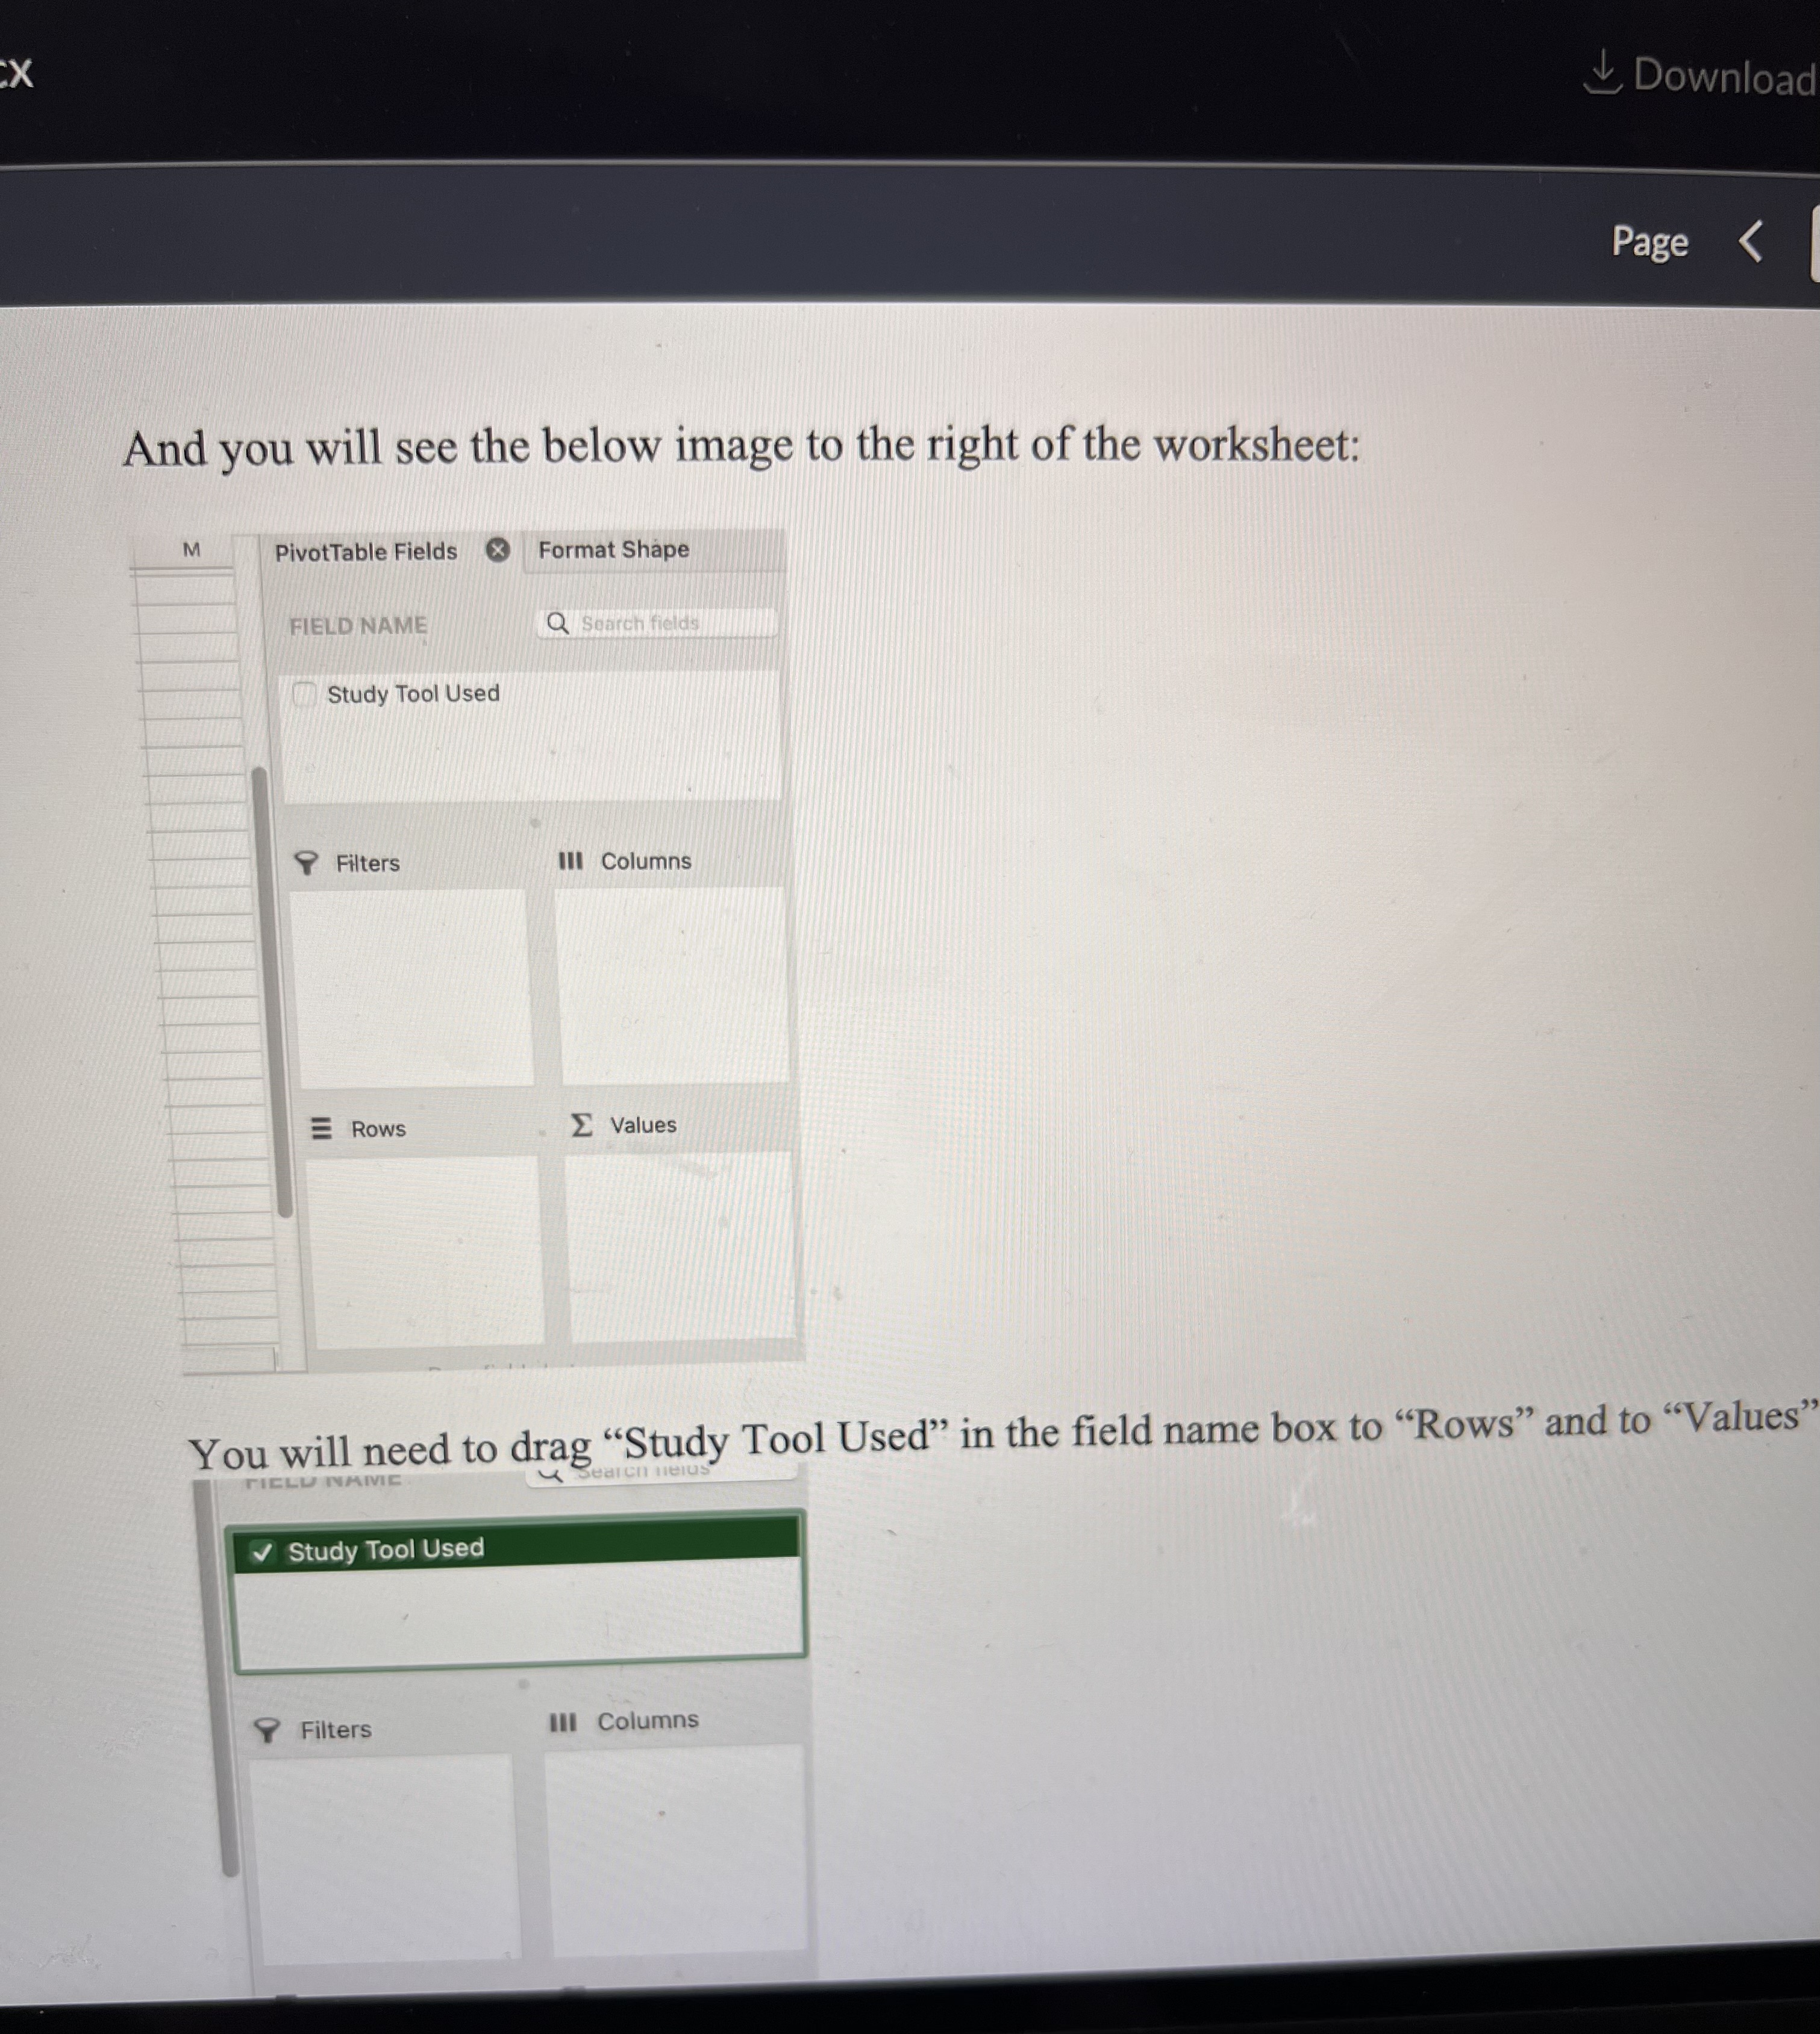
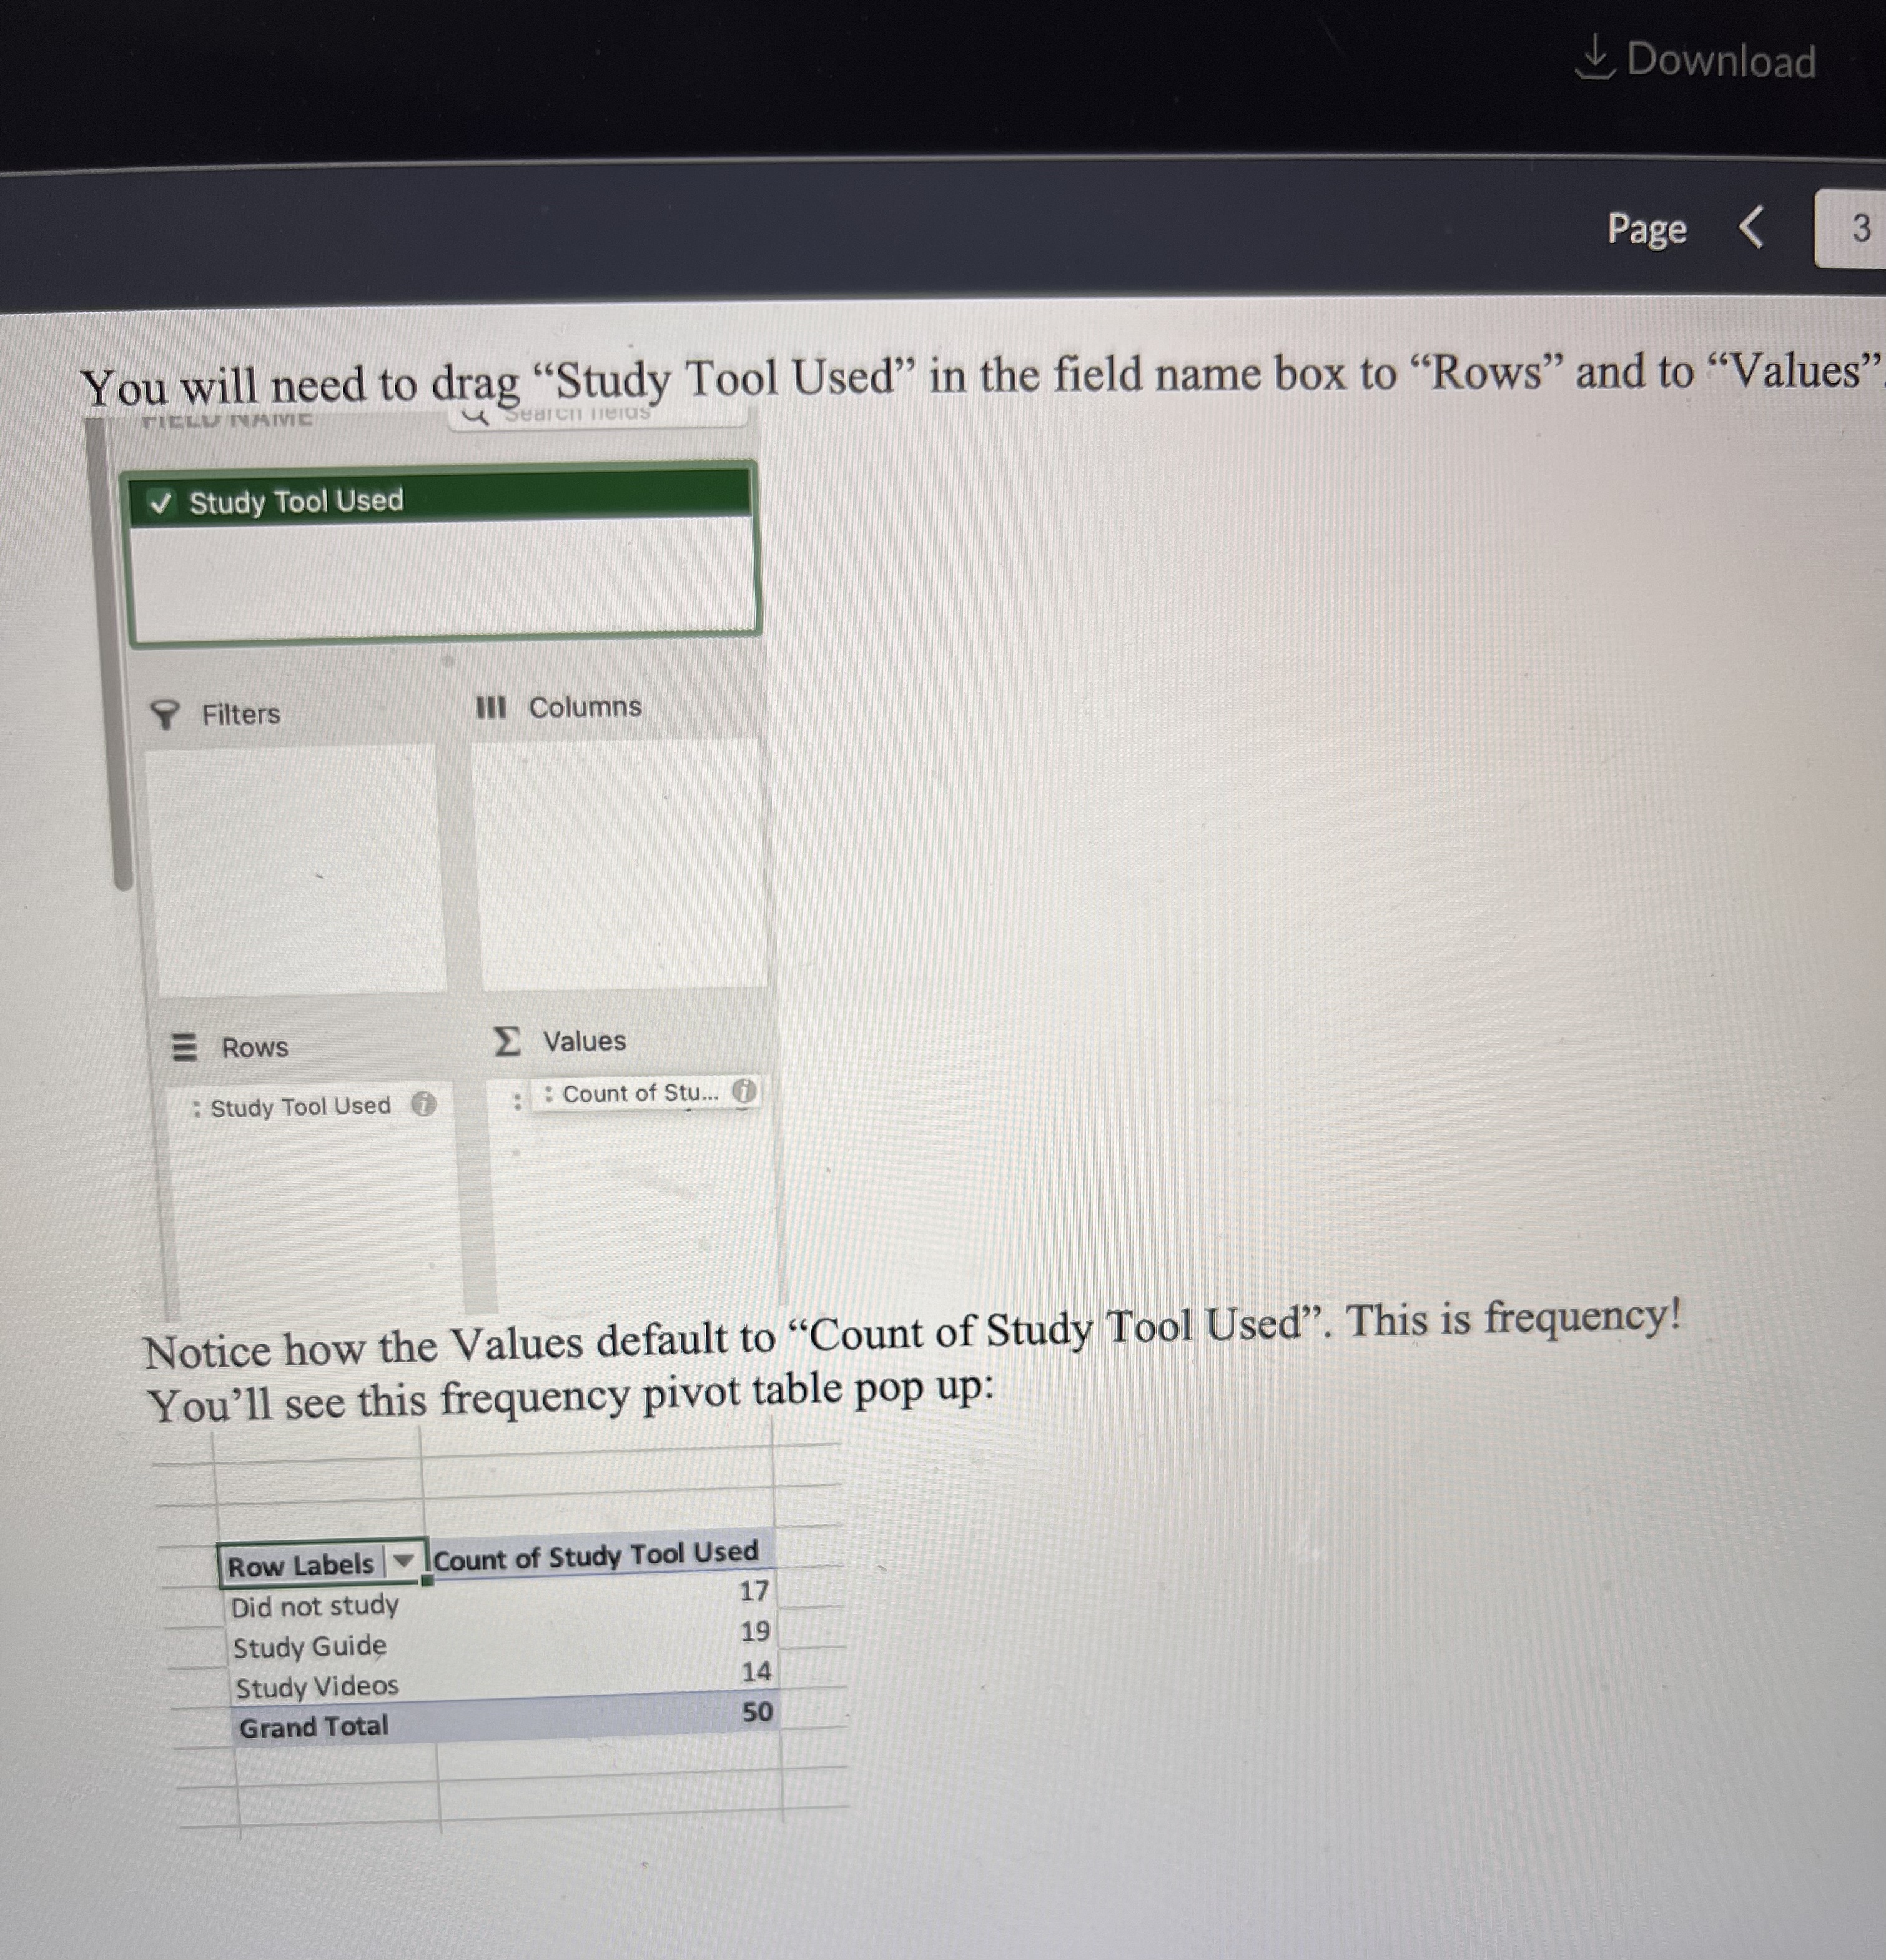
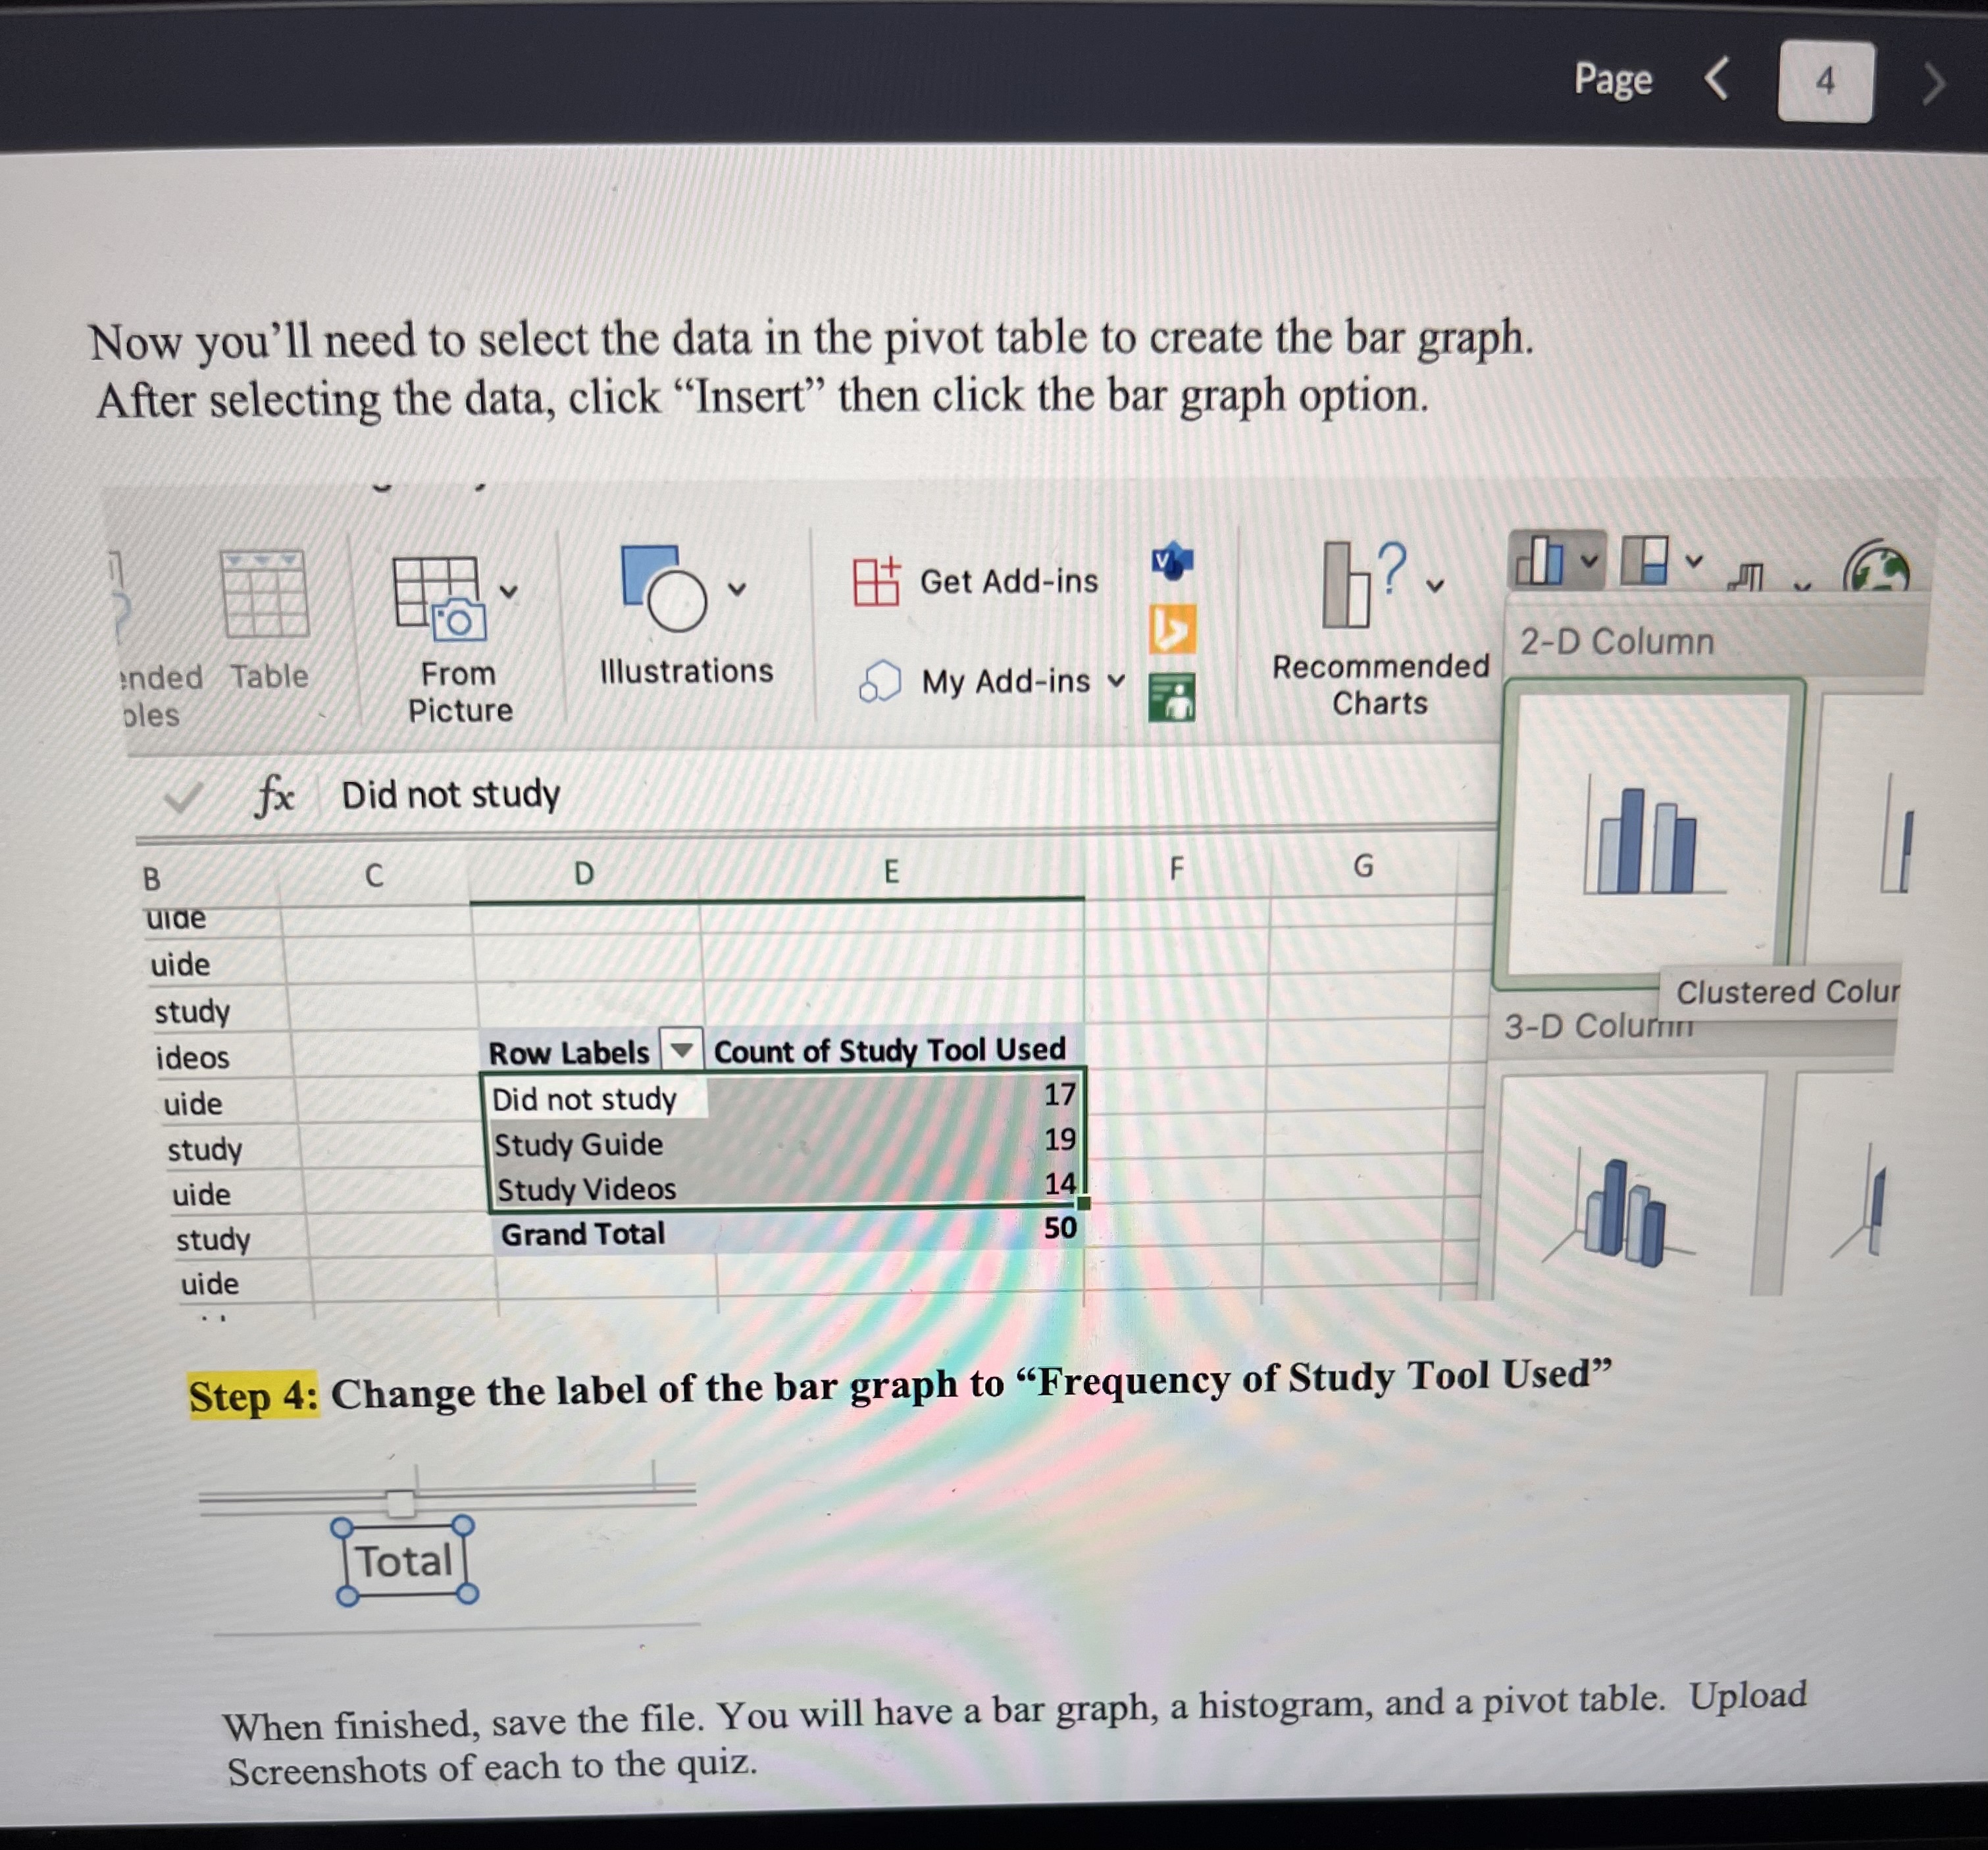
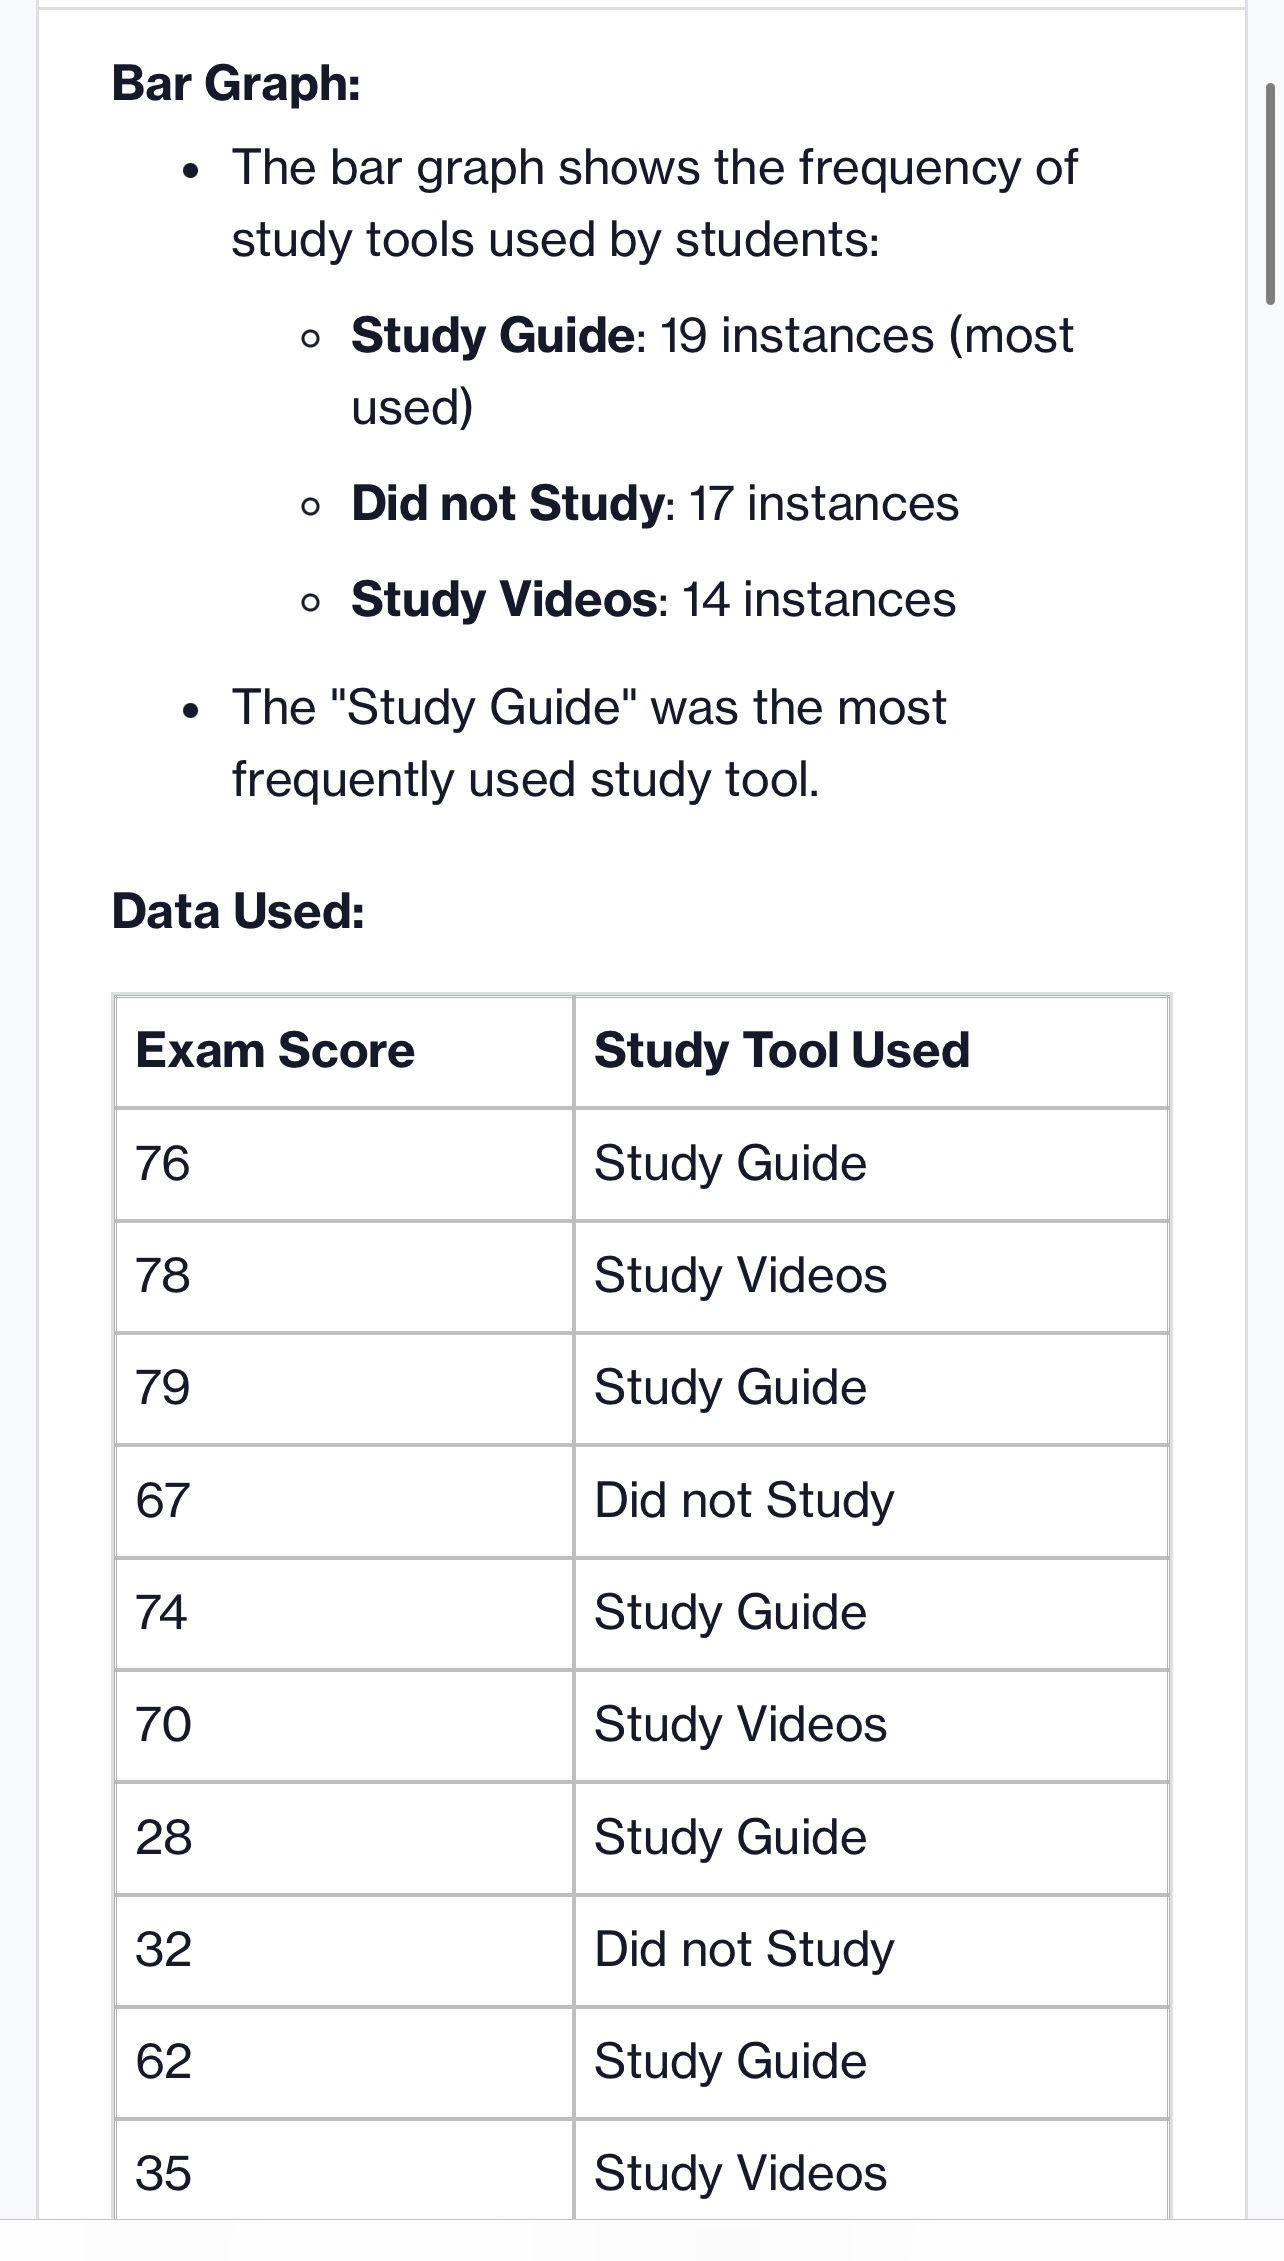
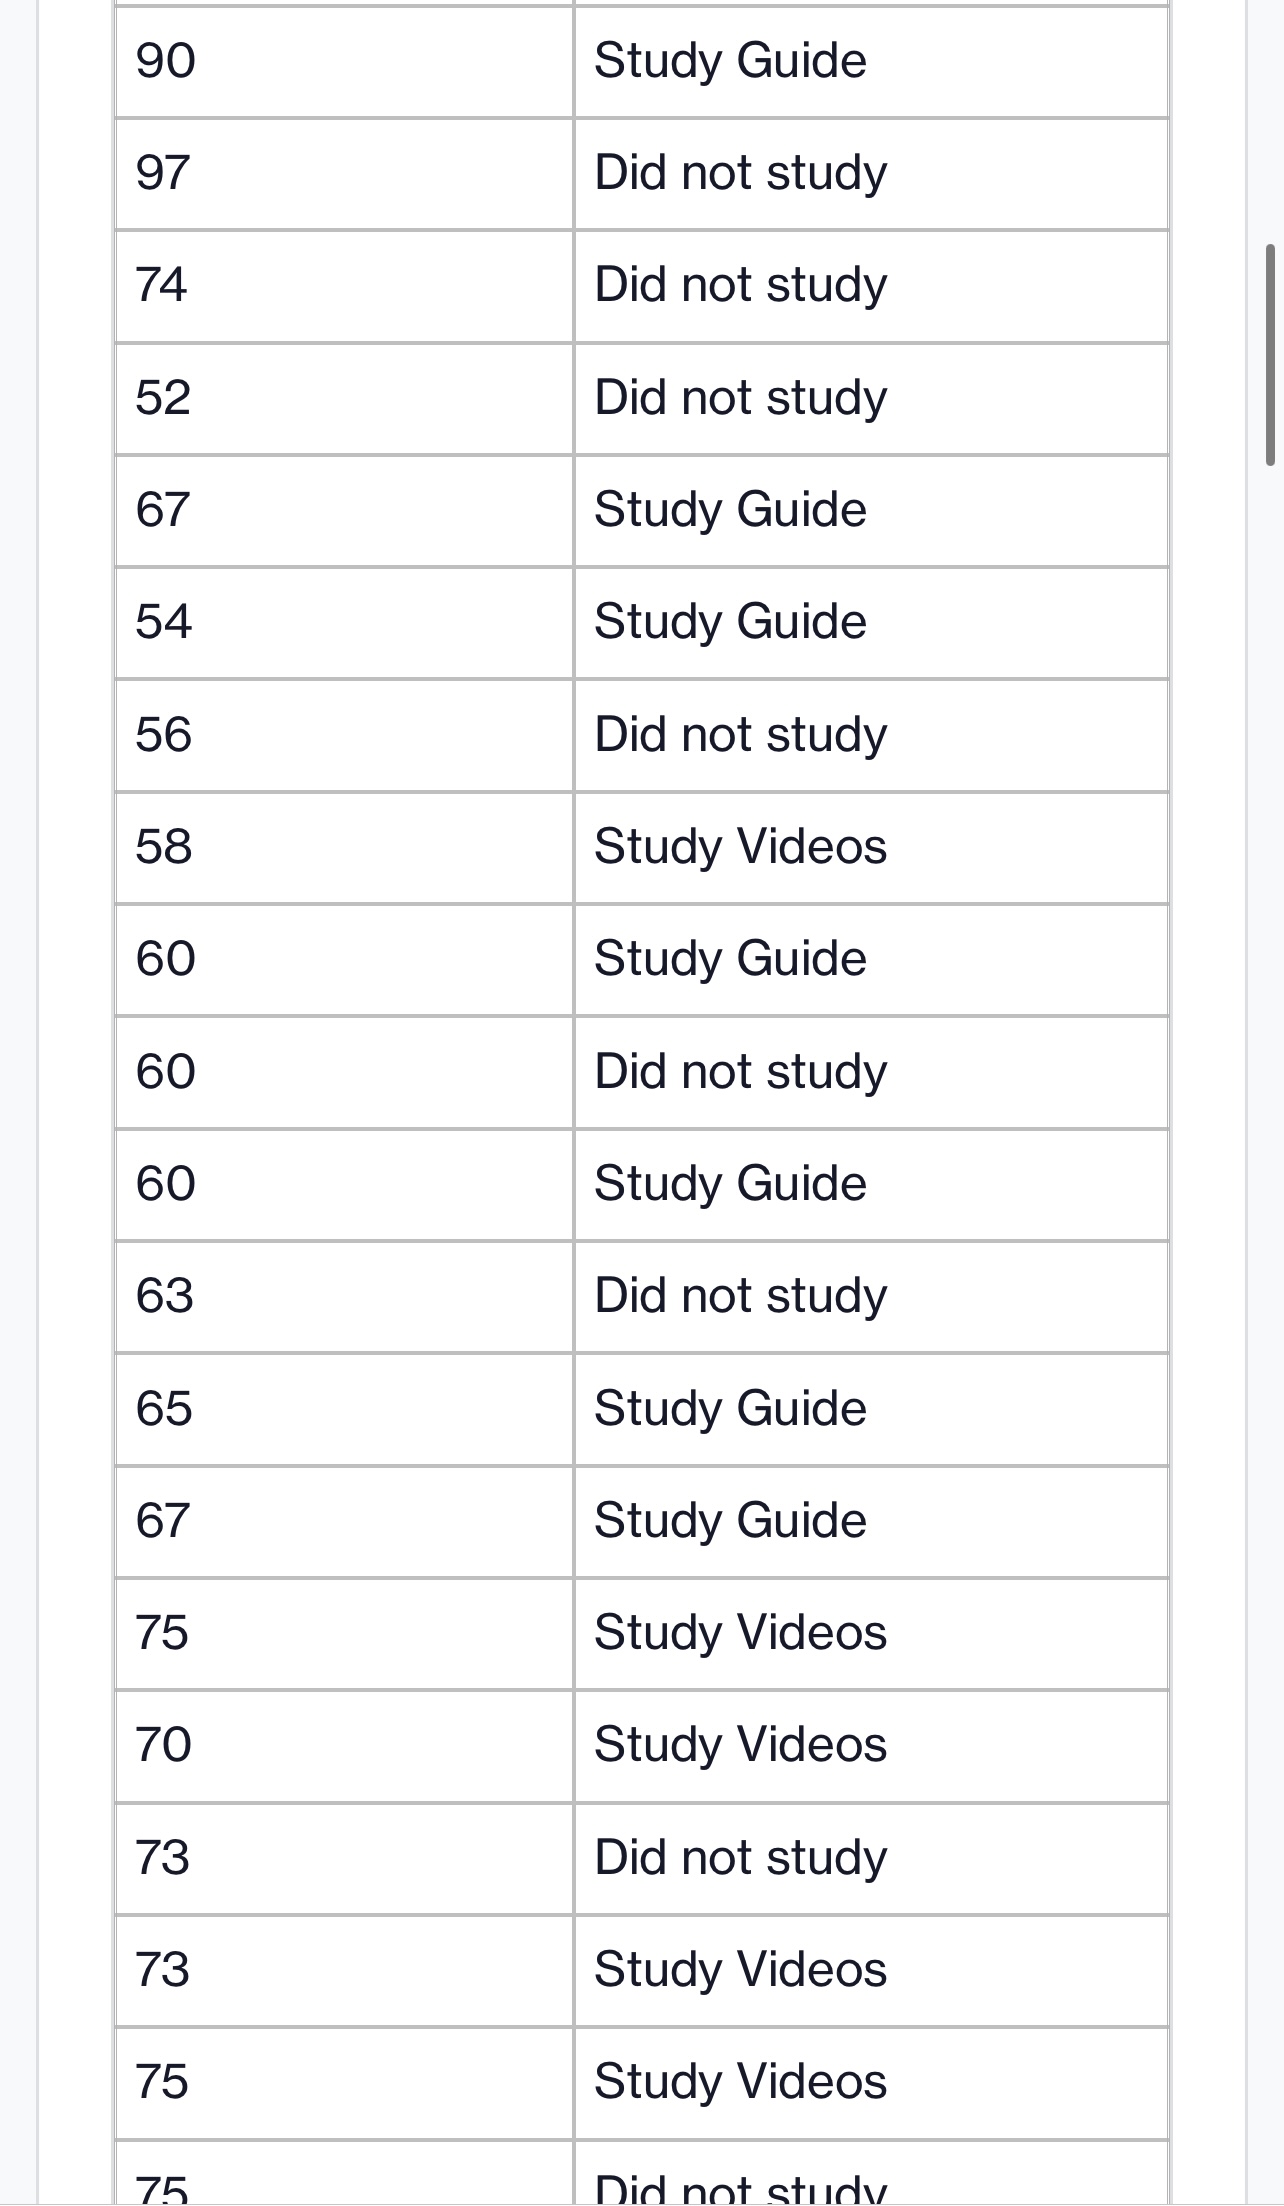
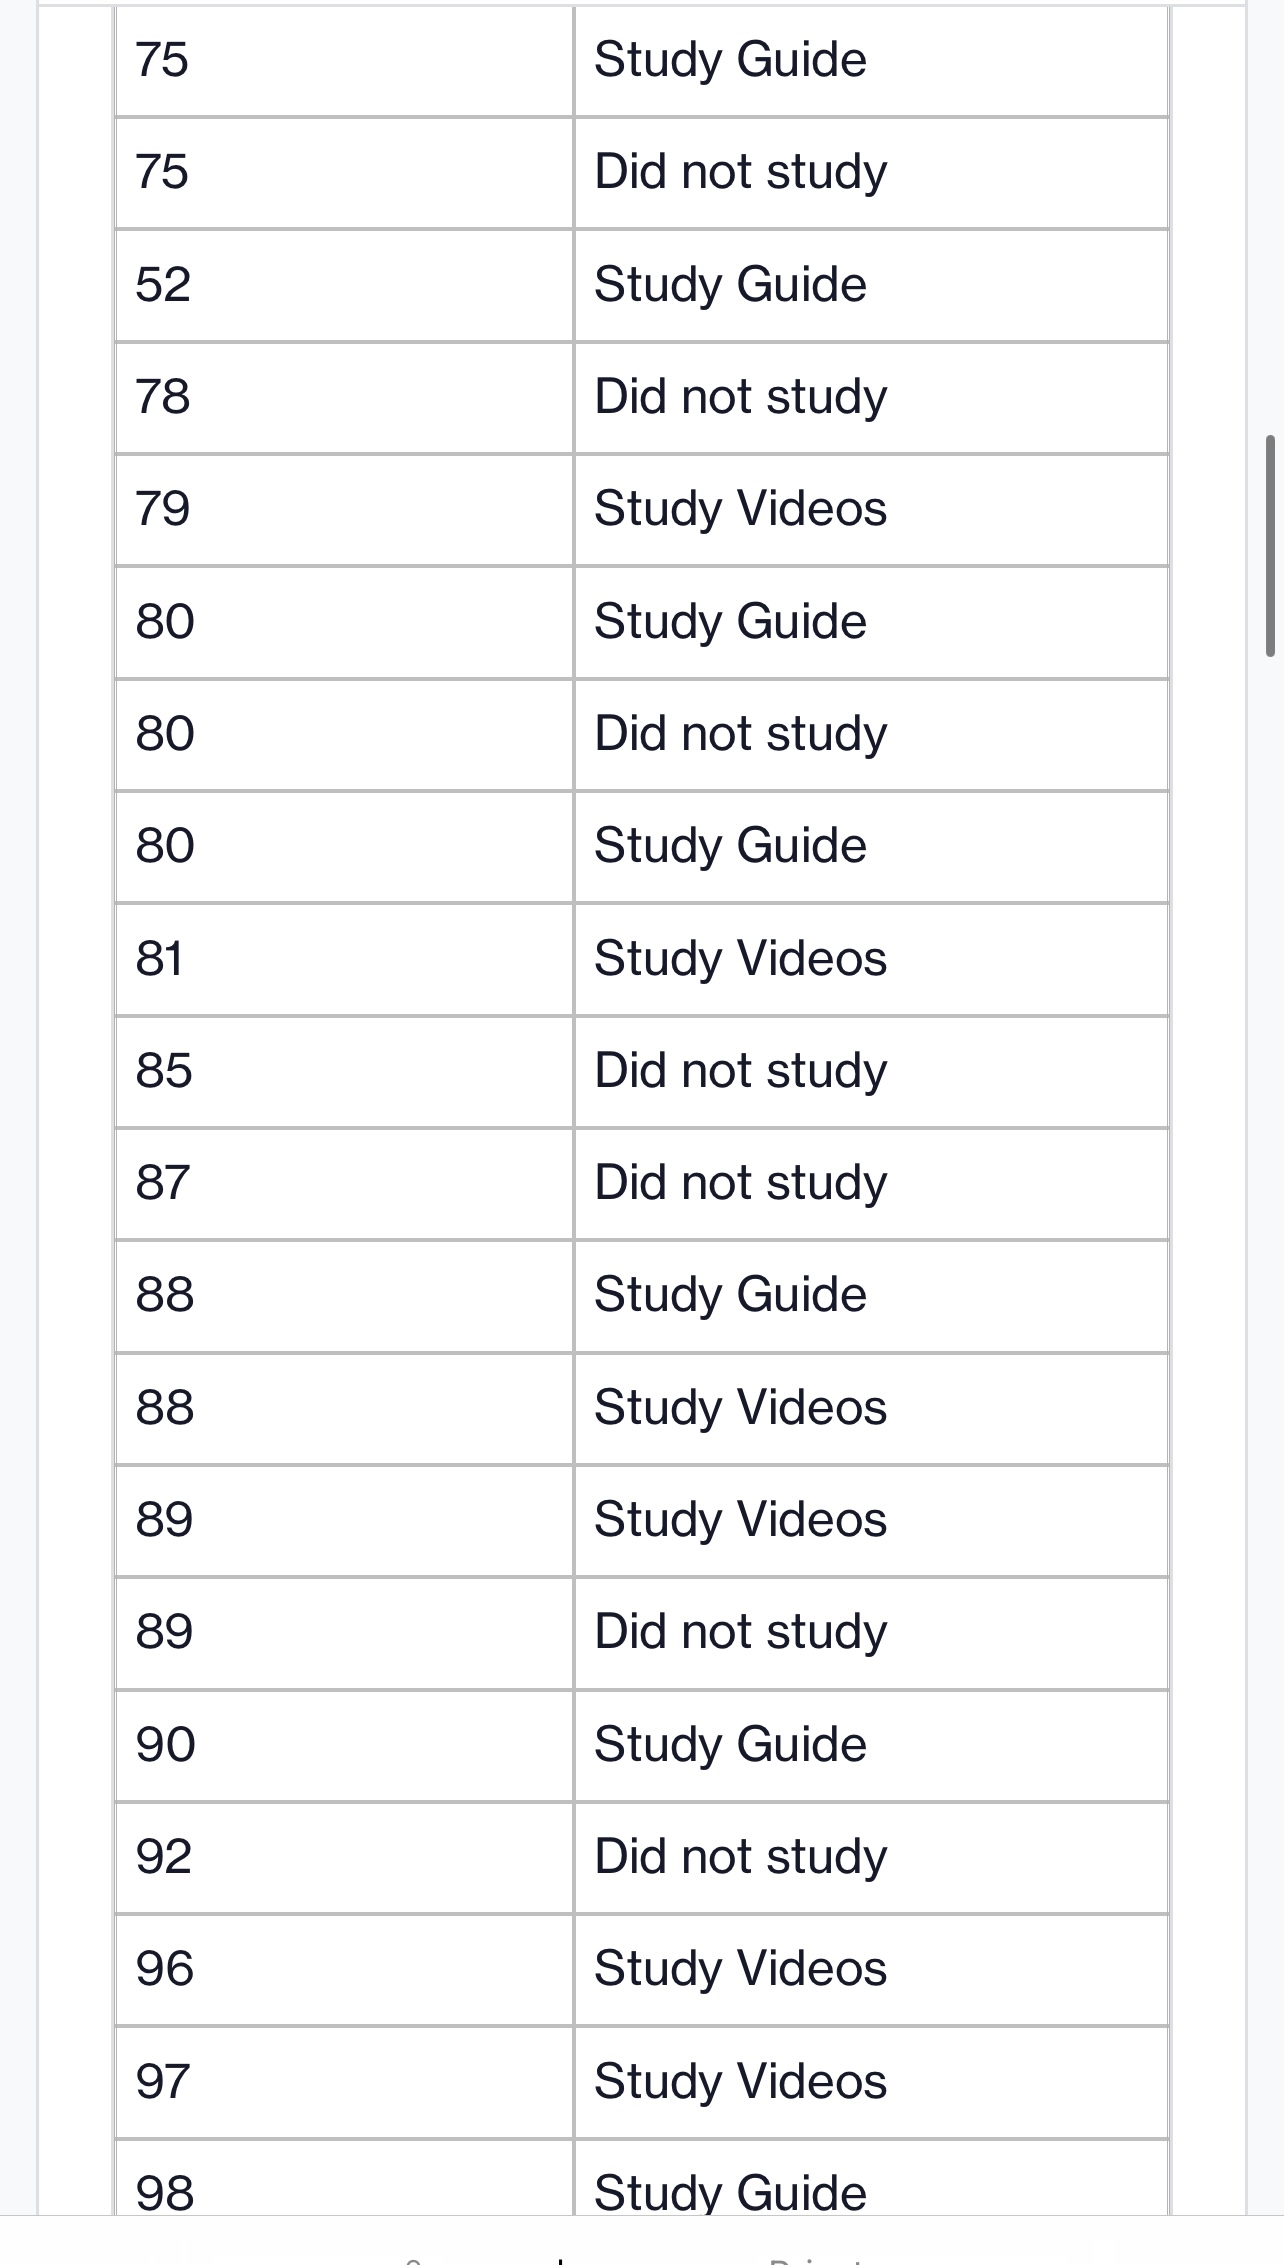
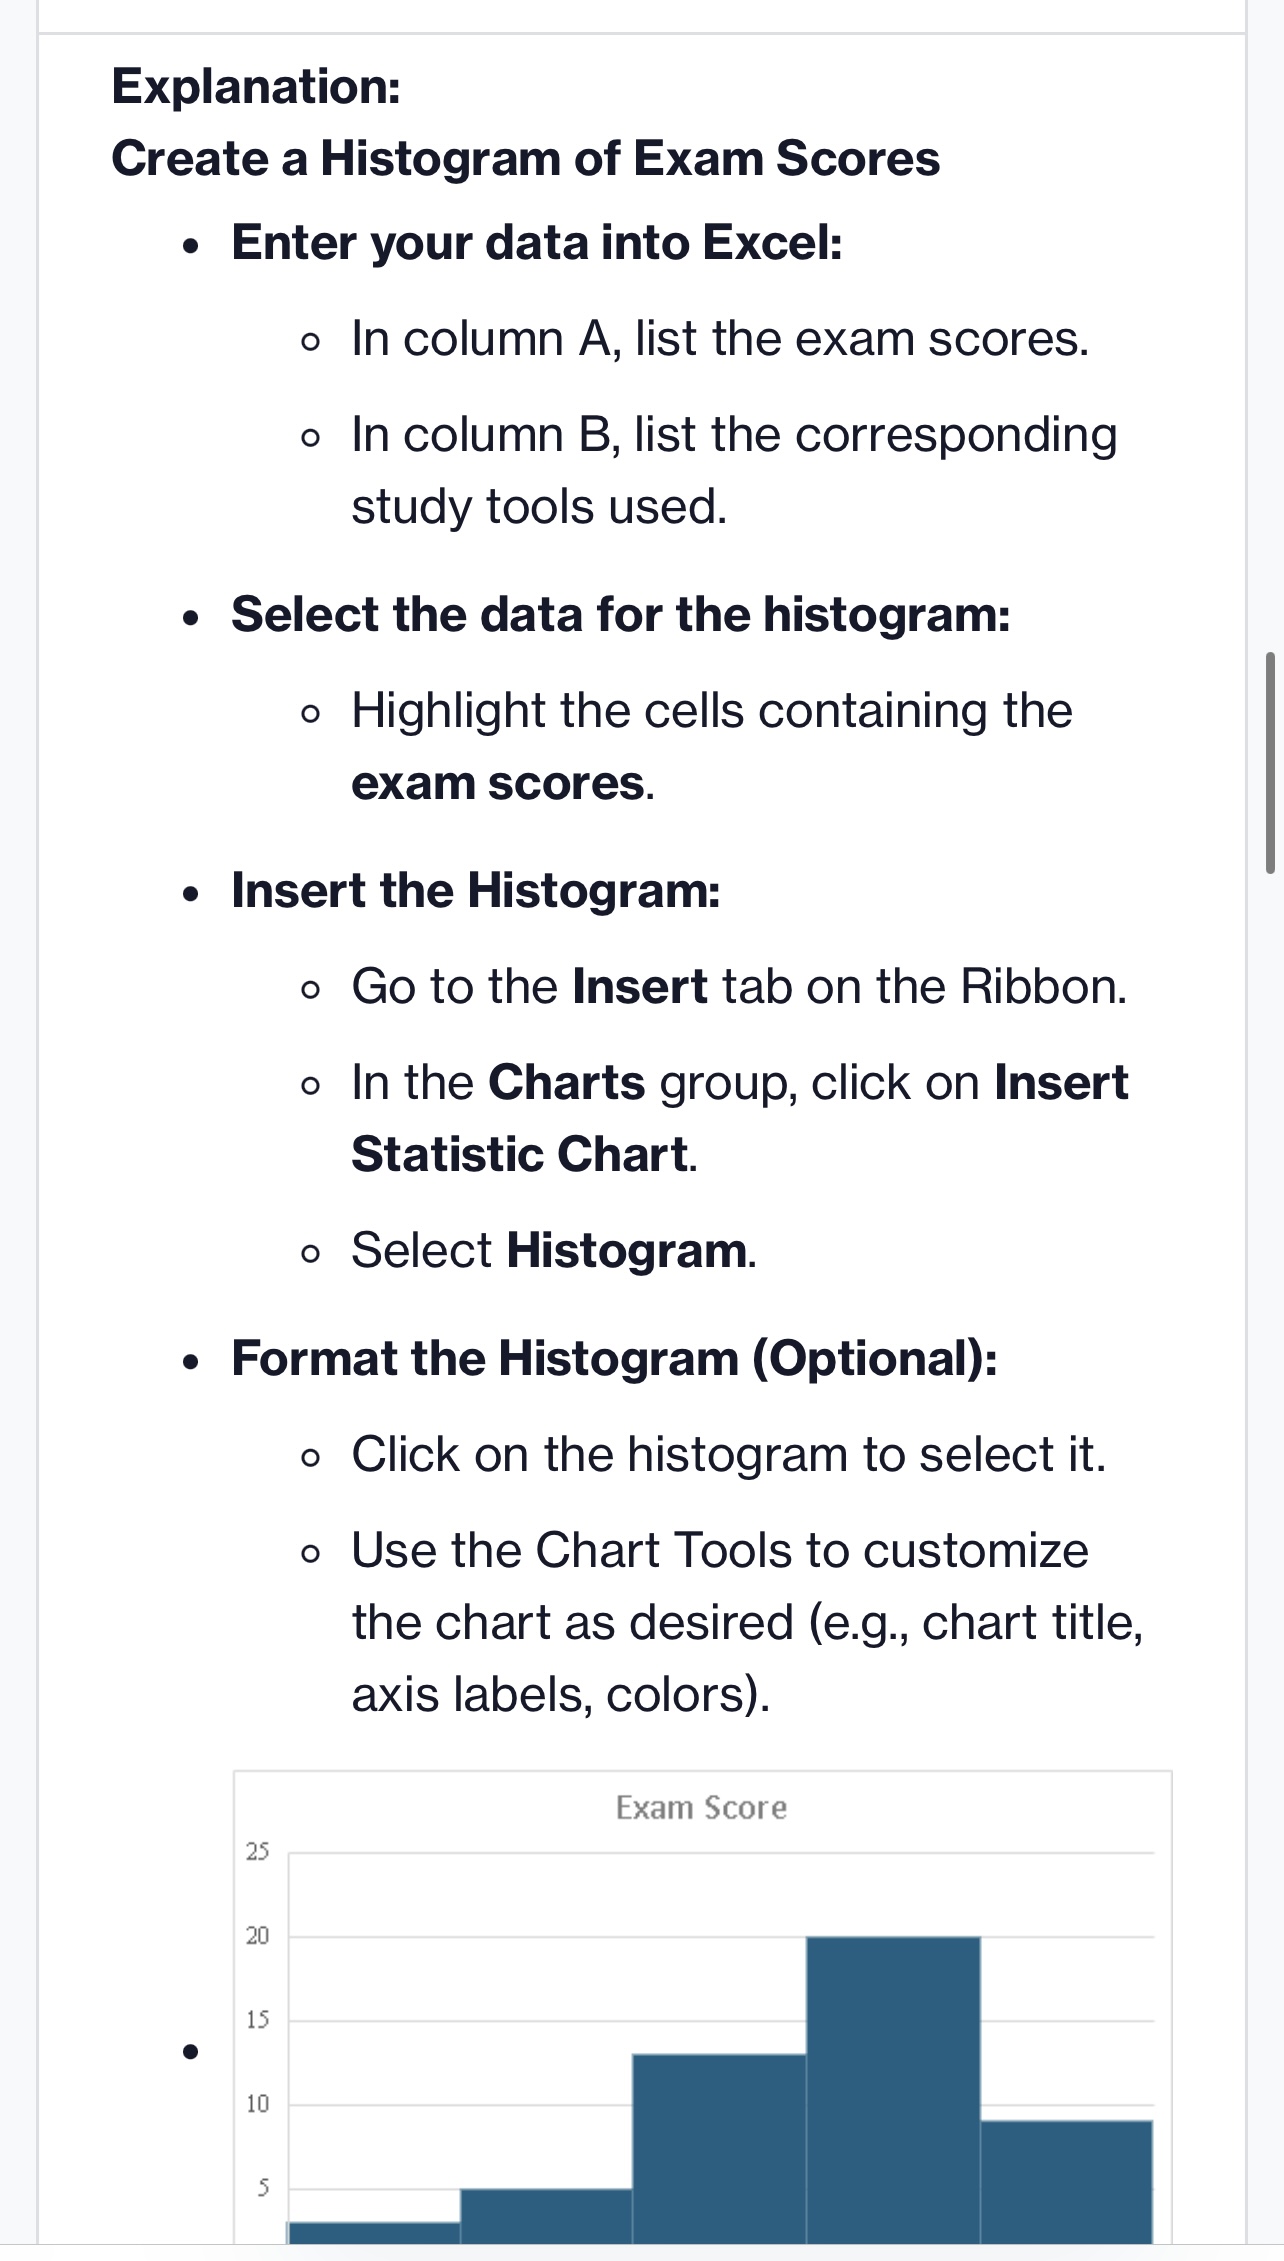
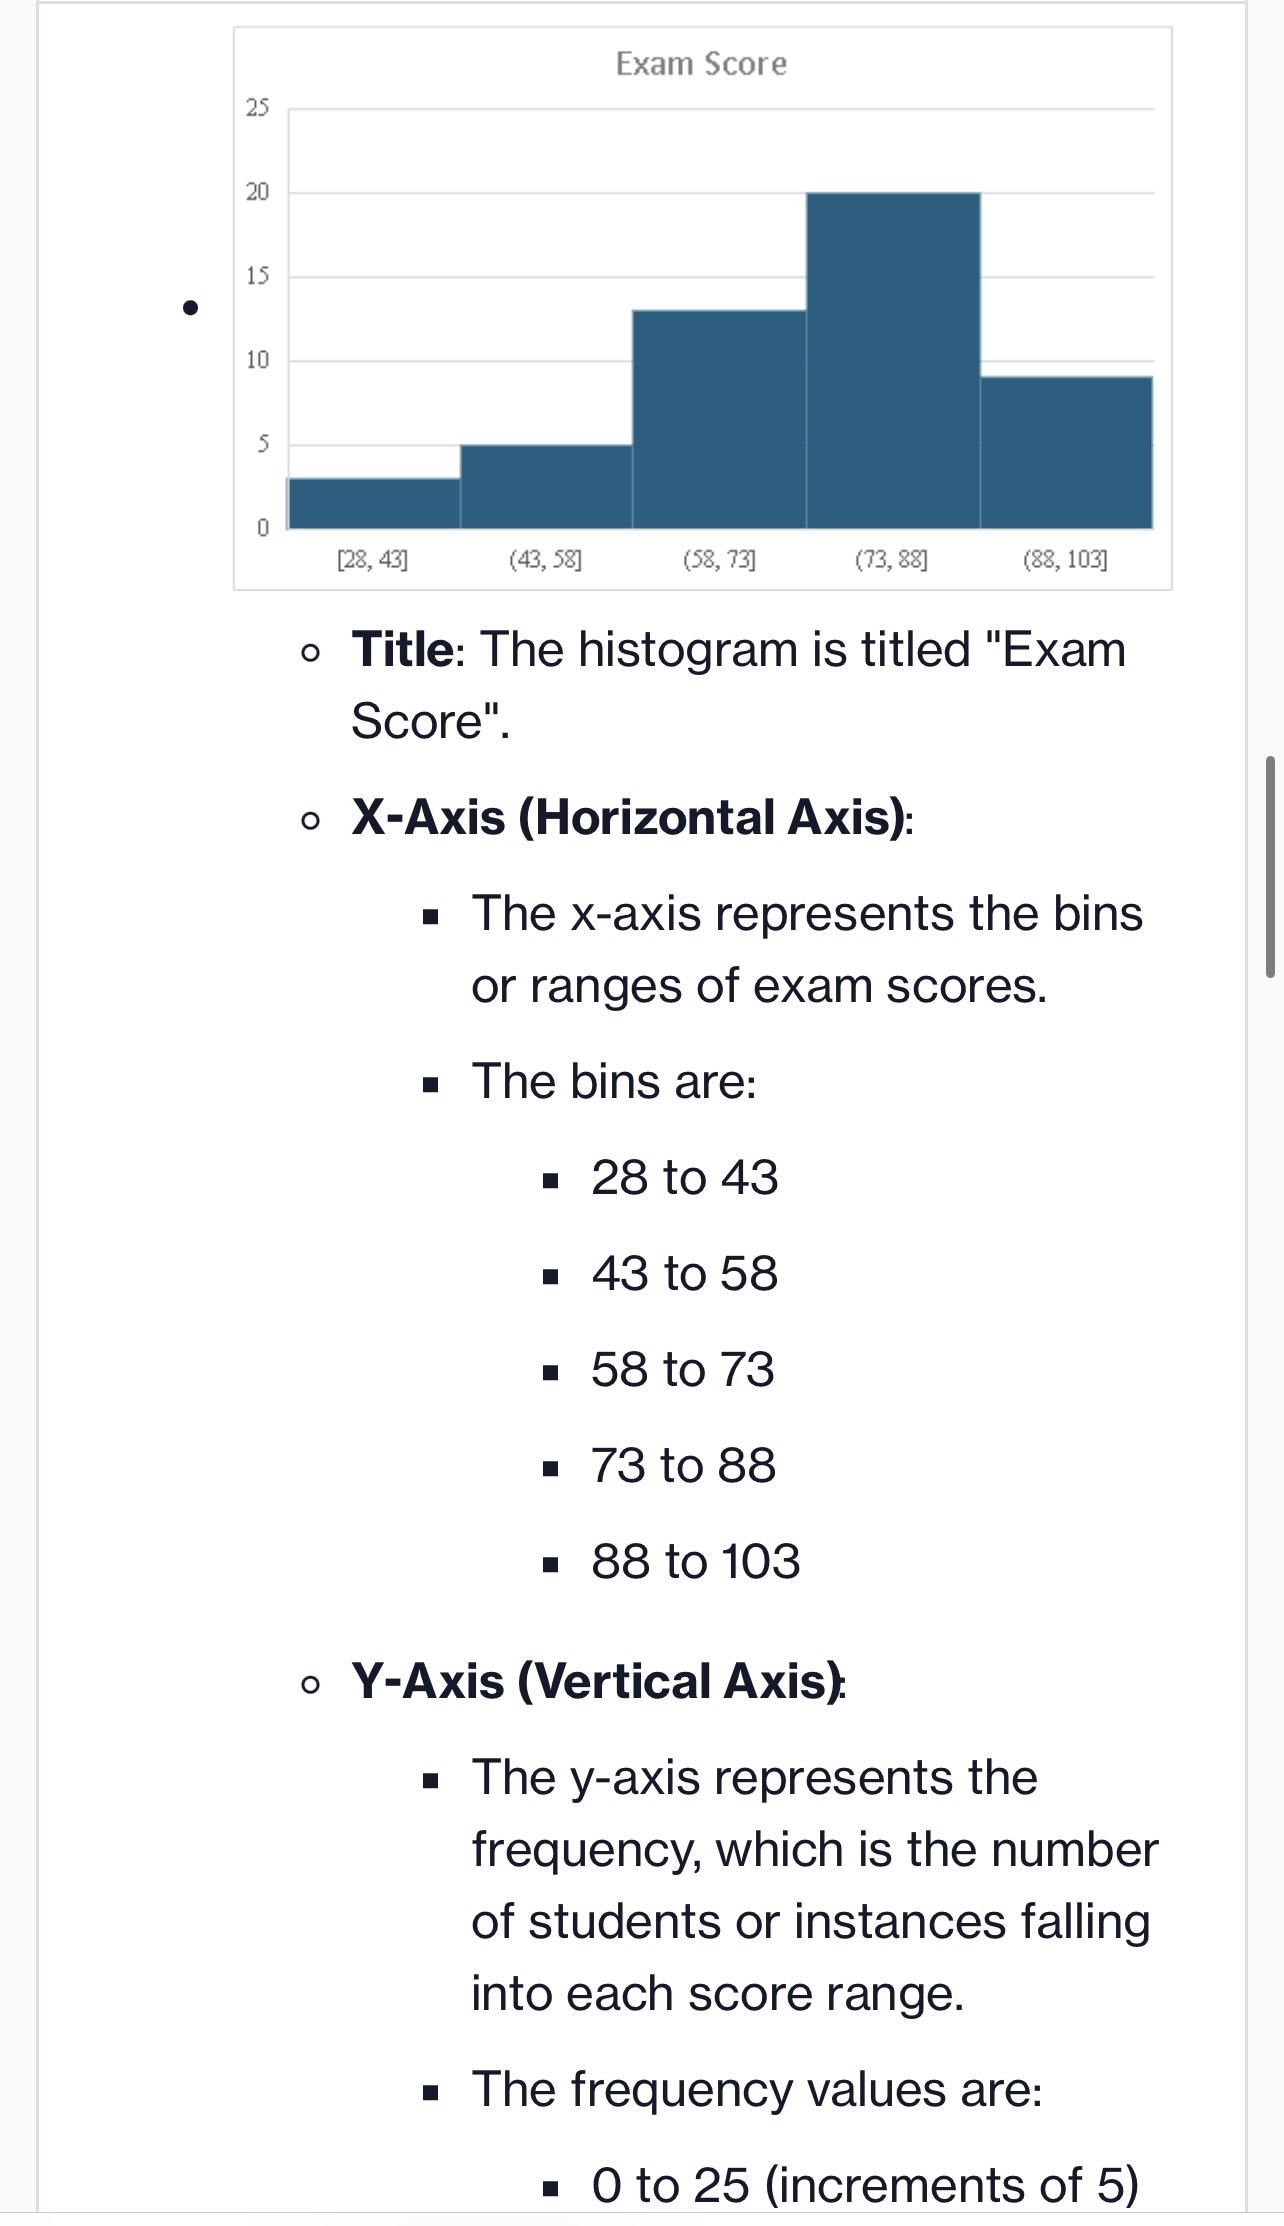
Page 1 Exam Score Study Tool Used 76 Study Guide 78 Study Videos 79 Study Guide 67 Did not study 74 Study Guide 70 Study Videos 28 Study Guide 32 Did not study 62 Study Guide 35 Study Videos 90 Study Guide 97 Did not study 74 Did not study 52 Did not study 67 Study Guide 54 Study Guide 56 Did not study 58 Study Videos 60 Study Guide 60 Did not study 60 Study Guide 63 Did not study 65 Study Guide 67 Study Guide 75 Study VideosPage 75 Study Videos 70 Study Videos 73 Did not study 73 Study Videos 75 Study Videos 75 Did not study 75 Study Guide 75 Did not study 52 Study Guide 78 Did not study 79 Study Videos 80 Study Guide 80 Did not study 80 Study Guide 81 Study Videos 85 Did not study 87 Did not study 88 Study Guide88 Study Videos 89 Study Videos 89 Did not study 90 Study Guide 92 Did not study 96 Study Videos 97 Study Videos 98 Study GuideStep 1: Download the Excel file. Step 2: Create a histogram of the Exam Score variable. . Select all of the data in the Exam Score column. Select "Insert", then click the Histogram in the chart options. Home Insert Draw Page Layout Formulas Data Review View Automate Acrobat 9 Tell me Get Add-ins tet PivotTable Recommended Table From Illustrations 5 My Add-ins v Recommended pa PivotTables Picture Charts Histogram A1 X V fx Exam Score A B G 1 Exam Score Study Tool Used 76 Study Guide 78 Study Videos Histogram 79 Study Guide Box and Whisker DO NOT UT D WN 67 Did not study 74 Study Guide 70 Study Videos 28 Study Guide 9 32 Did not study 10 62 Study Guide 35 Study Videos 90 Study Guide 97 Did not study . Your histogram will pop up. Now, you need to name it after the variable to properly represent it. To do that, click on "Chart Title" on the histogram and change the name Exam Score. A 1 Exam Score !Study Tool Used 76 Study Guide W N 78 Study Videos 79 Study Guide MacBook Air 000 DII F3 F4 F5 F6 F7 F835|Study Videos 90 |Study Guide 97 |Did not study Your histogram will pop up. Now, you need to name it after the variable to properly represent it. To do that, click on \"Chart Title\" on the histogram and change the name to Exam Score. A B U v E F '|Exam ScorelStudy Tool Used 2 76|Study Guide 3 78 |Study Videos 4 79|Study Guide 5 6 7 B 67 |Did not study | Chart Title 74 |Study Guide 4 - 70|Study Videos 28 |Study Guide [j2d Step 3: Create a bar graph to represent the frequency of study tool usage in the sample. First, you'll have to create a pivot table. Click on a cell below your histogram somewhere. e Select \"Insert\Page
Step by Step Solution
There are 3 Steps involved in it

Get step-by-step solutions from verified subject matter experts