Question: Page 1 Front Page Page 5 Thrift Segment Analysis Page 9 Market Share Page 2 Stocks & Bonds Page 6 Core Segment Analysis Page 10
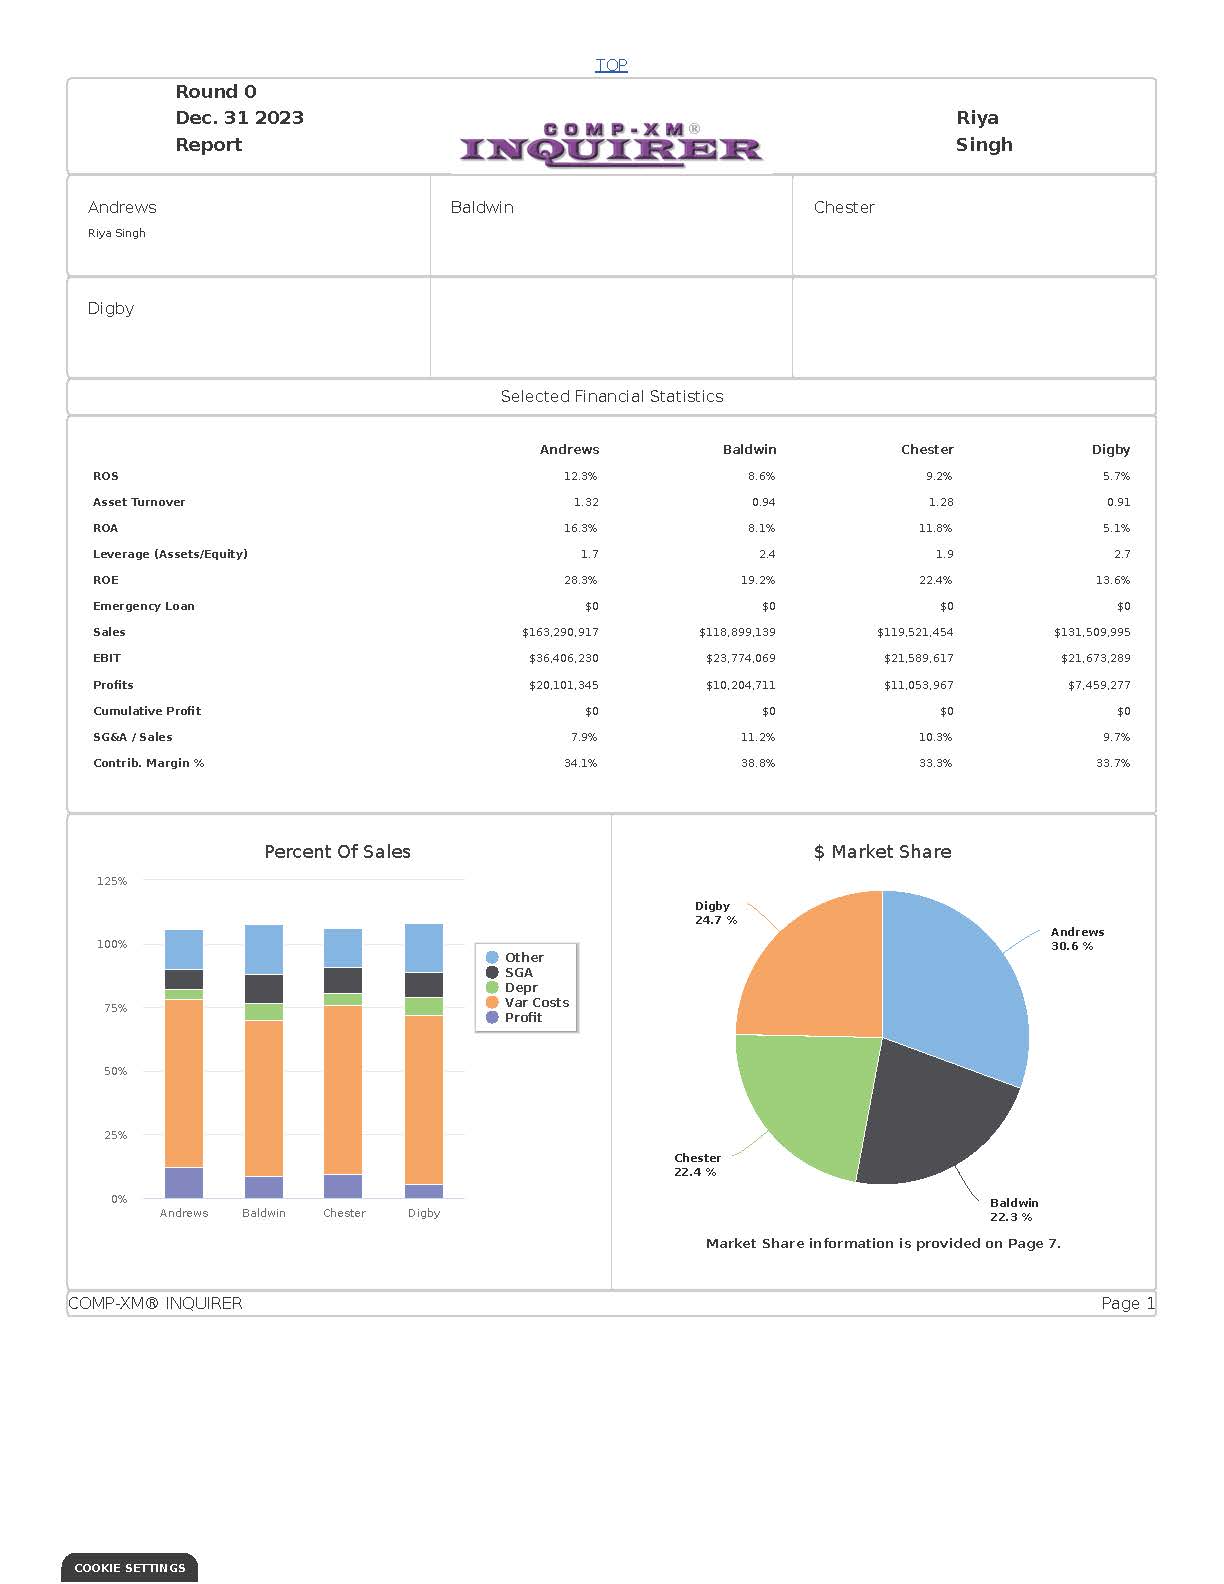
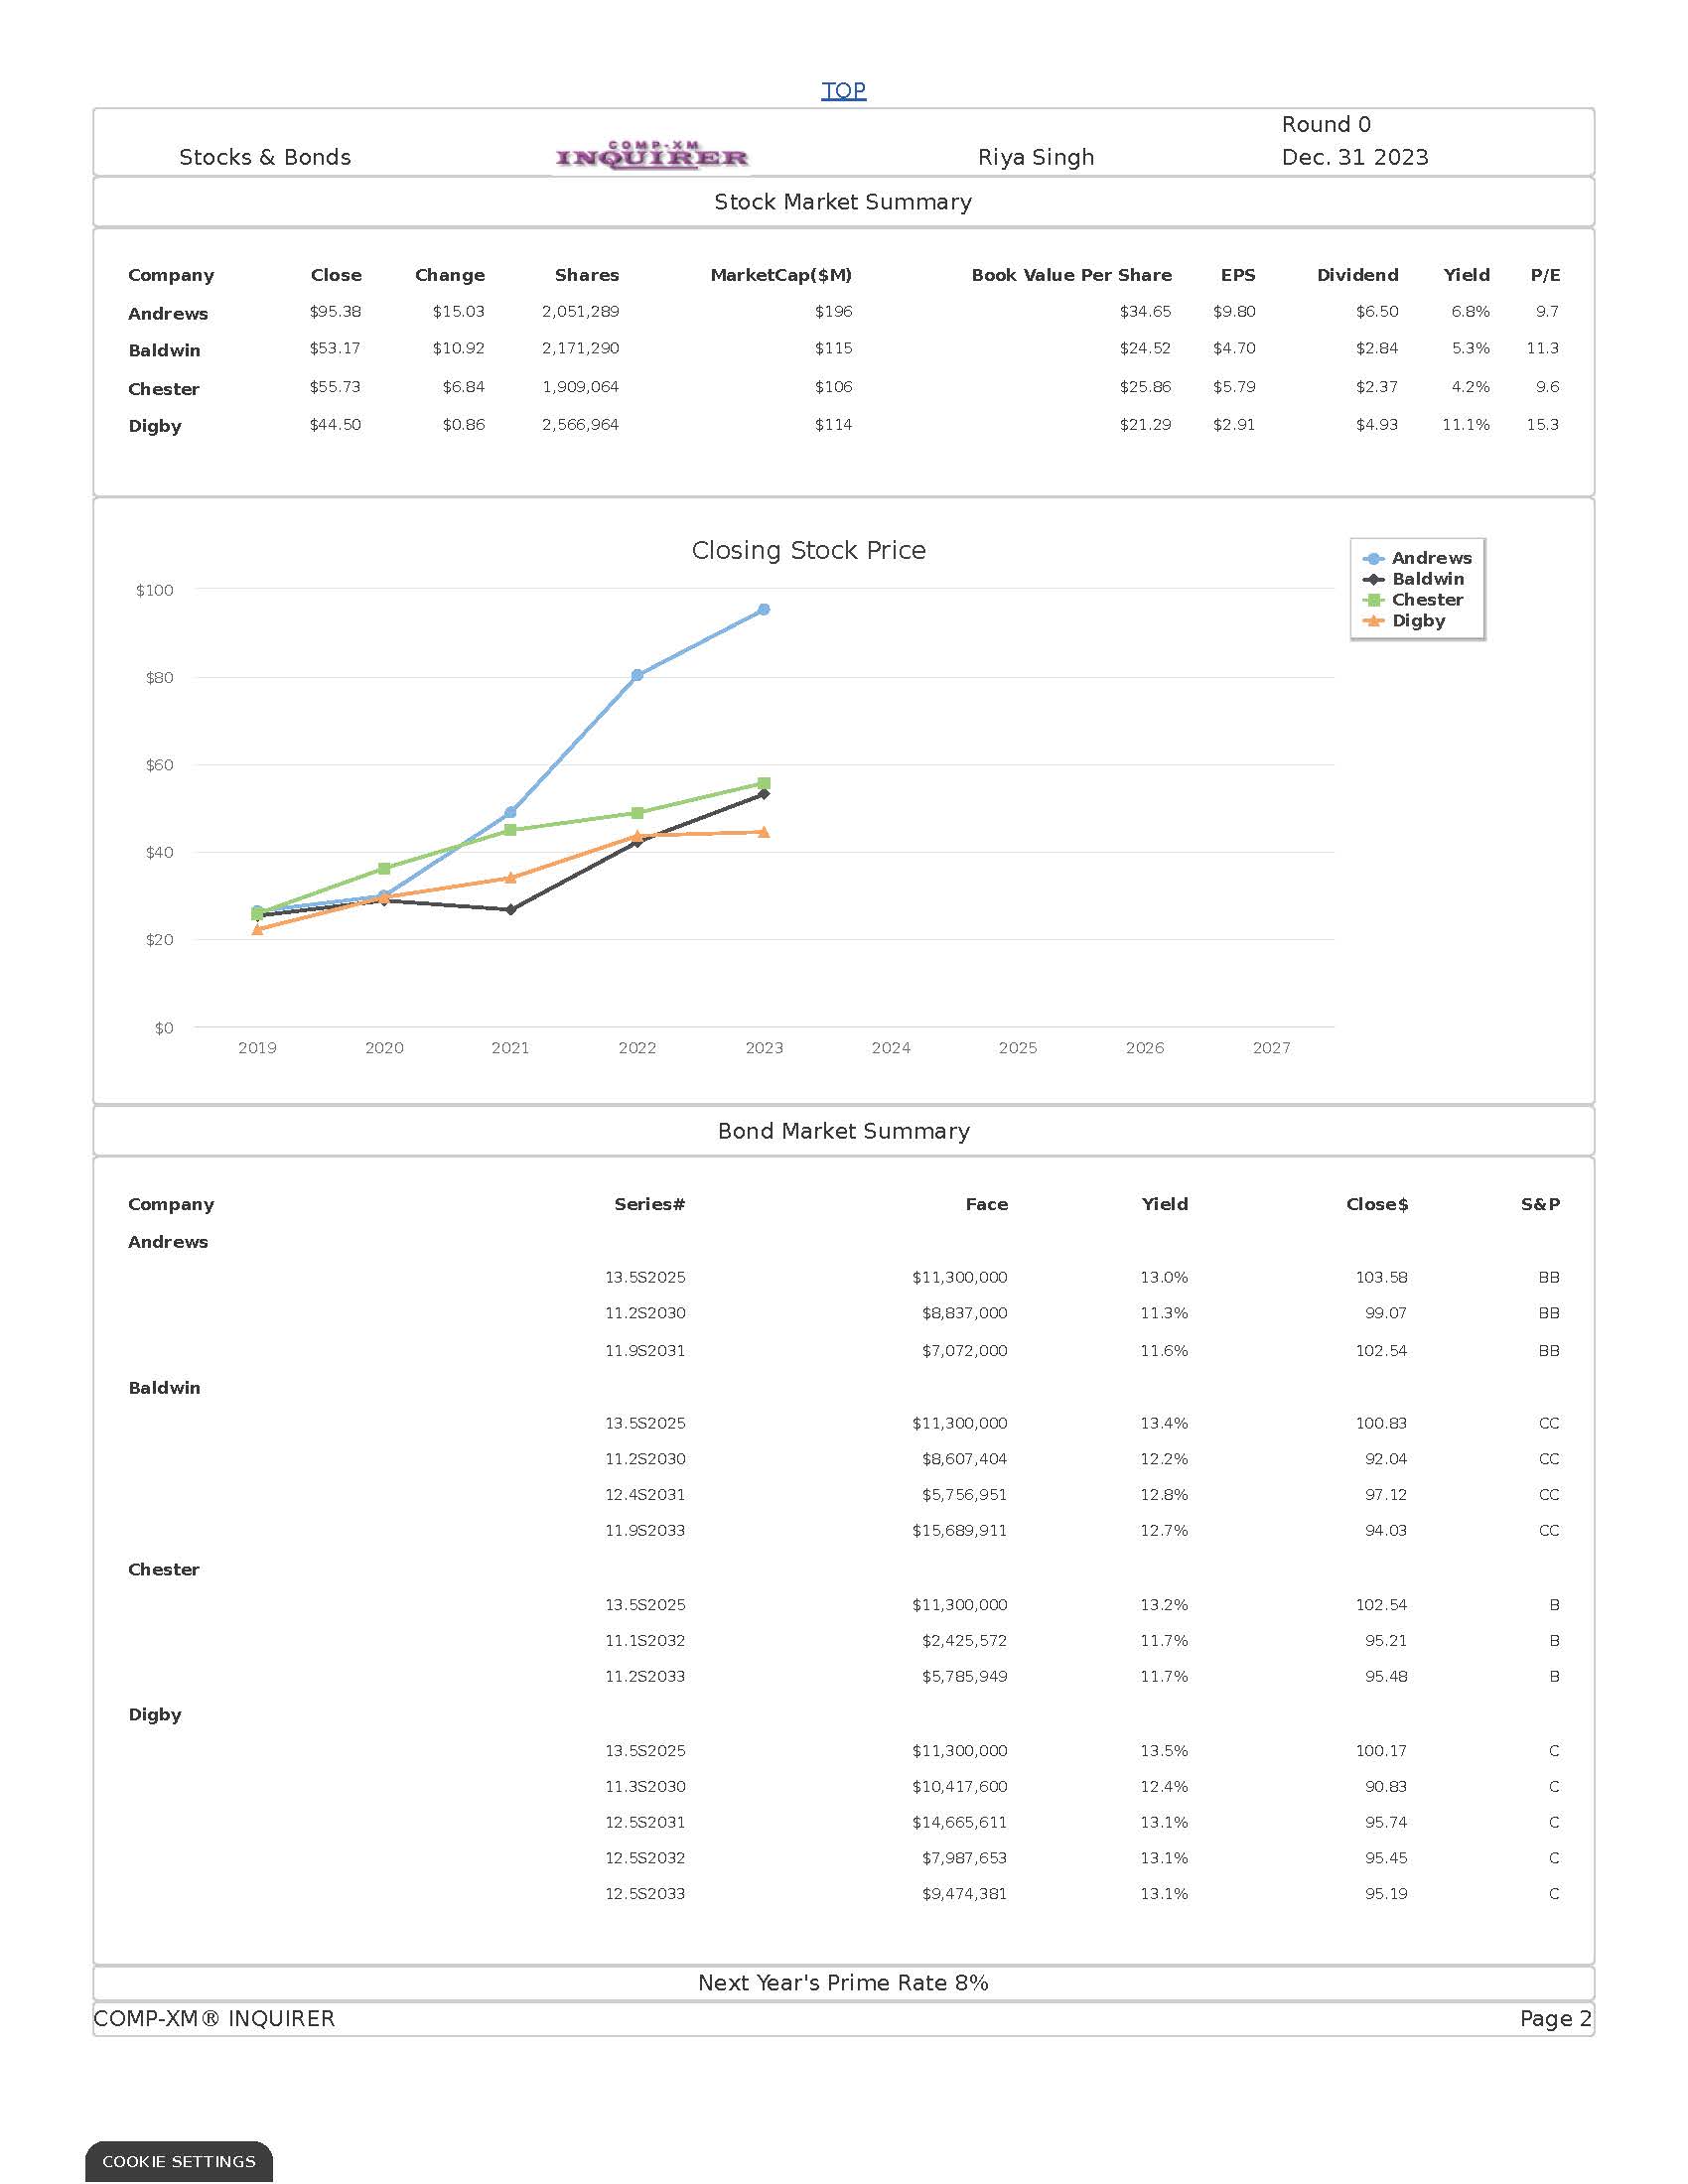
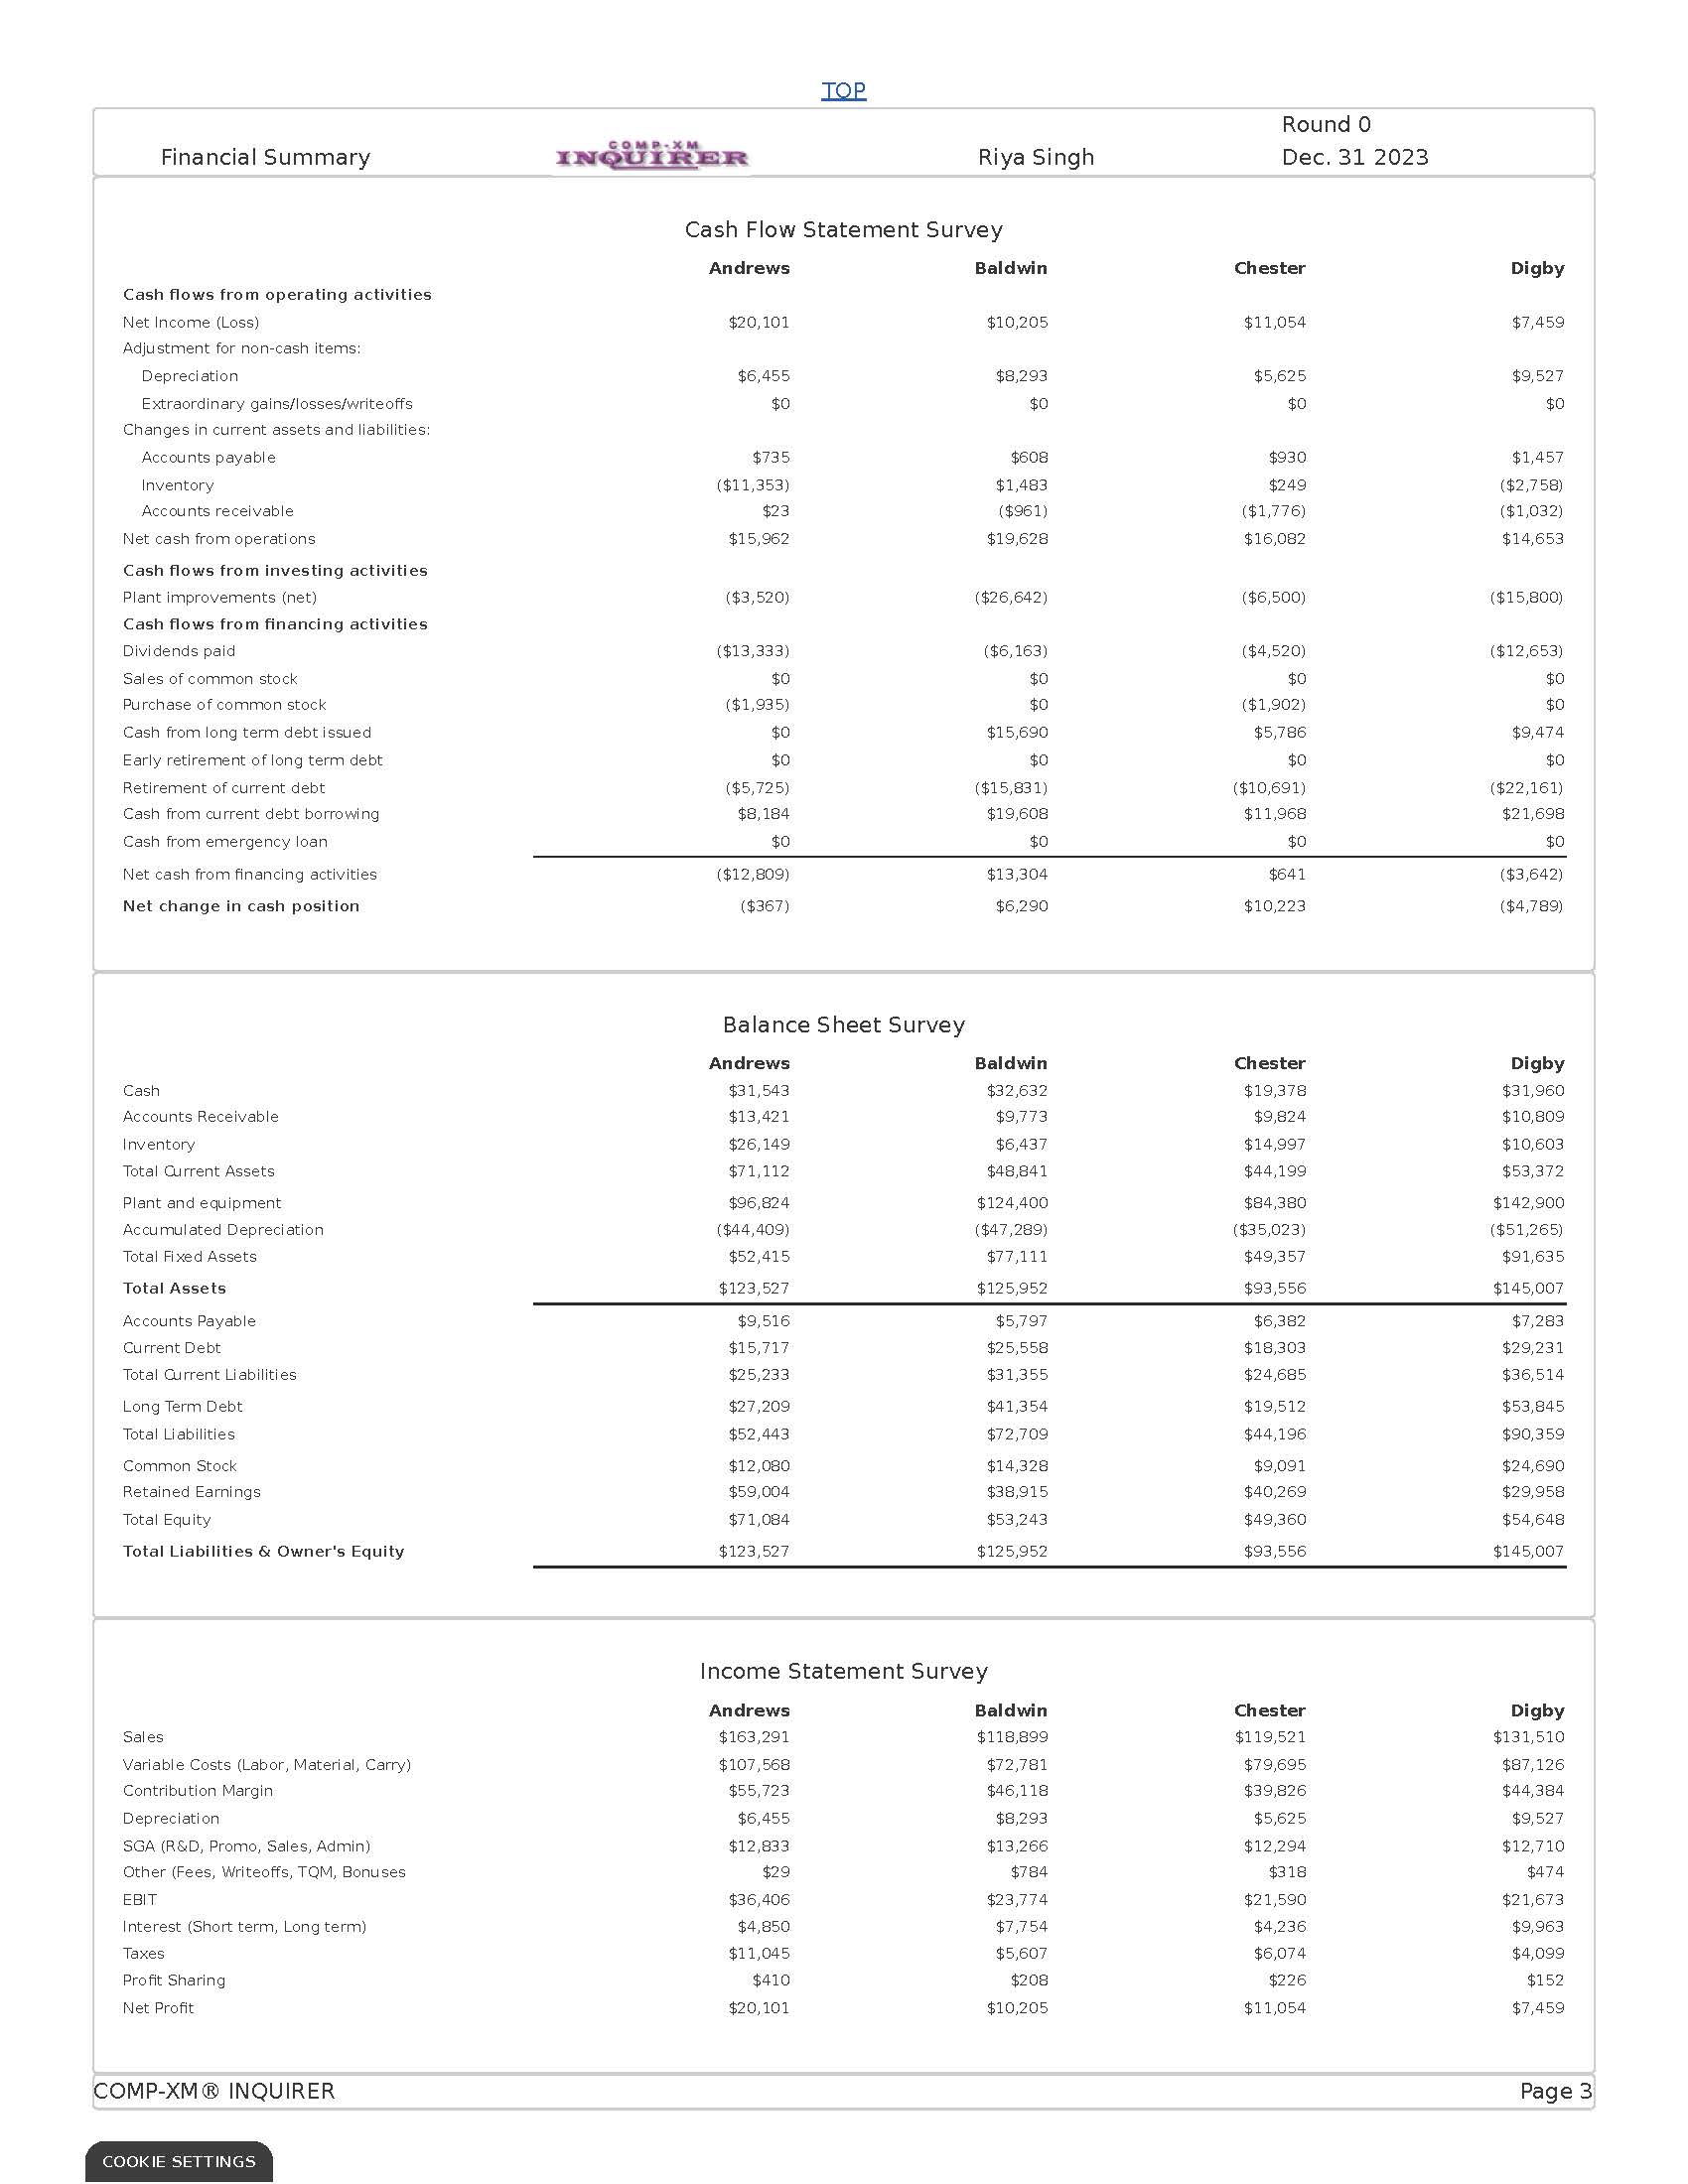
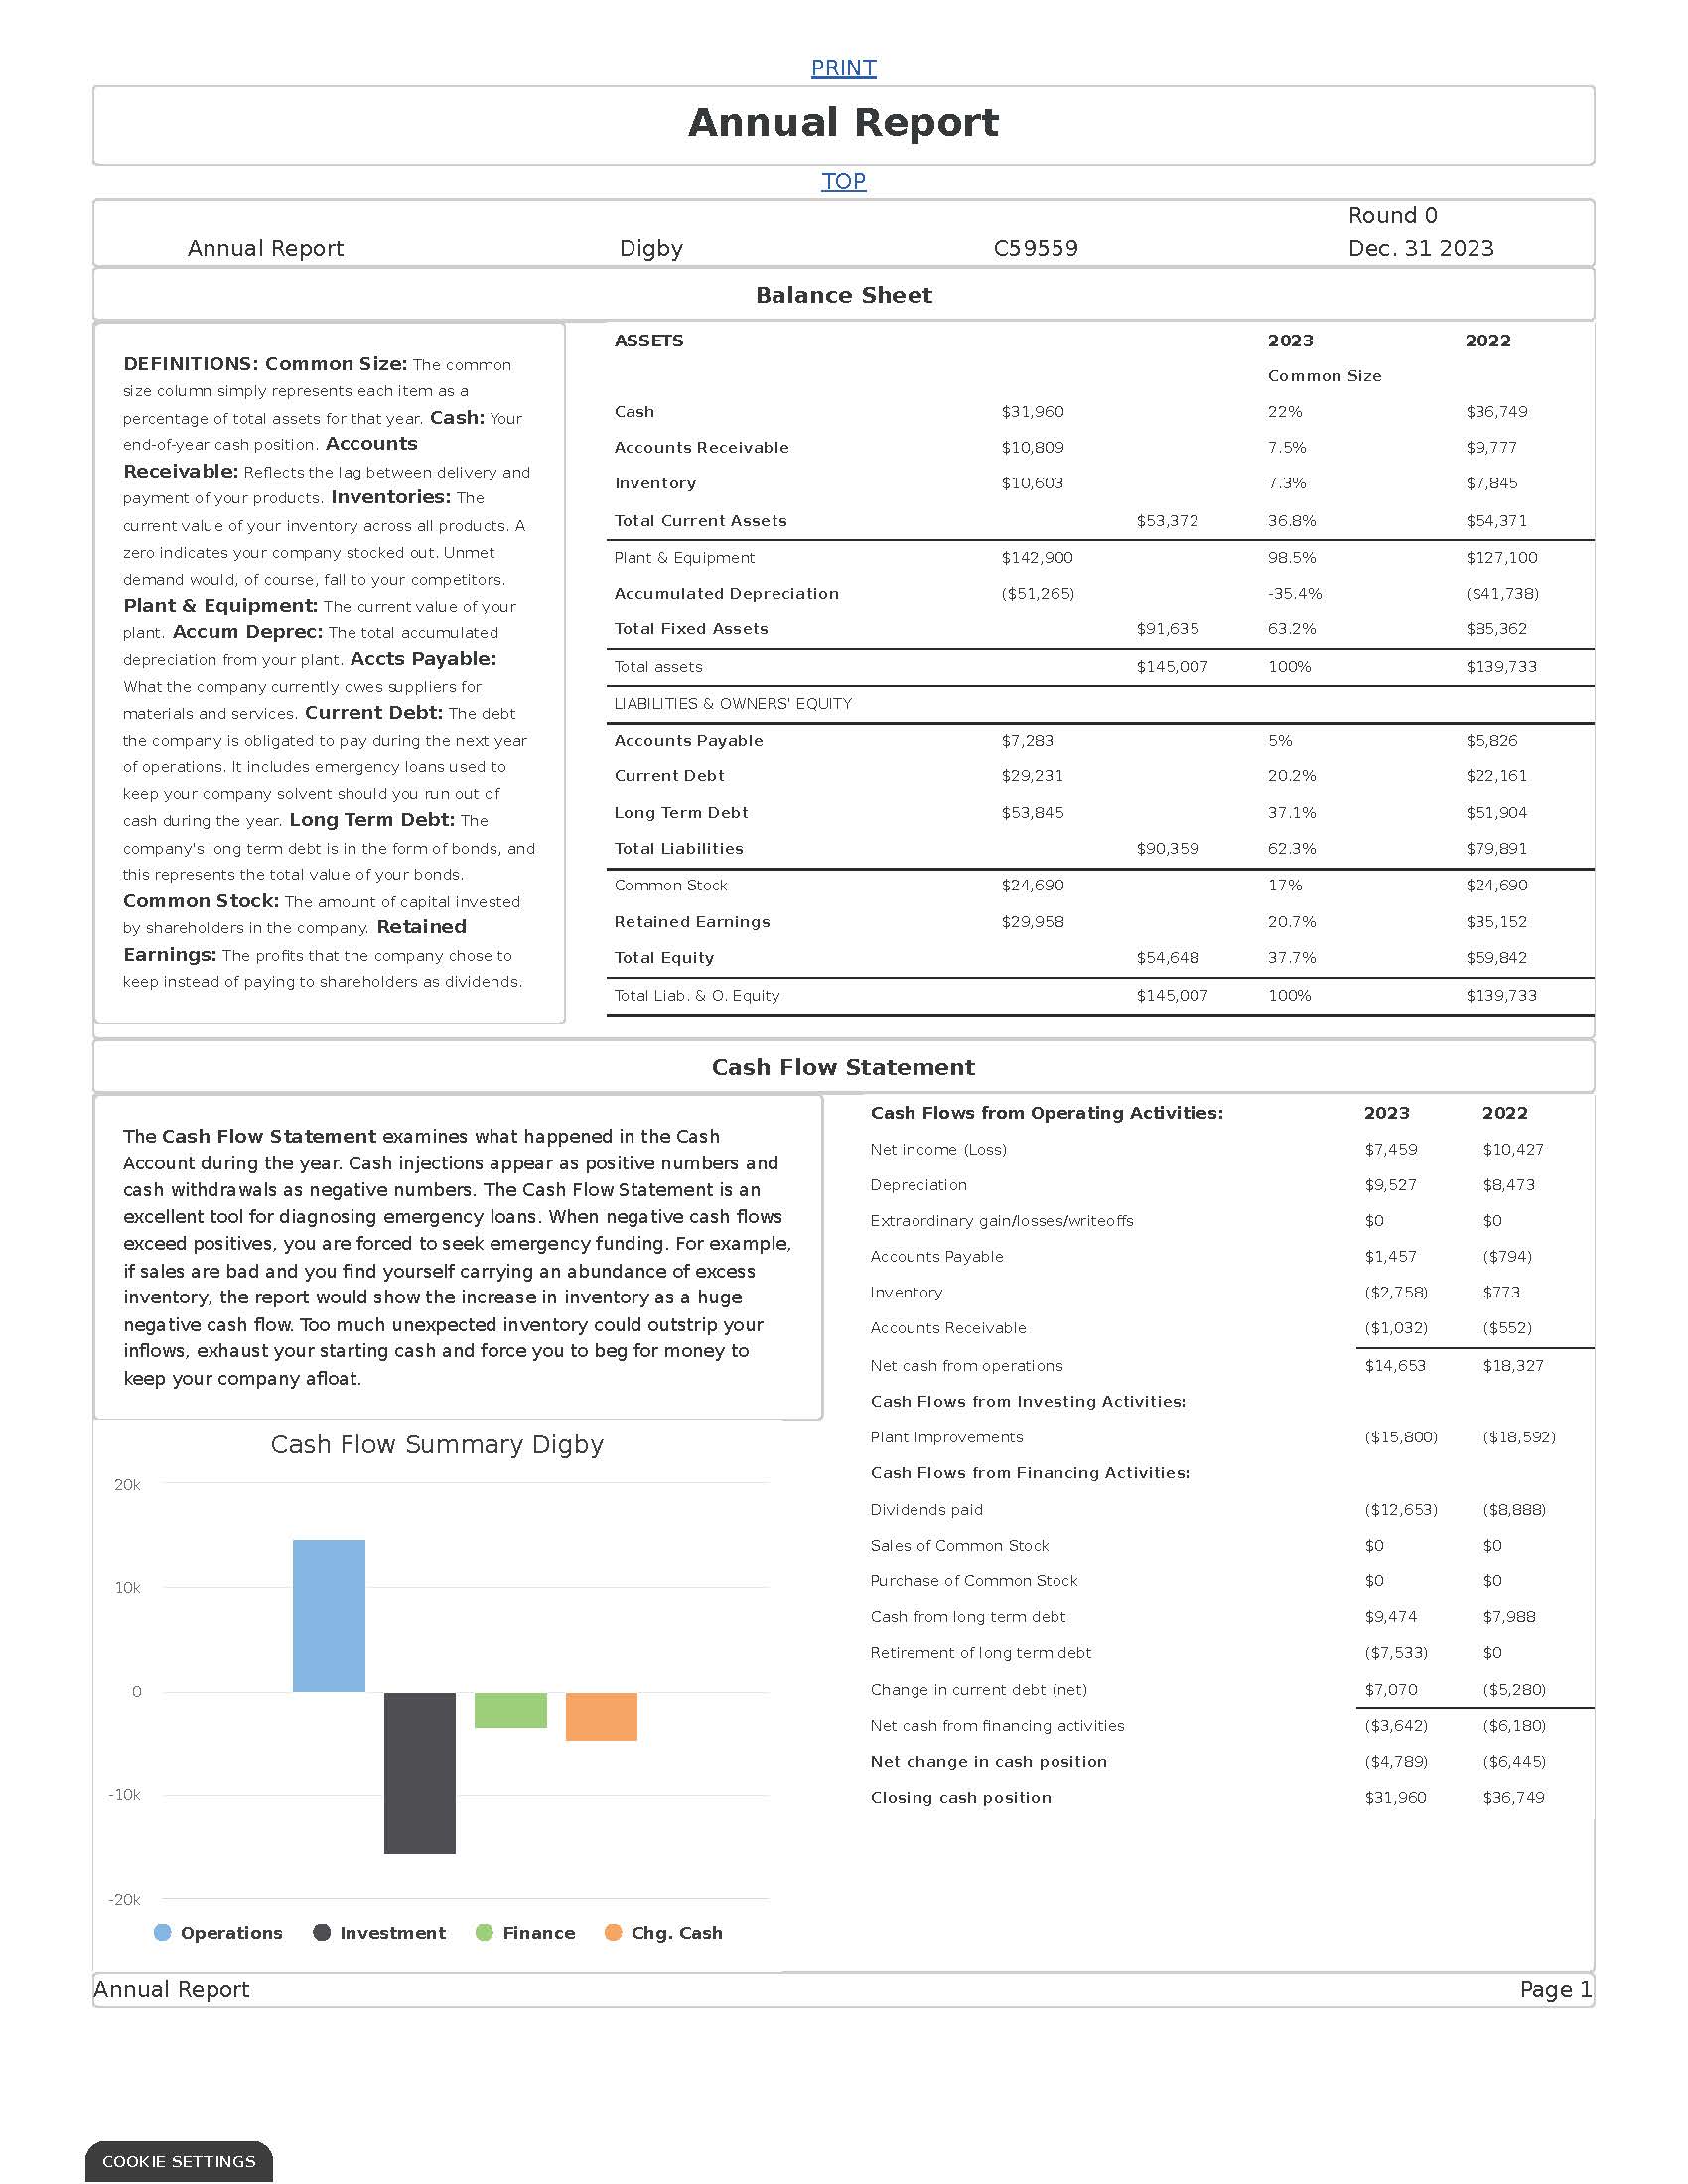
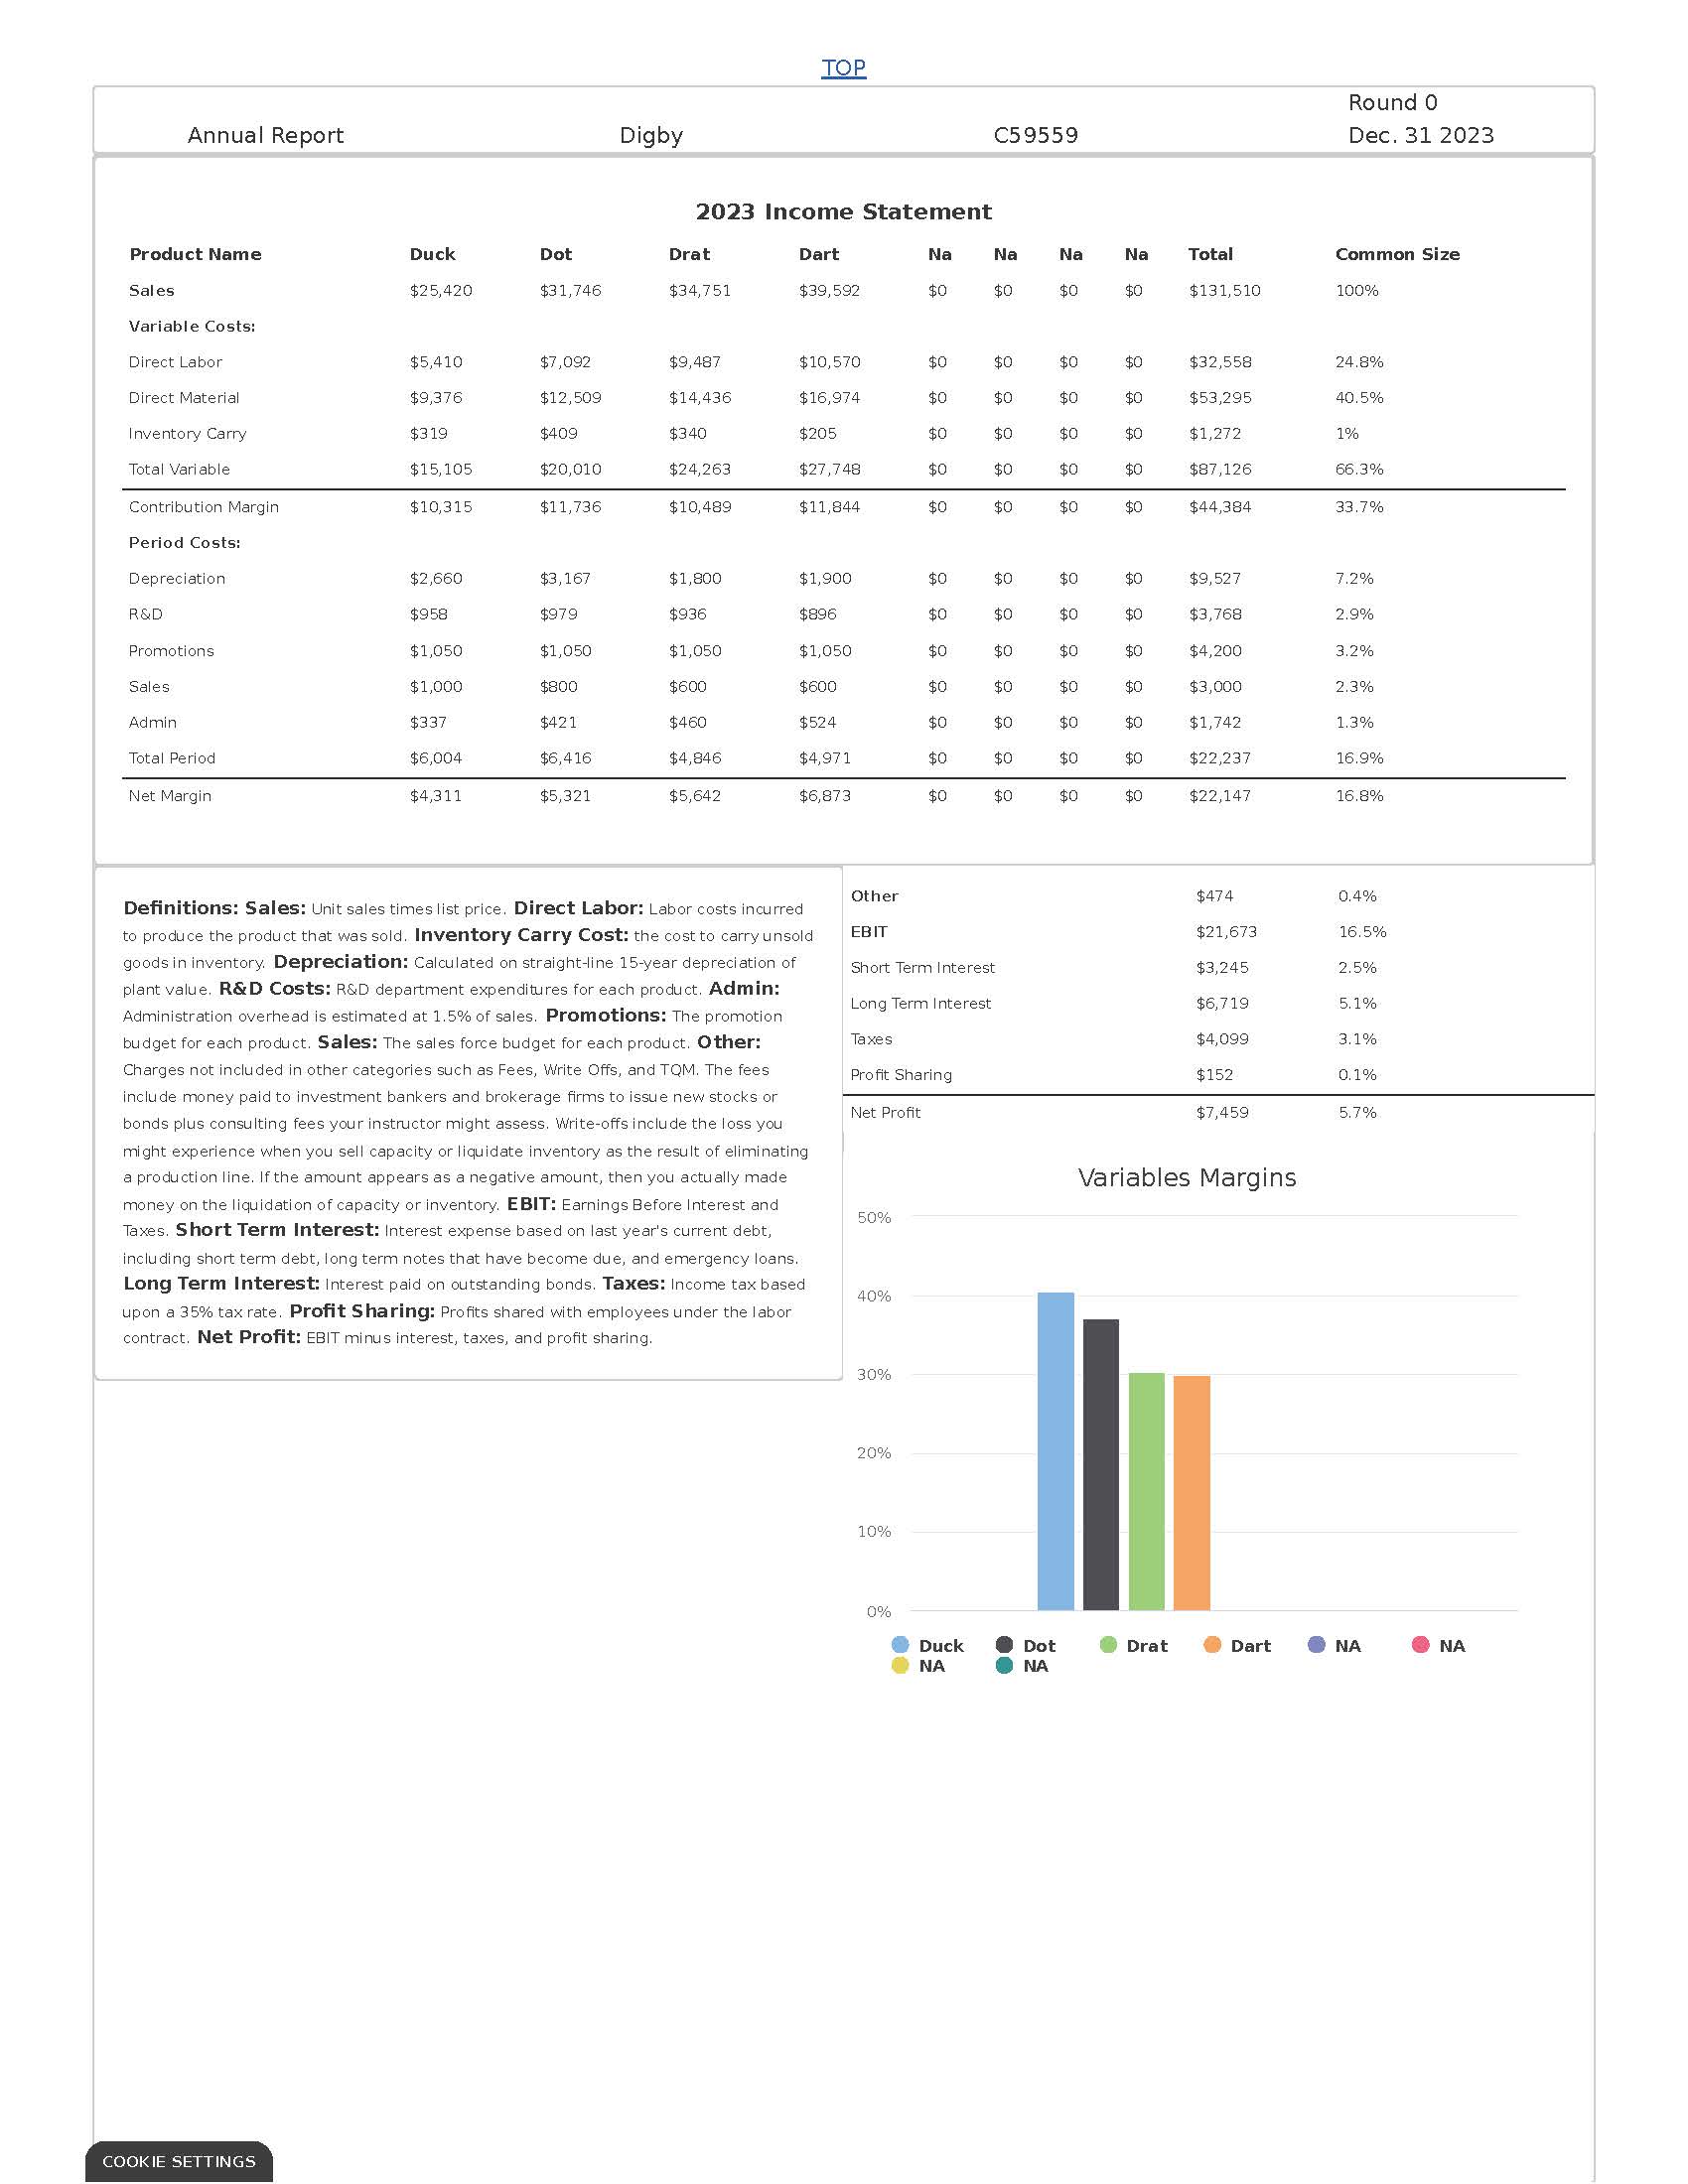
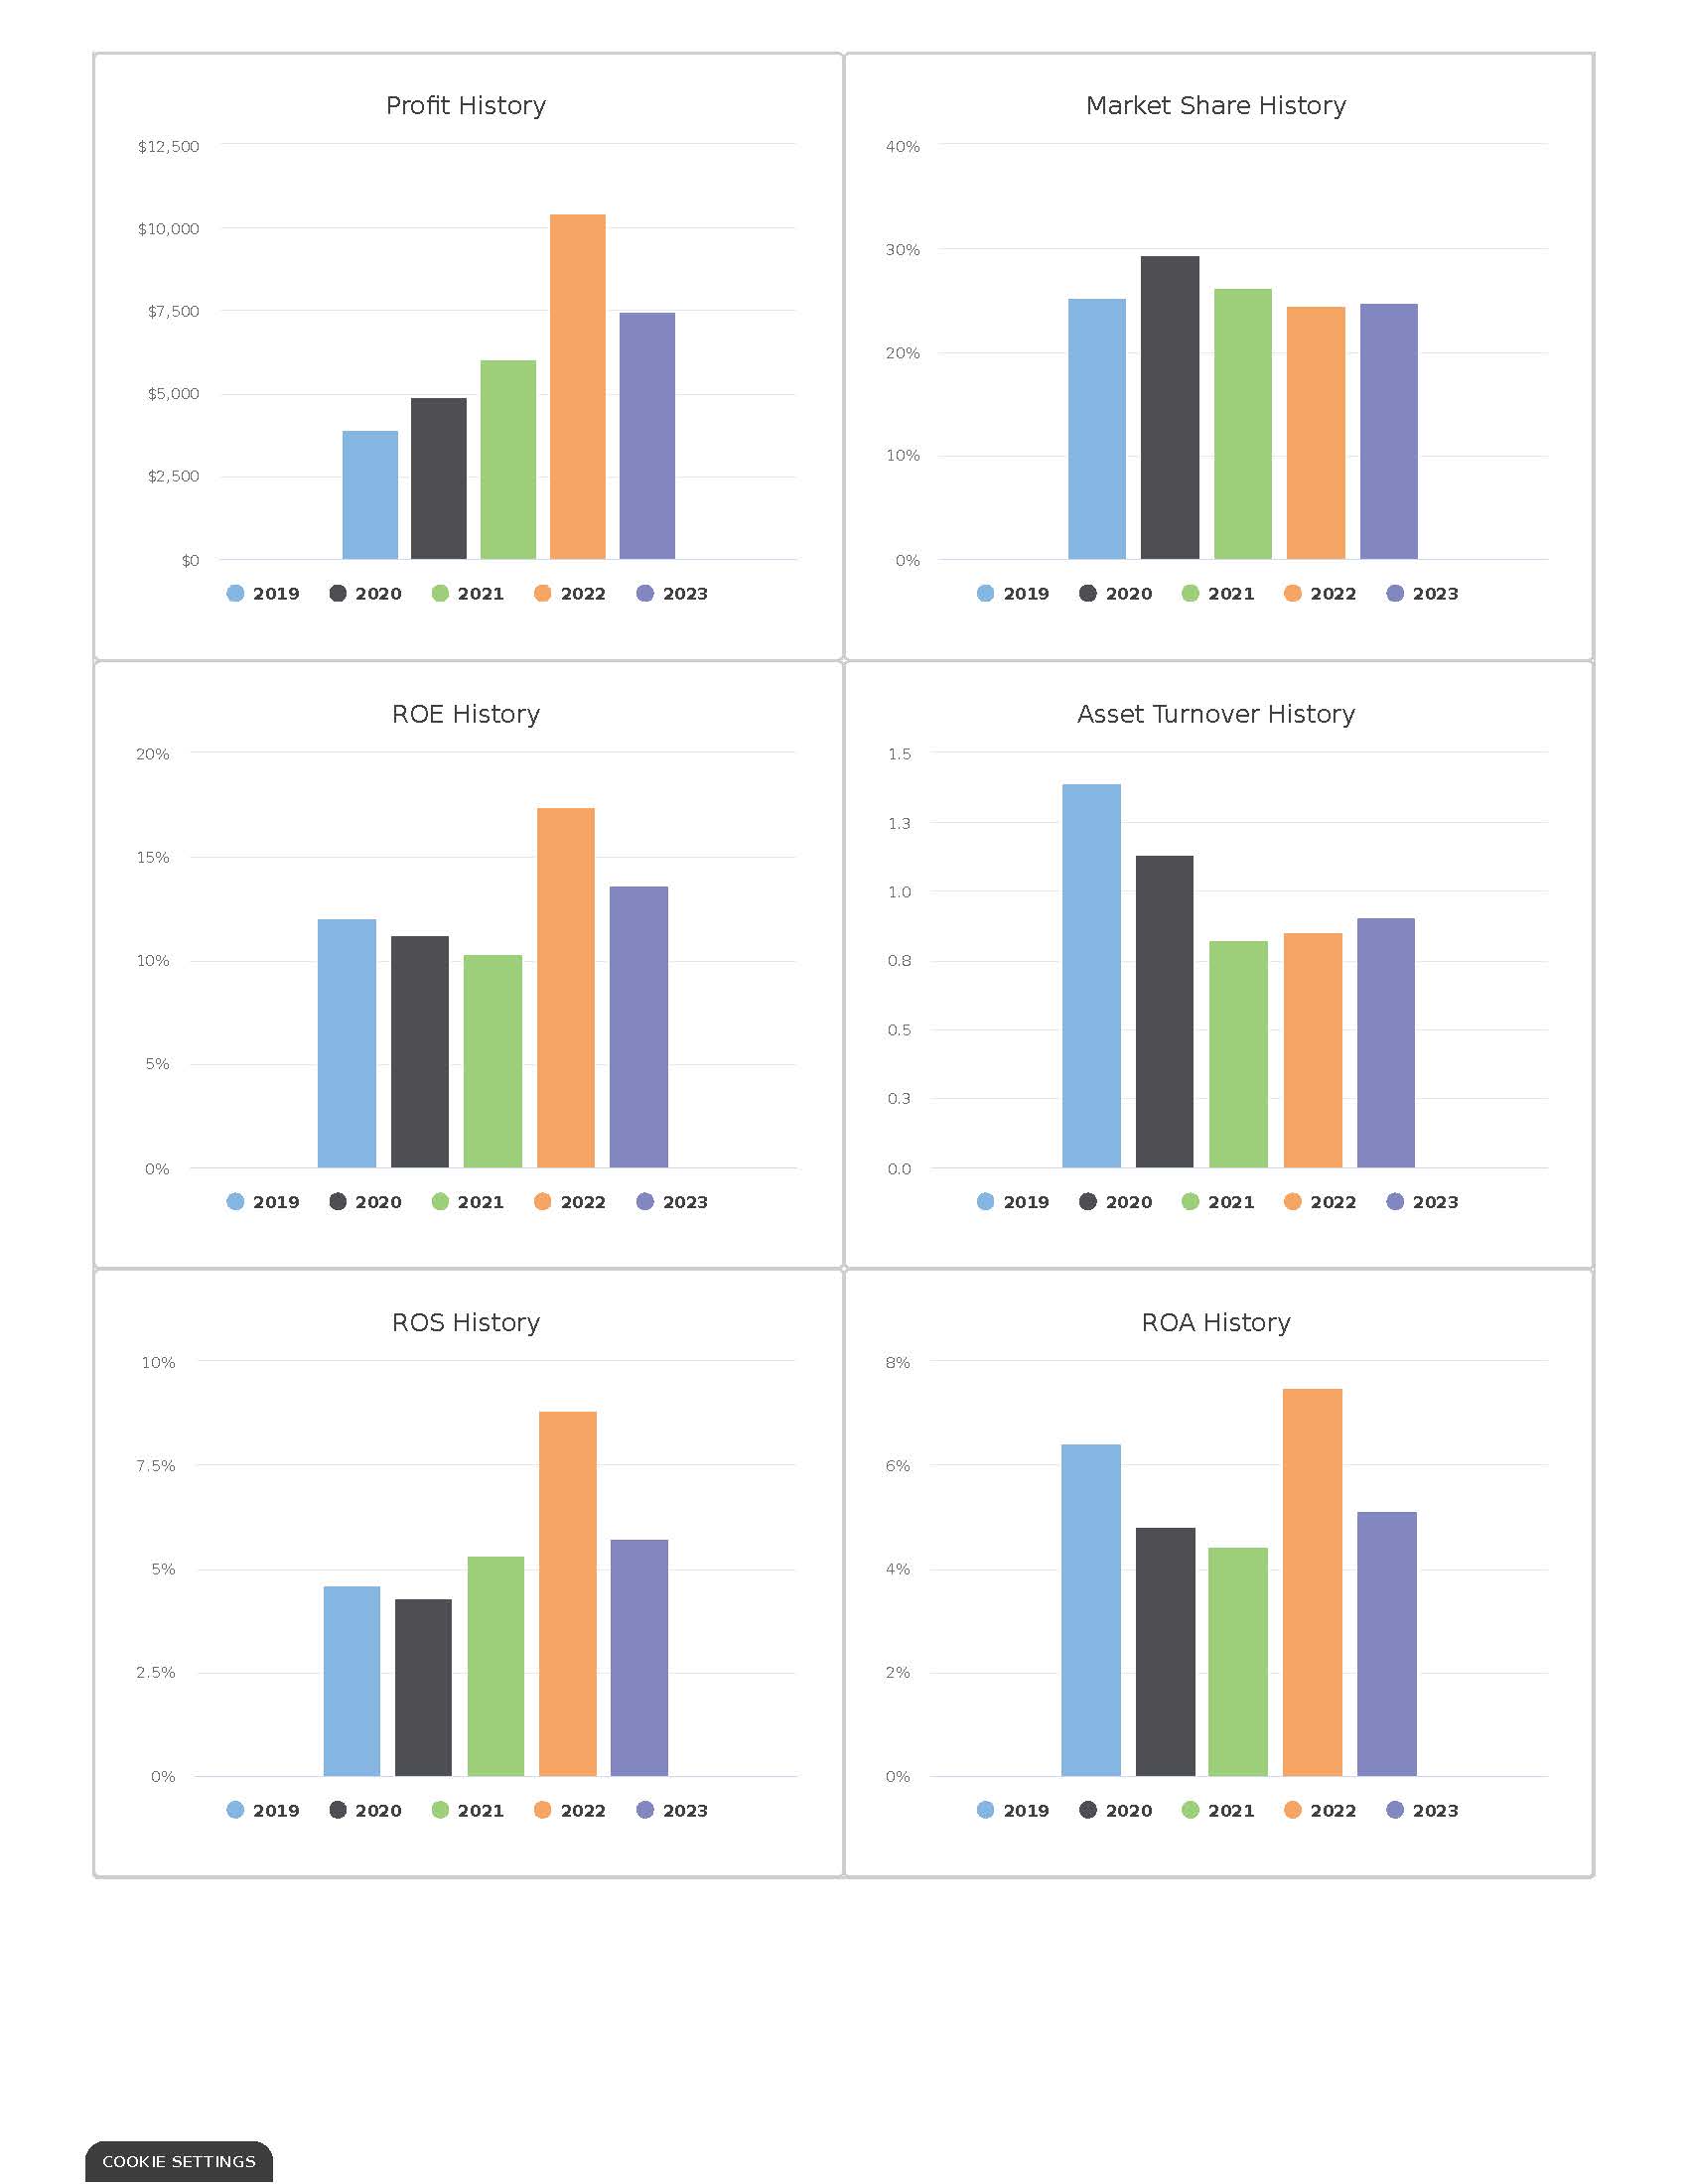
Page 1 Front Page Page 5 Thrift Segment Analysis Page 9 Market Share Page 2 Stocks & Bonds Page 6 Core Segment Analysis Page 10 Perceptual Map Page 3 Financial Summary Page 7 Nano Segment Analysis Page 11 HR/TOM Report Page 4 Production Analysis Page 8 Elite Segment Analysis Annual Report Andrews Annual Report Baldwin Annual Report Chester Annual Report Digby Print COOKIE SETTINGSTOP Round 0 Dec. 31 2023 COMP-XM Riya Report INQUIRER Singh Andrews Baldwin Chester Riya Singh Digby Selected Financial Statistics Andrews Baldwin Chester Digby ROS 12.3% 8. 6% 9.2% 5.7% Asset Turnover 1.32 0.94 1.28 0.91 ROA 16.3% 8.1% 11.8% 5.1% Leverage (Assets/Equity) 1. 7 2.4 1.9 2.7 ROE 28.39% 19.2%% 22.4% 3.6% Emergency Loan $0 $0 $0 $0 Sales $163.290,917 $118,899.139 $119,521,454 $131,509,995 EBIT $36,406,230 $23,774.069 $21,589,617 $21,673.289 Profits $20.101,345 $10. 204.711 $11,053,967 $7.459.277 Cumulative Profit $0 $0 $0 $0 SG&A / Sales 7.9% 11.2% 10.3% 9. 7% Contribmargin % 34.1% 38.89 33.3% 33.7% Percent Of Sales $ Market Share 125% Digby 24.7 % Andrews 100% 30.6% Other SGA Depr 75% Var Costs Profit 50% Chester 22.4 % 0% Baldwin Andrews Baldwin Chester Digby 22.3% Market Share information is provided on Page 7. COMP-XM@ INQUIRER Page 1 COOKIE SETTINGTOP Round 0 Stocks & Bonds INQUIRER Riya Singh Dec. 31 2023 Stock Market Summary Company Close Change Shares MarketCap($M) Book Value Per Share EPS Dividend Yield P/E Andrews $95.3 $15.03 2,051,289 $196 $34.65 $9.80 $6.50 6.8% 9.7 Baldwin $53.17 $10.92 2,171,290 $1 15 $24.52 $4.70 $2.84 5.3% 1 1.3 Chester $55.73 $6.84 1,909,064 $106 $25.86 $5.7 $2.37 4.2% 9.6 $44.50 $0.86 $114 $21.29 $2.91 $4.93 11.1% Digby 2,566,964 15.3 Closing Stock Price Andrews + Baldwin $100 Chester Digby $80 $60 $40 $20 $0 2019 2020 2021 2022 2023 2024 2025 2026 2027 Bond Market Summary s& P Company Series# Face Yield Close$ Andrews 13.552025 $11,300,000 13.0% 103.58 BB 11.252030 000' LE8'89 11.3% 99.07 BB 1.952031 $7,072,000 11.6% 102.54 3B Baldwin 13.582025 $11,300,000 13.4% 100.83 CC 11.252030 $8,607,404 12.2% 92.04 CC 12.452031 $5,756,951 12.8% 97.12 CC 11.952033 $15,689,911 2.7% 94.0 -c Chester 13.552025 $11,300,000 13.2% 102.54 B 11. 152032 $2,425,572 1.7% 95.21 11.252033 $5,785,949 11.7% 95.48 Digby 13.552025 $11,300,000 3.5% 100.17 11.352030 $10,417,600 12.4% 90.83 12.5203 $14,665,611 13.1% 95.7 12.562032 $7,987,653 13.1% 95.45 12.552033 $9,474,381 13.1% 95.19 Next Year's Prime Rate 8% COMP-XM@ INQUIRER page 2 COOKIE SETTINGSTOP Round 0 Financial Summary INQUIHER Riya Singh Dec. 31 2023 Cash Flow Statement Survey Andrews Baldwin Chester Cash flows from operating activities Digby Net Income (Loss) $20, 101 $10,205 $11,054 $7,459 Adjustment for non-cash items: Depreciation $6,455 $8,293 $5,625 $9,527 Extraordinary gains/losses/write offs $0 $0 $0 $O Changes in current assets and liabilities Accounts payable $735 $608 $930 $1,457 Inventory ($11,353) $1,483 $249 ($2,758) Accounts receivable $23 ($961 ($1,776) $1,032 Net cash from operations $15,962 $19,628 $16,082 $14,653 Cash flows from investing activities Plant improvements (net) ($3,520) ($26,642) ($6,500) ($15,800) Cash flows from financing activities Dividends paid ($13,333) ($6,163) ($4,520 ) ($12,653) Sales of common stock $0 $0 $0 Purchase of common stock $0 ($1,935) $0 $1,902) $0 Cash from long term debt issued $0 $15,690 $5,786 $9.474 Early retirement of long term debt $0 $0 $0 $C Retirement of current debt $5,725) ($15,831) ($10,691) ($22,161) Cash from current debt borrowing $8, 184 $19,608 $11,968 $21,698 Cash from emergency loan $0 $0 $0 $0 Net cash from financing activities ($12,809) $13,304 $641 ($3,642) Net change in cash position ($367 $6,290 $10,223 ($4,789) Balance Sheet Survey Andrews Baldwin Chester Cash Digby $31,543 $32,632 $19,378 Accounts Receivable $31,960 $13,42 $9,773 $9,824 Inventory $10,809 $26, 149 $6,437 $14,997 $10,603 Total Current Assets $7 1, 112 $48,84: $44,199 $53,372 Plant and equipment $96,824 $124,400 $84,380 $142,900 Accumulated Depreciation $44,409) $47,289) $35,023) Total Fixed Assets ($51,265) $52,415 $77,111 $49,357 $91,635 Total Assets $123,527 $125,952 $93,556 $145,007 Accounts Payable $9,516 $5,797 $6,382 $7,28 Current Debt $15,717 $25,558 $18,303 Total Current Liabilities $29,231 $25,233 $31,355 $24,685 $36,514 Long Term Debt $27,209 $41,354 $19,512 $53,845 otal Liabilities $52,443 $72,709 $44,196 $90,359 Common Stock $12,080 $14,328 $9,091 $24,690 Retained Earnings $59,004 $38,915 $40,269 $29,958 Total Equity $71,084 $53,243 $49,360 $54,648 Total Liabilities & Owner's Equity $123,527 $125,952 $93,556 $145,007 Income Statement Survey Andrews Baldwin Chester Sales Digby $163,291 $118,899 $1 19,521 $131,510 Variable Costs (Labor, Material, Carry) $107, 568 $72,78 $79,695 Contribution Margin $87,126 $55, 723 $46,118 $39,826 Depreciation $44,384 $6,455 $8,293 $5,625 $9, 527 SGA (R&D, Promo, Sales, Admin. $12,833 $13,266 $12,294 $12, 710 Other (Fees, Writeoffs, TOM, Bonuses $29 $784 $318 EBIT $474 36,406 $23,774 $21,590 Interest (Short term, Long term) $21,673 $4,850 $7,754 $4,236 $9,96 Taxes $1 1,04 $5,607 $6,074 $4,099 Profit Sharing $410 $208 $226 Net Profit $152 $20,10 $10,205 $11,054 $7,459 COMP-XM @ INQUIRER Page 3 COOKIE SETTINGSTOP Round 0 Riya Singh Dec. 31 2023 Production Analysis INQUIRER Production Capacity Andrews Baldwin Chester Digby 5,500 6,000 6,500 500 1,000 1,500 2,000 2,500 3,000 3,500 4,000 4,500 5,000 Capacity Production Andrews Baldwin Chester Digby 5,594 4,751 3,317 5,941 Units Produced Production Information Capacity Unit Revision Age Pfmn Size Material Labor Contr. 2nd Shift & Automation Next Plant Primary Units Cost Cost Marg. Overtime Next Round Round Utiliz. Coord Coord Price Name Segment Sold Inventory Date Dec. 31 MTBF 36% 22% 4.0 714 121% Aft Elite 772 219 11/14/2023 1.1 26000 12.7 9.6 $42.00 $16.81 $9.80 14.9 $26.00 $8.13 $7.90 33% 90% 5.0 1, 130 188% 1,368 5.2 Agape Thrift 761 4/13/2021 5.1 20000 $11.60 $8.96 35% 50% 5.0 1,200 149% Abby Core 1,827 54 12/10/2022 2.2 22000 19 12.2 $32.00 $16.13 $10.29 33% 42% 4.0 728 141% Adam 11/9/2023 1.1 24000 10.6 7.6 $40.00 Nano 921 267 100% 9.0 ,000 198% 6/27/2024 3.5 14000 5.5 14.6 $20.00 $6.65 $2.82 51% Bid Thrift 1,730 22 $10.01 $5.64 31% 100% 7.0 1,150 198% Bold Core 1,885 14 11/30/2023 1.2 1600 8.1 12.0 $22.00 12/22/2023 1.1 1800 10.0 8.3 $31.00 $13.64 $6.24 36% 25% 6.0 750 124% Buddy Nano 700 161 5.0 800 107% 504 137 11/5/2023 1.1 20000 12.0 10.1 $35.00 $14.36 $7.09 38% 3% Bat Elite 25% 93% 5.0 570 19170 cid Nano 1, 12 91 11/12/2023 2.2 23000 9.4 $30.00 $13.98 $9.50 $15.87 41% 5.0 700 64% $7.73 0% Coat Elite 435 149 12/13/2023 1.9 25000 .2.1 10.2 $38.00 $8.50 34% 27% 5.0 850 125% 10.5 15.79 Cure Nano 959 12/22/2023 1.0 23000 7.6 $37.00 1.0 25000 12 5 9.6 $39.00 $16.39 $7.95 37% 5% 50 105% 364 194 Camp Elite 12/5/2023 8.0 1,050 132% Thrift 1,338 240 12/11/2023 2.8 17000 6.3 13.8 $19.00 $8.40 $4.03 41% 33% Duck 8.0 ,250 155% 1,671 290 12/19/2023 2.6 17000 6.5 13.6 $19.00 $8.61 $4.22 37% 57% Dot Thrif $11.68 $7.38 30% 93% 6.0 900 191% 8.9 10.8 $27.00 Drat Core 1,287 52 12/3/2023 1.2 18000 $7.38 30% 93% 60 950 191% 96 Dart Core 1,414 7 11/19/2023 1.2 20000 11.3 $28.00 $12.39 Page 4 COMP-XM @ INQUIRER COOKIE SETTINGSTOP Thrift Market Segment Round 0 Analysis INQUIRER Riya Singh Dec. 31 2023 Thrift Statisites Accessibility Thrift Total Industry Unit Demand 5,101 Actual Industry Unit Sales 5 , 101 Andrews Segment % of Total Industry 27% Next Year's Segment Growth Rate 1 1% Baldwin Thrift Customer Buying Criteria Expectations Importance 1 . Price $14.00 - 26.00 55% Chester 2 . Reliability MTBF 14000-20000 20% 3. I deal Position ofmn 6.0 Size 14. 15% 4. Age deal Age = 3.0 10% Digby 0% 10% 20% 30% 40% 50% 60% 70% 80% Perceptual Map For Thrift Actual vs Potential Market Share Thrift 20 60% 18 50% 16 Agape 14 Duck 40% Bold 12 Draar 30% Size 10 20% 10% N 0% O Andrews Baldwin Chester Digby 4 6 8 10 12 14 16 18 20 Performance Actual . Potential Top Products in Thrift Segment Units Market Sold to Revision Stock Pfmn Size List Age Promo Cust. Sales Cust. Dec. Cust. Name Share Seg Date Out Coord Coord Price MTBF Dec.31 Budget Awareness Budget Accessibility Survey Dot 27% 1,401 12/19/2023 6.5 13.6 $19.00 17000 2.56 $1,050 53% $800 62% 30 Duck 23% ,184 12/11/2023 5.3 13.8 $19.00 17000 2.76 $1,050 63% $1,000 62% 31 .,040 6/27/2024 5.5 14.6 $20.00 14000 3.46 $950 52% $1,000 53% 18 Bid 20% Agape 16% 839 4/13/2021 5.2 14.9 $26.00 20000 5.11 $1,200 79% $2,000 74% 13 Bold 10% 516 11/30/2023 3.1 12.0 $22.00 16000 1. 17 $950 52% $1,000 63% 6 Drat 1% 72 12/3/2023 3.9 10.8 $27.00 18000 1.21 $1,050 62% $600 62% O Dart 1% 48 9.6 11.3 $28.00 20000 1.25 $1,050 63% $600 62% COMP-XM@ INQUIRER Page 5 COOKIE SETTINGSTOP Round 0 Core Market Segment Analysis INQUIRER Riya Singh Dec. 31 2023 Core Statisitcs Accessibility Core Total Industry Unit Demand 6,676 Actual Industry Unit Sales 6,676 Andrews Segment % of Total Industry 35.3% Next Year's Segment Growth Rate 10% Baldwin Core Customer Buying Criteria Expectations Importance 1. Price $20.00 - 32.00 46% Chester 2. Ag Ideal Age = 2.0 20% 3 . Reliability MTBF 16000-22000 18% 4. Ideal Position Pfmn 8.1 Size 12.0 16% Digby 0% 20% 40% 60% 80% 100% Perceptual Map For Core Actual vs Potential Market Share Core 20 40% 18 16 Agape 30% 14 Duck Abby, 12 Drat cid_ Coat 20% Size 10 _Buddy 10% N 0% Andrews Baldwin Chester Digby 4 6 8 10 12 14 16 18 20 Performance Actual . Potential Top Products in Core Segment Units Market Sold to Revision Stock Pfmn Size List Age Promo Cust. Sales Cust. Dec. Cust. Name Share Seg Date Out Coord Coord Price MTBF Dec.31 Budget Awareness Budget Accessibility Survey Bold 21% 1,369 11/30/2023 B. 12.0 $22.00 16000 1. 17 $950 52% $1,000 62% 33 27 Abby 18% 1,226 12/10/2022 19 12.2 $32.00 22000 2.24 $1,200 30% $1,000 35% Dart 5% 986 11/19/2023 9.6 11.3 $28.00 20000 1.25 $1,050 53% $600 58% 18 Drat 15% 978 12/3/2023 3.9 10.8 $27.00 18000 ..21 $1,050 52% $600 58% 18 Bid 10% 690 6/27/2024 5.5 14.6 $20.00 14000 3.46 $950 52% $ 1,000 62% 9 Agape 3% 529 4/13/2021 5.2 14.9 $26.00 20000 5.11 $1,200 79% $2,000 85% 5 413 11/12/2023 3.9 9.4 $30.00 23000 2.19 $1, 100 71% $400 22% 7 Cid 5% Dot 1% 270 12/19/2023 6.5 13.6 $19.00 17000 2.56 $1,050 63% $800 58% 27 Duck 2% 12/11/2023 6.3 13.8 $19.00 17000 2.76 $1,050 63% $1,000 58% 26 154 Budd 1% 54 12/22/2023 10.0 8.3 $31.00 18000 1.07 $950 53% $600 62% O Bat 09% 11/5/2023 12.0 10.1 $35.00 20000 1.12 $950 52% $1,300 62% COMP-XM @ INQUIRER Page 6 COOKIE SETTINGSTOP Round 0 Nano Market Segment Analysis INQUIRER Riya Singh Dec. 31 2023 Nano Statisitcs Accessibility Nano Total Industry Unit Demand 3,648 Actual Industry Unit Sales 3 ,648 Andrews Segment % of Total Industry 19.3% Next Year's Segment Growth Rate 14% Baldwin Nano Customer Buying Criteria Expectations Importance 1 . Ideal Position fmn 10.0 Size 8.1 35% Chester 2. Price $28.00 - 40.00 27% 3. Age Ideal Age = 1.0 20% 4. Reliability MTBF 18000-24000 18% Digby 0% 10% 20% 30% 40% 50% 60% 70% 80% 9... Perceptual Map For Nano Actual vs Potential Market Share Nano 20 50% 18 16 40% 14 Abby t- 30% 12 coatto Size 10 cid Buddy 20% 10% N 0% Andrews Baldwin Chester Digby 4 6 8 10 12 14 16 18 20 Performance Actual Potential Top Products in Nano Segment Units Market Sold to Revision Stock Pfmn Size List Age Promo Cust. Sales Cust. Dec. Cust. Name Share Seg Date Out Coord Coord Price MTBF Dec.31 Budget Awareness Budget Accessibility Survey Cure 18% 12/22/2023 10.5 7.6 $37.00 23000 1.04 $1, 100 70% $1,200 31% 44 Adam 17% 530 1 1/9/2023 10.6 .6 $40.00 24000 1. 12 $1,200 78% $1,000 82% 42 Buddy 13% 464 12/22/2023 10.0 8.3 $31.00 18000 1.07 $950 53% $600 56% 37 Cid 12% 431 11/12/2023 3.9 9.4 $30.00 23000 2.19 $1, 100 71% $400 31% 43 Abby 3% 296 12/10/2022 1.9 12.2 $32.00 22000 2.24 $1,200 80% $ 1,000 82% 10 Camp 7% 260 12/5/2023 12.5 9.6 $39.00 25000 1.05 $1, 100 69% $1,200 81% 10 Dart % 240 11/19/2023 9.6 11.3 $28.00 20000 ..25 $1,050 63% $600 28% 20 Bat 5% 236 1 1/5/2023 12.0 10.1 $35.00 20000 1.12 $950 52% $1,300 66% 12 15 Drat 5% 183 12/3/2023 8.9 10.8 $27.00 18000 1.21 $1,050 62% $600 28% Aft 4% 161 11/14/2023 12.7 9.6 $42.00 26000 1.09 $1,200 77% $1,000 82% Coat 20% 90 12/13/2023 12.1 10.2 $38.00 25000 1.91 $1, 100 72% $400 81% 13 COMP-XM @ INQUIRER Page 7 COOKIE SETTINGSTOP Round 0 Elite Market Segment Analysis INQUIRER Riya Singh Dec. 31 2023 Elite Statisitcs Accessibility Elite Total Industry Unit Demand 3,476 Actual Industry Unit Sales 3,476 Andrews Segment % of Total Industry 18.4% Next Year's Segment Growth Rate 16% Baldwin Elite Customer Buying Criteria Expectations Importance 1. Age deal Age = 0.0 34% Chester 2. Price $30.00 - 42.00 24% 3. Ideal Position Pfmn 12.0 Size 10.1 22% 4. Reliability MTBF 20000-26000 20% Digby 0% 20% 40% 60% 80% 100% Perceptual Map For Elite Actual vs Potential Market Share Elite 20 50% 18 16 40% 14 Abby 30% 12 Depart camp Size 10 Cid_ Buddy Adam 20% 10% N 0% Andrews Baldwin Chester Digby 4 6 8 10 12 14 16 18 20 Performance Actual . Potential Top Products in Elite Segment Units Market Sold to Revision Stock Pfmn Size List Age Promo Cust. Sales Cust. Dec. Cust. Name Share Seg Date Out Coord Coord Price MTBF Dec.31 Budget Awareness Budget Accessibility Survey Aft 18% 611 11/14/2023 12.7 9.6 $42.00 26000 1.09 $1,200 77% $1,000 37% 39 Camp 17% 604 12/5/2023 12.5 9.6 $39.00 25000 1.05 $1, 100 69% $1,200 31% 10 Bat 10% 360 1 1/5/2023 12.0 0.1 $35.00 20000 L. 12 $950 52% $1,300 55% 25 Coat 10% 346 12/13/2023 12.1 10.2 $38.00 25000 1.91 $1, 100 72% $400 31% 32 Abby 9% 306 12/10/2022 7.9 12.2 $32.00 22000 2.24 $1,200 30% $1,000 37% 8 Cure 9% 300 12/22/2023 10.5 7.6 $37.00 23000 1.0 $1, 100 70% $1,200 81% 11 Adam 3% 291 11/9/2023 10.6 .6 $40.00 24000 .. 12 $1,200 78% $1,000 87% 11 Cid 3% 282 11/12/2023 8.9 9.4 $30.00 23000 2.19 $1, 100 71% $400 81% 22 Budd 5% 182 12/22/2023 10,0 8.3 $31.00 18000 1.07 $950 53% $600 65% 11 Dart 4% 41 11/19/2023 2.6 11.3 $28.00 20000 1.25 $1,050 63% $600 19% Prat 20% 54 12/3/2023 39 10.8 $27.00 18000 1.21 $1,050 62% $600 19% COMP-XM @ INQUIRER Page 8 COOKIE SETTINGSTOP Round 0 INQUIRER Dec. 31 2023 Market Share Report Riya Singh Units Sold vs Demand Market Share 60% 8,000 7,000 50% 6,000 40% 5,000 30% 4,000 3,000 20% 2,000 10% 1,000 0% 0 Andrews Core Elite Baldwin Chester Digby Thrift Nano Thrift Core Nano Elite O Industry Unit Sales Total Unit Demand Actual Market Share in Units Potential Market Share in Units Total Thrift Core Nano Elite Total Thrift Core Nano Elite 3,648 18,902 Industry Unit Sales 5,101 5, 10: 6,676 3,476 6,676 3,648 3,476 18,902 Units Demanded 27.0% 35.3% 19.3% 18.4% 00.0% o of Market 27.0% 35.3% 19.3% 18.4% 100.0% o of Market 4.4% 17.6% 4.1% 4 4% 17.6% 1, 1% Aft Aft 7.8% 7.1% 16.5% 7.9% 7.2% Agape 16.3% Agape 8.8% 9.7% Abby 17.9% 8.1% 8.8% 9.5% Abby 18.4% 8.1% .7.3% 8.4% 4.9% 17.39 8.4% 4.9% Adam Adam 25.7% 29.8% 34.7% 25.6% Total 16.5% 26.3% 29.8% 34.7% 25.9% Total 16.3% 9. 1% Bid 20.4% 10.39 9.2% 10.2% Bid 20.3% 11.0% 22.2% 10.8% 10.1% 20.59 10.0% Bold Bold 3.7% Buddy 0.8% 12.7% 5.2% 3.7% Buddy 0.8% 12.7% 5.2% 10.4% 3,2% 1.1% 6.5% 10.4% 3.2% Bat 0. 1% 5.5% Bat 19.2% 26.0% Total 31.3% 33.2% 19.2% 15.6% 26.8% Total 30.5% 31.8% 15.6% 5.9% 6.2% 11.8% 6.0% 6.1% 1 1.8% 8.1% 8.1% cid Cid 9.9% 2.3% Coat 2.5% 9.9% 2.3% Coat 2.5% 18.1% 5.1% Cure 18.1% 8.6% 5.1% Cure 8.6% 7, 1% 7.4% 4.6% 7.1% 7.4% 1. 6% Camp Camp 6.1% 39.5% 44.1% 17.9% Total 6.2% 39.5% 44.1% 17.9% Total 7. 1% Duck 23.0% 2.3% 7.0% Duck 23.2% 2.3% Dot 27.2% 4:0% 8.8% Dot 27.5% 4.0% 3.8% 5.8% 1.4% 14.3% 5.0% 1.6% 6.7% Drat 1.4% 14.7% 5.0% 1.6% Drat 0,9% 14.4% 6.6% 4.0% 7.4% Dart 0.9% 14.8% 6.6% 4.0% 7.5% Dart 11.6% 5.6% 29.8% Total 53.0% 35.8% 11.6% 5.6% 30.2% Total 52.4% 35.0% Page 9 COMP-XM@ INQUIRER COOKIE SETTINGSTOP Round 0 Riya Singh Dec. 31 2023 Perceptual Map INQUIRER 20 18 16 Agape 14 Duck 12 Drat 'Coats cid CAft .~ 10 .Buddy -Adam 10 12 14 16 18 20 Performance Chester Andrews Baldwin Revised Pfmn Size Name Size Name Revised Name Pfmn size Revised Pfmn 6/27/2024 Cid 8.9 94 1 1/12/2023 5.5 14.6 Aft 12 9.6 11/14/2023 Bid 4/13/2021 Bold 120 11/30/2023 Coat 12.1 10.2 12/13/2023 Agape 14.9 10.5 7.6 12/22/2023 12/10/2022 Buddy 0.0 8.3 12/22/2023 Cure Abby 7.9 12.2 11/5/2023 12.5 9.6 12/5/2023 12.0 10.1 Camp Adam 10.6 7.6 11/9/2023 Bat Digby Name Pfmn Size Revised Duck 6.3 13.8 12/11/2023 Dot 5.5 13.6 12/19/2023 12/3/2023 Drat 8.9 10.8 Dart 9.6 11.3 11/19/2023 Page 10 COMP-XM@ INQUIRER COOKIE SETTINGSTOP Round 0 HR/TOM Report INQUIRER Riya Singh Dec. 31 2023 Human Resources Summary Andrews Baldwin Chester Digby Jeeded Complement 804 398 483 539 Complement 804 398 483 539 1st Shift Complement 525 260 371 316 2nd Shift Complement 279 138 1 12 223 Overtime % 0.0% 0.0% 0.0% 0.0% Turnover Rate 10.0% 5.6% 10.0% 3.2% New Employees 140 54 92 112 Separated Employees 0 0 Recruiting Spend $5,000 $2,500 Training Hours 80 40 Productivity Index 100.0% 117.6% 100.0% 109.4% Recruiting Cost $140 $324 $92 $390 Separation Cost $0 $0 $0 Training Cost $0 $637 $0 $431 Total HR Admin Cost $140 $962 $92 $821 Labor Contract Next Year Wages $25.53 $25.53 $25.53 $25.53 Benefits 2,500 2,500 2,50 2,500 Profit Sharing 2.0% 2.0% 2.0% 2.0% Annual Raise 5.0% 5.0% 5.0% 5.0% TOM Summary Andrews Baldwin Chester Digby Process Mgt Budgets Last Year CPI Systems $0 Vendor/jIT $0 Quality Initiative Training 8 8 8 8 8 8 8 8 8 8 8 2 Channel Support Systems 8 8 8 8 8 8 8 8 Concutrent Engineering JNEP Green Programs TOM Budgets Last Year Benchmarking Quality Function Deployment Effort 8 8 8 8 8 8 8 8 8 8 8 CCE/6 Sigma Training 8 8 8 8 8 GEMI TOEM Sustainability Initiatives 8 8 Total Expenditures Cumulative Impacts Material Cost Reduction 0.00% 0.00% 0.00% 0.00% abor Cost Reduction 0.00% 0.00% 0.00% 0.00% Reduction R&D Cycle Time 0.00% 0.00% 1.00% 0.00% Reduction Admin Costs 0.00% 0.00% .00% 0.00% Demand Increase 0.00% 0.00% 0.00% 0.00% COMP-XM @ INQUIRER Page 11 OOKIE SETTINGSPRINT Annual Report TOP Round 0 Annual Report Andrews C5 9559 Dec. 31 2023 Balance Sheet ASSETS 2023 2022 DEFINITIONS: Common Size: The common size column simply represents each item as a Common Size percentage of total assets for that year. Cash: Your Cash $31,543 25.5% $31,910 end-of-year cash position. Accounts Accounts Receivable $13,421 10.9% $13,445 Receivable: Reflects the lag between delivery and Inventory $26,149 21.2% $14,796 payment of your products. Inventories: The current value of your in cross all products. A Total Current Assets $71,113 57.6% $60, 151 ero indicates your company stocked out. Unmet Plant & Equipment $96,824 78.4% $93,304 demand would, of course, fall to your competitors. Plant & Equipment: The current value of your Accumulated Depreciation ($44,409) 36% ($37,954) plant. Accum Depreci The total accumulated Total Fixed Assets $52,415 12.4% $55,350 depreciation from your plant. Accts Payable: Total assets $123,527 100% 115,500 What the company currently owes suppliers for materials and services. Current Debt: The debt LIABILITIES & OWNERS' EQUITY he company is obligated to pay during the next year Accounts Payable $9, 516 7.70% $8, 781 of operations. It includes emergency loans used to $15,717 $5,725 keep your company solvent should you run out of Current Debt 12.7% cash during the year. Long Term Debt: The Long Term Debt $27,209 22% $34,742 company's long term debt is in the form of bonds, and Total Liabilities $52,442 42.5% $49,248 this represents the total value of your bonds. Common Stock $12,080 9.8% Common Stock: The amount of capital invested $12,443 by shareholders in the company. Retained Retained Earnings $59,004 47.8% $53,808 Earnings: The profits that the company chose to Total Equity $71,084 57.5% $66,251 keep instead of paying to shareholders as dividends. Total Liab. & O. Equity $123,527 100% 115,500 Cash Flow Statement Cash Flows from Operating Activities: 2023 2022 The Cash Flow Statement examines what happened in the Cash Account during the year. Cash injections appear as positive numbers and Net income (Loss) $20, 101 $21,787 cash withdrawals as negative numbers. The Cash Flow Statement is an Depreciation $6,455 $6,220 excellent tool for diagnosing emergency loans. When negative cash flows Extraordinary gain/losses/writeoffs $0 $0 exceed positives, you are forced to seek emergency funding. For example, $735 2,083 f sales are bad and you find yourself carrying an abundance of excess Accounts Payable inventory, the report would show the increase in inventory as a huge Inventory ($11,353) ($4,044) negative cash flow. Too much unexpected inventory could outstrip your Accounts Receivable $23 ($2,891) inflows, exhaust your starting cash and force you to beg for money to keep your company afloat. Net cash from operations $15,962 $23,15 Cash Flows from Investing Activities: Cash Flow Summary Andrews Plant Improvements ($3,520) ($1,820) 20k Cash Flows from Financing Activities: Dividends paid ($13,333) ($7,949) Sales of Common Stock $0 10K Purchase of Common Stock ($1,935) ($541) Cash from long term debt $0 Retirement of long term debt ($7,533) $0 Change in current debt (net) $9,992 ($2,070) Net cash from financing activities ($12,809) ($10,559) Net change in cash position ($367 ) $10,776 -10k Closing cash position $31,543 $31,910 -20k Operations . Investment . Finance . Chg. Cash Annual Report Page 1 OOKIE SETTINGSRound 0 Annual Report Andrews C59559 Dec. 31 2023 2023 Income Statement Product Name Aft Agape Abby Adam Na Na Na Na Total Common Size Sales 32,408 35,573 58,475 36,835 0 Q 0 163,291 100% Variable Costs: Direct Labor 7,613 10,805 16,283 9,424 0 Q 0 44,125 27% Direct Material 12,553 11;537 21,869 14,345 0 Q 0 60,305 36.9% Inventory Carry 586 1,491 135 826 0 Q 0 3,138 1.9% Total Variable 20,852 23,832 358,288 24,596 0 Q 0 107,568 65.9% Contribution Margin 11,556 11,741 20,187 12,239 0 0 0 55,723 34.1% Period Costs: Depreciation 1,047 2,260 2,080 1,068 0 0 0 6,455 4% RE&D 881 0 0 869 0 0 0 1,750 1.1% Promotions 1,200 1,200 1,200 1,200 0 QO 0 4,800 2.9% Sales 1,000 2,000 1,000 1,000 0 0 0 5,000 31% Admin 2585 280 460 290 0 QO 0 1,283 0.8% Total Period 4,382 5,740 4,740 4,426 0 0 0 19,288 11.8% Met Margin 7,173 5,001 15,448 7,813 0 0 0 36,435 22.3% s % Other $29 0% Definitions: Sales: Unit sales times list price, Direct Labor: Labor costs incurred ? to produce the product that was sold. Inventory Carry Cost: the cost to carry unsold EBIT $36,406 22.3% goods ininventory. Depreciation: Calculated on straight-line 15-year depreciation of Short Term Interest 41,493 0.9% plant value, R&D Costs: R&D department expenditures for each product. Admin: & Long Term Interest $3,357 21% Administration overhead is estimated at 1.5% of sales, Promotions: The promation budget for each product. Sales: The sales force budget for each product. Other: Taxes $11,045 6.8% Charges not included in other categories such as Fees, Write Offs, and TOM. The fees Profit Sharing 4410 0.3% include money paid ta investment bankers and brokerage firms to issue new stocks or : i 3 . . Net Profit $20,101 12.3% bonds plus consulting fees your instructor might assess. Write-offs include the loss you might experience when you sell capacity or liguidate inventory as the result of eliminating a production line, If the amount appears as a negative amount, then you actually made Va riables Marg | ns money on the liquidation of capacity orinventory. EBIT: Earnings Before Interest and o Taxes. Short Term Interest: Interest expense based on last year's current debt, ' including short term debt, long term notes that have become due, and emergency loans, Long Term Interest: Interest paid on outstanding bonds, TaXes: Income tax based upon a 35% tax rate. Profit Sharing: Profits shared with employees under the labor 30% contract. Net Profit: EBIT minus interast, taxes, and profit sharing. 20% 10% 0% 0 Aft @ Agape Abby Adam @ NA NA NA @ NA COOKIE SETTING Profit History Market Share History 25,000 40% $20,000 30% $15,000 20% $10,000 10% $5,000 $0 0% 2019 2020 2021 6 2022 2023 2019 2020 2021 2022 2023 ROE History Asset Turnover History 40% 1.5 1.3 30% 1.0 20% 0.8 0.5 10% 03 0% 0.0 2019 2020 2021 2022 2023 2019 2020 2021 2022 2023 ROS History ROA History 15% 20% 12.5% 15% 10% 7.5% 10% 50% 2.5% 0% 0% 2019 2020 2021 2022 2023 2019 2020 2021 2022 2023 COOKIE SETTINGS\fPRINT Annual Report TOP Round O Annual Report Baldwin C5 9559 Dec. 31 2023 Balance Sheet ASSETS 2023 2022 DEFINITIONS: Common Size: The common size column simply represents each item as a Common Size percentage of total assets for that year. Cash: Your Cash $32,632 25.9% $26,342 end-of-year cash position. Accounts Accounts Receivable $9,77 7.8% $8,812 Receivable: Reflects the lag between delivery and Inventory $6,437 5. 1% $7,920 payment of your products. Inventories: The current value of your in cross all products. A Total Current Assets $48,842 38.8% $43,074 ero indicates your company stocked out. Unmet Plant & Equipment $124,400 98.8% $97,758 demand would, of course, fall to your competitors. Plant & Equipment: The current value of your Accumulated Depreciation ($47,289) 37.5% ($38,996) plant. Accum Depreci The total accumulated Total Fixed Assets $77,111 51.20% $58, 762 depreciation from your plant. Accts Payable: Total assets 125,952 100% 101,836 What the company currently owes suppliers for materials and services. Current Debt: The debt LIABILITIES & OWNERS' EQUITY the company is obligated to pay during the next year Accounts Payable $5,797 4.6% $5, 189 of operations. It includes nergency loans used to Current Debt $25,558 0.3% $15,831 keep your company solvent should you run out of cash during the year. Long Term Debt: The Long Term Debt $41,354 32.8% $31,615 company's long term debt is in the form of bonds, and Total Liabilities $72,709 57.7% $52,635 this represents the total value of your bonds. Common Stock $14,328 11.4% 14,328 Common Stock: The amount of capital invested by shareholders in the company. Retained Retained Earnings $38,915 30.9% $34,873 Earnings: The profits that the company chose to Total Equity $53,243 42.3% $49,201 keep instead of paying to shareholders as dividends. Total Liab. & O. Equity $125,952 100% 101,836 Cash Flow Statement Cash Flows from Operating Activities: 2023 2022 The Cash Flow Statement examines what happened in the Cash Account during the year. Cash injections appear as positive numbers and Net income (Loss) $10,205 $10,587 cash withdrawals as negative numbers. The Cash Flow Statement is an Depreciation $8,293 $6,517 excellent tool for diagnosing emergency loans. When negative cash flows Extraordinary gain/losses/writeoffs ($3) exceed positives, you are forced to seek emergency funding. For example, f sales are bad and you find yourself carrying an abundance of excess Accounts Payable $608 $796 inventory, the report would show the increase in inventory as a huge Inventory $1,483 $1,744 negative cash flow. Too much unexpected inventory could outstrip your Accounts Receivable ($961) ($1,879) inflows, exhaust your starting cash and force you to beg for money to keep your company afloat. Net cash from operations $19,628 $17,762 Cash Flows from Investing Activities: Cash Flow Summary Baldwin Plant Improvements ($26,642) ($2,800) 30k Cash Flows from Financing Activities: Dividends paid ($6,163) ($4,256) 20k Sales of Common Stock $0 Purchase of Common Stock $0 10k Cash from long term debt $15,690 $0 Retirement of long term debt ($5,951) ($1,580) Change in current debt (net) $9,728 ($6,017) Net cash from financing activities $13,304 ($11,853) 10k Net change in cash position $6,290 $3, 109 Closing cash position $32,632 $26,342 20K -30k Operations . Investment . Finance . Chg. Cash Annual Report Page 1 OOKIE SETTINGSAnnual Report Baldwin C59559 2023 Income Statement Product Name Bid Bold Buddy Bat Na Na Na Na Total Sales 34,598 41,476 21,689 21,136 0 0 Q 0 118,899 Variable Costs: Direct Labor 4,874 10,609 4,401 4,326 0 0 Q 0 24,211 Direct Material 12,102 18,096 AT T 8,423 0 0 Q 0 47,798 Inventory Carry 26 26 375 346 0 0 0 0 772 Total Variable 17,003 28,731 13,952 13,095 0 0 Q 0 72,781 Contribution Margin 17,595 12,745 T3 8,041 0 0 0 0 46,118 Period Costs: Depreciation 2,800 2,607 1,500 1,387 0 0 0 0 8,293 RE&D 1,000 928 288 857 0 0 0 0 3,712 Promotions Q50 S50 S50 950 0 0 QO 0 3,800 Sales 1,000 1,000 500 1,300 0 a 0 0 3,900 Admin 522 6256 327 319 0 0 QO 0 1,794 Total Period 6,272 6,110 4,365 4,813 0 a 0 0 21,559 Met Margin 11,323 5,635 3,372 3,228 0 0 0 0 24,559 e