

Question: Page 180 #5-35 Using this data, do the following ( do not answer book questions, use my folliowing questions ) 1) compute Centered Moving Average
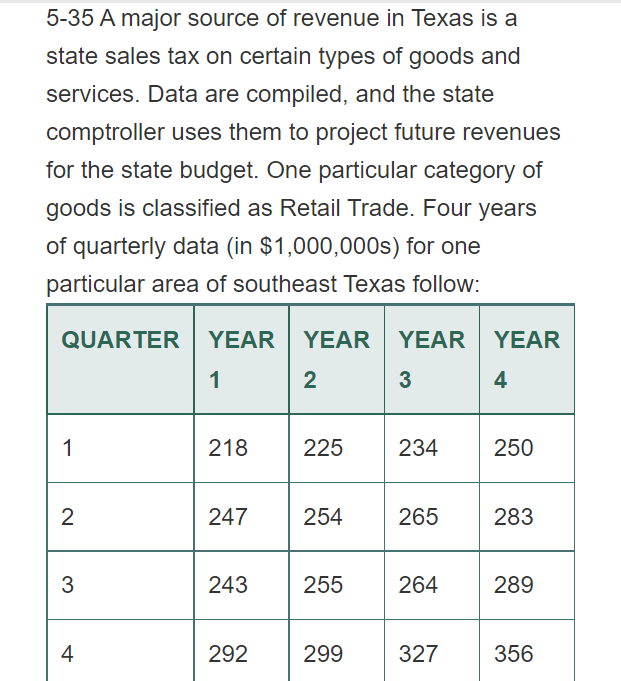
Page 180 #5-35 Using this data, do the following (do not answer book questions, use my folliowing questions) 1) compute Centered Moving Average (because has a trend.... note: must know 2) Compute the seasonal ratios; 3) Compute seasonal indices for each quarter, and 4) write a paragraph analyzing the results in referring back to the context of the story in the textbook ie what are your suggestions for the state comptroller of Texas. Then::: 5) assuming the sales estimates for Year 5 are $370 for Qtr 1, $395 for Qtr 2, $427 for Qtr 3, and $600 for Qtr 4 (in &millions) for the respective quarters before adjusting for seasonality, compute a seasonalized or adjusted sales forecast for these quarters.
Page 183 Using Table 5.13 from the case study section, do the following 1) compute Centered Moving Average (because has a trend.... note: must know) and seasonal ratios (note: each month is a season ie like a quarter, so 12 seasons); 2) Compute seasonal indices for each month, and 3) write a paragraph analyzing the results in the case story context (again, if you need more hand/paper practice to prepare for the exam, feel free to do as well).
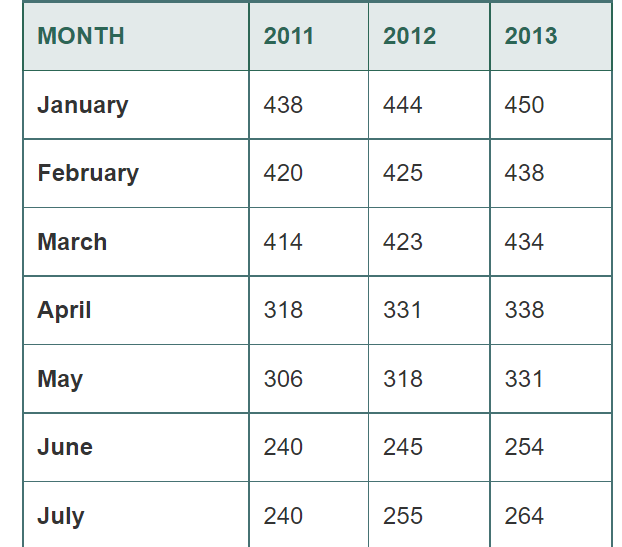
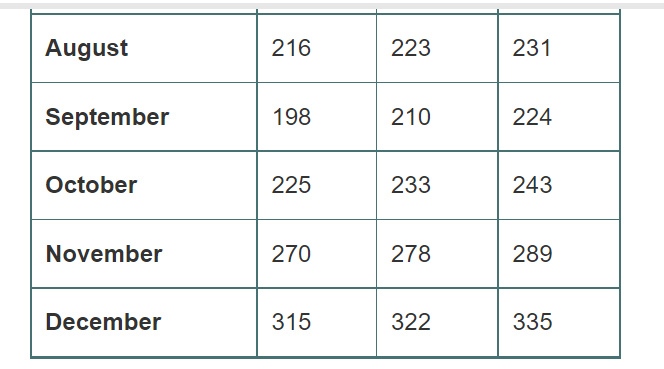
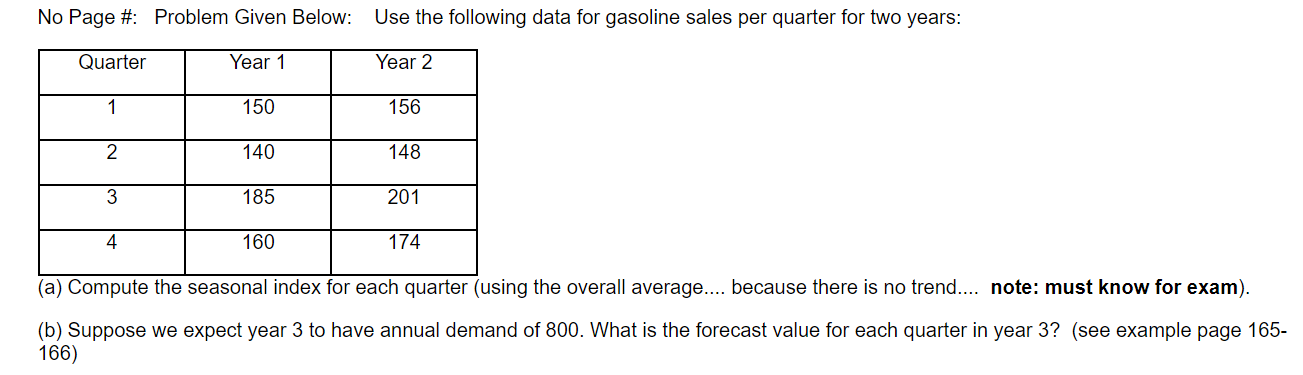
5-35 A major source of revenue in Texas is a state sales tax on certain types of goods and services. Data are compiled, and the state comptroller uses them to project future revenues for the state budget. One particular category of goods is classified as Retail Trade. Four years of quarterly data (in $1,000,000s) for one particular area of southeast Texas follow: QUARTER YEAR YEAR YEAR YEAR 1 2 3 4 1 218 225 234 250 N 247 254 265 283 3 243 255 264 289 4 292 299 327 356 MONTH 2011 2012 2013 January 438 444 450 February 420 425 438 March 414 423 434 April 318 331 338 May 306 318 331 June 240 245 254 July 240 255 264 August 216 223 231 September 198 210 224 October 225 233 243 November 270 278 289 December 315 322 335 No Page #: Problem Given Below: Use the following data for gasoline sales per quarter for two years: Quarter Year 1 Year 2 1 150 156 2 140 148 3 185 201 4 160 174 (a) Compute the seasonal index for each quarter (using the overall average.... because there is no trend.... note: must know for exam). (b) Suppose we expect year 3 to have annual demand of 800. What is the forecast value for each quarter in year 3? (see example page 165- 166)
Step by Step Solution
There are 3 Steps involved in it

Get step-by-step solutions from verified subject matter experts