

Question: ? A7. Note 13 provides information on Target's current assets. Assume all prepaid expenses are for prepaid insurance and that insurance expense comprises $50 million
?
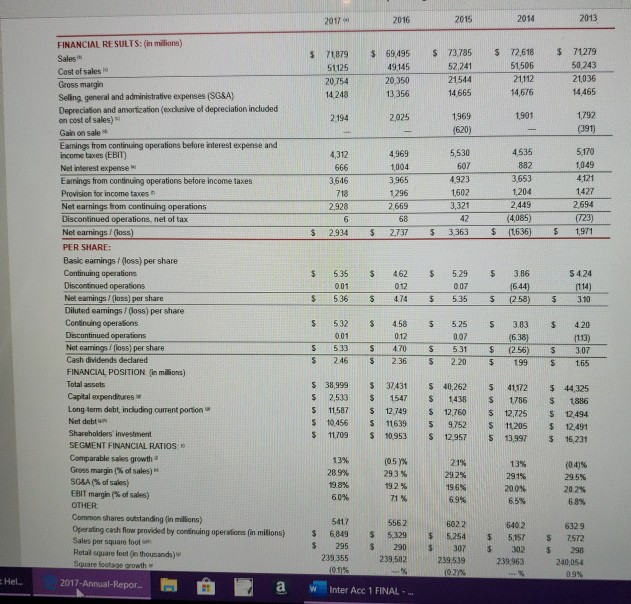
A7. Note 13 provides information on Target's current assets. Assume all prepaid expenses are for prepaid insurance and that insurance expense comprises $50 million of the $14,248 million of selling, general, and administrative expenses reported in the income statement for the year ended February 3, 2018. How much cash did Target pay for insurance coverage during the year? Prepare the adjusting entry Target would make to record all insurance expense for the year. What would be the effect on the income statement and balance sheet if Target didn't record an adjusting entry for prepaid expenses? A8. By what name does Target label its balance sheet? Hel... FINANCIAL RESULTS: (in millions) Sales Cost of sales Gross margin Selling general and administrative expenses (SG&A) Depreciation and amortization (exclusive of depreciation included on cost of sales) Gain on sale Earnings from continuing operations before interest expense and income taxes (EBIT) Net interest expense Earnings from continuing operations before income taxes. Provision for income taxes Net earnings from continuing operations Discontinued operations, net of tax Net earnings/(loss) PER SHARE: Basic earnings / (loss) per share Continuing operations Discontinued operations Net earnings / (loss) per share Diluted earnings / (loss) per share Continuing operations Discontinued operations Net earnings/(loss) per share Cash dividends declared FINANCIAL POSITION: (in millions) Total assets Capital expenditures Long term debt, including current portion Net debt w Shareholders' investment SEGMENT FINANCIAL RATIOS Comparable sales growth Gross margin (% of sales) SG&A (% of sales) EBIT margin (% of sales) OTHER Common shares outstanding (in millions) Operating cash flow provided by continuing operations (in millions) Sales per square foot Retail square feet (in thousands) Square footage growth 2017-Annual-Repor.. a $ 71,879 51125 20,754 14,248 $ $ $ S $ 2017 $ S 2,194 $ $ 4,312 666 3,646 718 2,928 6 2,934 5.35 001 5.36 38,999 2,533 S 11,587 $ 10,456 $ 11,709 $ 5.32 0.01 5.33 $ 2.46 $ 13% 28.9% 19.8% 6.0% 5417 6,849 295 239,355 (0.1)% $ 69,495 49,145 20,350 13,356 2,025 $ 2016 68 $ 2,737 $ $ 4.62 012 4.74 $ 4,969 1,004 3,965 1,296 2,669 s n 4.58 0.12 4.70 2.36 $ 37,431 $ 1547 $ 12,749 $ 11639 $ 10,953 (0.5)% 29.3 % 19.2 % 71% 5562 $ 5,329 $ 290 239,502 % Inter Acc 1 FINAL... $ 73,785 52,241 21544 14.665 S $ 5 2015 1,969 (620) 5,530 607 $ $ 4,923 1602 3,321 42 3,363 5.25 0.07 S 5.31 $ 2.20 5.29 0.07 5.35 $ 40,262 $ 1,438 $ 12,760 S 9,752 12,957 $ 21% 29.2% 19.6% 6.9% 602.2 5,254 307 239,539 (0.21% $ $ 72,618 51,506 21,112 14,676 S $ $ $ $ VA 55 S 2014 $ 1,901 41172 1,786 S 12,725 $ 11,205 S 13,997 4,535 882 3,653 1,204 2,449 (4,085) (1,636) - 3.86 (6.44) (2.58) 3.83 (6.38) (2.56) 1.99 13% 29.1% 20.0% 6.5% 640 2 5,157 302 239.963 $ $ 71279 50,243 21,036 14,465 $ $ $ 2013 S $ 1,792 (391) 5,170 1,049 4,121 1,427 2,694 (723) $4.24 (114) 3.10 4.20 (113) 3.07 1.65 $ 44,325 $ 1,886 S 12,494 $ 12,491 $ 16,231 (0.4)% 29.5% 20.2% 6.8% 6329 7,572 298 240,054 0.9%
Step by Step Solution
There are 3 Steps involved in it
Date Accounts Titles and Explanation Debit Credit Feb 3 ... View full answer

Get step-by-step solutions from verified subject matter experts