

Page > of 3 MP 4: Lorenz Curve, Gini Index, Robin Hood Index Economists have long...
Fantastic news! We've Found the answer you've been seeking!
Question:
Transcribed Image Text:
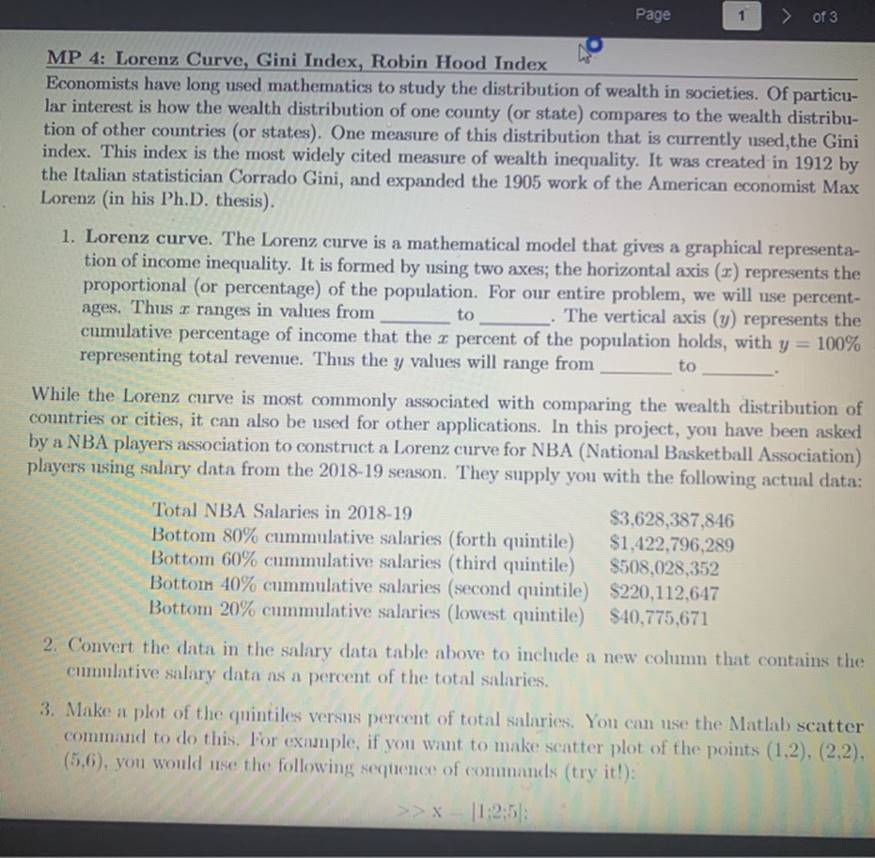
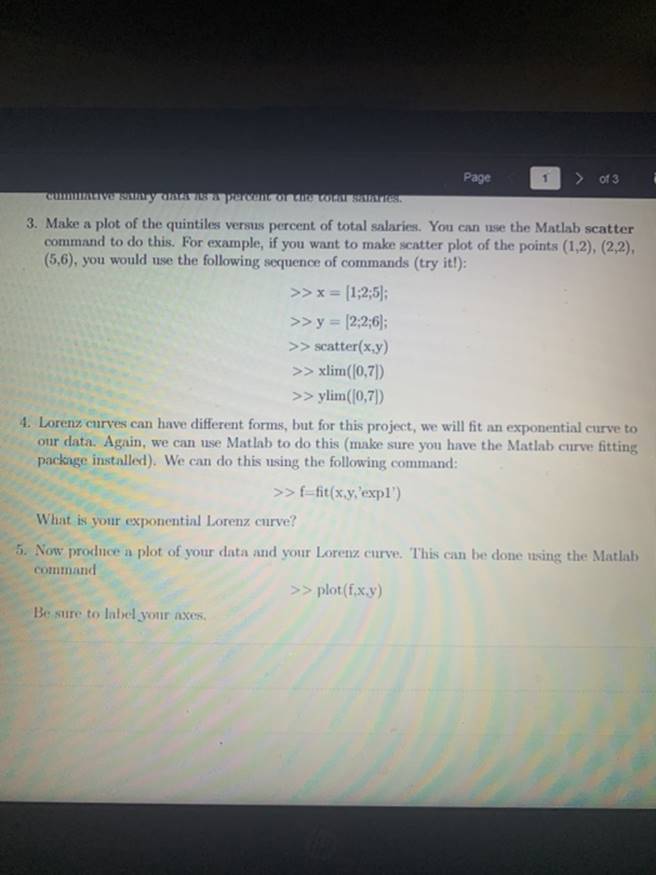
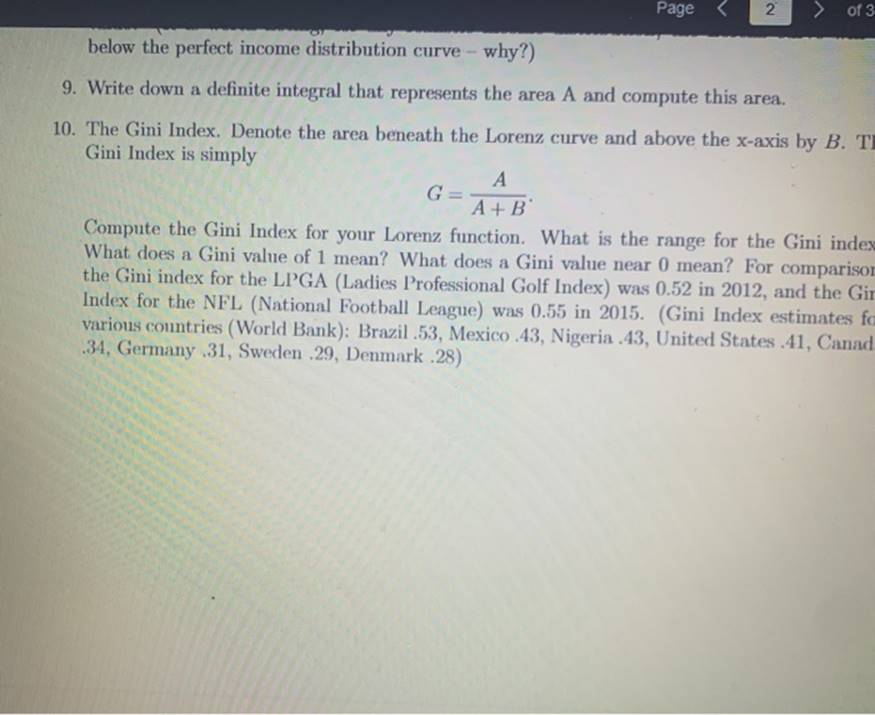
Page > of 3 MP 4: Lorenz Curve, Gini Index, Robin Hood Index Economists have long used mathematics to study the distribution of wealth in societies. Of particu- lar interest is how the wealth distribution of one county (or state) compares to the wealth distribu- tion of other countries (or states). One measure of this distribution that is currently used,the Gini index. This index is the most widely cited measure of wealth inequality. It was created in 1912 by the Italian statistician Corrado Gini, and expanded the 1905 work of the American economist Max Lorenz (in his Ph.D. thesis). 1. Lorenz curve. The Lorenz curve is a mathematical model that gives a graphical representa- tion of income inequality. It is formed by using two axes; the horizontal axis (r) represents the proportional (or percentage) of the population. For our entire problem, we will use percent- ages. Thus r ranges in values from cumulative percentage of income that the I percent of the population holds, with y = 100% representing total revenue. Thus the y values will range from to . The vertical axis (y) represents the to While the Lorenz curve is most commonly associated with comparing the wealth distribution of countries or cities, it can also be used for other applications. In this project, you have been asked by a NBA players association to construct a Lorenz curve for NBA (National Basketball Association) players using salary data from the 2018-19 season. They supply you with the following actual data: Total NBA Salaries in 2018-19 Bottom 80% cummulative salaries (forth quintile) Bottom 60% cummulative salaries (third quintile) Bottom 40% cummulative salaries (second quintile) $220,112,647 Bottom 20% cmmulative salaries (lowest quintile) $40,775,671 $3,628,387,846 $1,422,796,289 $508,028,352 2. Convert the data in the salary data table above to include a new column that contains the cumulative salary data as a percent of the total salaries. 3. Make a plot of the quintiles versus percent of total salaries. You can use the Matlab scatter command to do this. For example, if you want to make scatter plot of the points (1,2), (2,2), (5,6), you would use the following sequence of commands (try it!): |1:2:5: Page > of 3 cumativer ary daS8 a percen or the COrar salarrtes 3. Make a plot of the quintiles versus percent of total salaries. You can use the Matlab scatter command to do this. For example, if you want to make scatter plot of the points (1,2), (2,2), (5,6), you would use the following sequence of commands (try it!): >> x = [1;2;5); >> y = [2:2,6); >> scatter(x,y) >> xlim((0,7|) >> ylim((0,7)) 4. Lorenz curves can have different forms, but for this project, we will fit an exponential curve to our data. Again, we can use Matlab to do this (make sure you have the Matlab curve fitting package installed). We can do this using the following command: >>f-fit(x.y,'expl') What is your exponential Lorenz curve? 5. Now produce a plot of your data and your Lorenz curve. This can be done using the Matlab command >> plot(f.x.y) Be sure to label your axes, Page < 2 > of 3 below the perfect income distribution curve - why?) 9. Write down a definite integral that represents the area A and compute this area. 10. The Gini Index. Denote the area beneath the Lorenz curve and above the x-axis by B. TI Gini Index is simply A A+B Compute the Gini Index for your Lorenz function. What is the range for the Gini index What does a Gini value of 1 mean? What does a Gini value near 0 mean? For comparisor the Gini index for the LPGA (Ladies Professional Golf Index) was 0.52 in 2012, and the Gir Index for the NFL (National Football League) was 0.55 in 2015. (Gini Index estimates fo various countries (World Bank): Brazil .53, Mexico .43, Nigeria 43, United States 41, Canad. 34, Germany .31, Sweden .29, Denmark .28) Page > of 3 MP 4: Lorenz Curve, Gini Index, Robin Hood Index Economists have long used mathematics to study the distribution of wealth in societies. Of particu- lar interest is how the wealth distribution of one county (or state) compares to the wealth distribu- tion of other countries (or states). One measure of this distribution that is currently used,the Gini index. This index is the most widely cited measure of wealth inequality. It was created in 1912 by the Italian statistician Corrado Gini, and expanded the 1905 work of the American economist Max Lorenz (in his Ph.D. thesis). 1. Lorenz curve. The Lorenz curve is a mathematical model that gives a graphical representa- tion of income inequality. It is formed by using two axes; the horizontal axis (r) represents the proportional (or percentage) of the population. For our entire problem, we will use percent- ages. Thus r ranges in values from cumulative percentage of income that the I percent of the population holds, with y = 100% representing total revenue. Thus the y values will range from to . The vertical axis (y) represents the to While the Lorenz curve is most commonly associated with comparing the wealth distribution of countries or cities, it can also be used for other applications. In this project, you have been asked by a NBA players association to construct a Lorenz curve for NBA (National Basketball Association) players using salary data from the 2018-19 season. They supply you with the following actual data: Total NBA Salaries in 2018-19 Bottom 80% cummulative salaries (forth quintile) Bottom 60% cummulative salaries (third quintile) Bottom 40% cummulative salaries (second quintile) $220,112,647 Bottom 20% cmmulative salaries (lowest quintile) $40,775,671 $3,628,387,846 $1,422,796,289 $508,028,352 2. Convert the data in the salary data table above to include a new column that contains the cumulative salary data as a percent of the total salaries. 3. Make a plot of the quintiles versus percent of total salaries. You can use the Matlab scatter command to do this. For example, if you want to make scatter plot of the points (1,2), (2,2), (5,6), you would use the following sequence of commands (try it!): |1:2:5: Page > of 3 cumativer ary daS8 a percen or the COrar salarrtes 3. Make a plot of the quintiles versus percent of total salaries. You can use the Matlab scatter command to do this. For example, if you want to make scatter plot of the points (1,2), (2,2), (5,6), you would use the following sequence of commands (try it!): >> x = [1;2;5); >> y = [2:2,6); >> scatter(x,y) >> xlim((0,7|) >> ylim((0,7)) 4. Lorenz curves can have different forms, but for this project, we will fit an exponential curve to our data. Again, we can use Matlab to do this (make sure you have the Matlab curve fitting package installed). We can do this using the following command: >>f-fit(x.y,'expl') What is your exponential Lorenz curve? 5. Now produce a plot of your data and your Lorenz curve. This can be done using the Matlab command >> plot(f.x.y) Be sure to label your axes, Page < 2 > of 3 below the perfect income distribution curve - why?) 9. Write down a definite integral that represents the area A and compute this area. 10. The Gini Index. Denote the area beneath the Lorenz curve and above the x-axis by B. TI Gini Index is simply A A+B Compute the Gini Index for your Lorenz function. What is the range for the Gini index What does a Gini value of 1 mean? What does a Gini value near 0 mean? For comparisor the Gini index for the LPGA (Ladies Professional Golf Index) was 0.52 in 2012, and the Gir Index for the NFL (National Football League) was 0.55 in 2015. (Gini Index estimates fo various countries (World Bank): Brazil .53, Mexico .43, Nigeria 43, United States 41, Canad. 34, Germany .31, Sweden .29, Denmark .28)
Expert Answer:
Answer rating: 100% (QA)
1 To construct a Lorenz curve for NBA players using the salary data provided we need to calculate th... View the full answer

Related Book For 

College Mathematics For Business Economics, Life Sciences, And Social Sciences
ISBN: 978-0134674148
14th Edition
Authors: Raymond Barnett, Michael Ziegler, Karl Byleen, Christopher Stocker
Posted Date:
Students also viewed these accounting questions
-
The data in the following table describe the distribution of wealth in a country: (A) Use quadratic regression to find the equation of a Lorenz curve for the data. (B) Use the regression equation and...
-
In this problem we will use Figure to estimate the expected return on the stock market. To estimate the expected return, we will create a list of possible returns and we will assign a probability to...
-
In this problem we will use Fig to estimate the expected return on the stock market. To estimate the expected return, we will create a list of possible returns and we will assign a probability to...
-
Verify that (x, y) = tan 1 y/x is harmonic using both the rectangular and polar expressions for .
-
On December 31, 2014, when the market interest rate is 6%, OBrien Realty issues $ 800,000 of 7.25%, 10-year bonds payable. The bonds pay interest semiannually. OBrien Realty received $ 874,662 in...
-
What are the five principal categories of check tampering?
-
Water flows through the Pelton wheel turbine shown in Fig. 12.25. For simplicity we assume that the water is turned \(180^{\circ}\) by the blade. Show, based on the energy equation (Eq. 5.84), that...
-
On January 1, 2017, Bill Inc. leases manufacturing equipment from Beatrix Corporation. The lease covers seven years and requires annual lease payments of $51,000, beginning on January 1, 2017. The...
-
Write a Javascript program to display the list of Student names whose name starts with 'A' For example, you have an array of students names Khadija Ali ahmed List of name starts with alphabet 'A' or...
-
You are meeting with executives of Cooper Cosmetics Corporation to arrange your firms engagement to audit the corporations financial statements for the year ending December 31. One executive suggests...
-
China Manufacturing Agents, Inc. is preparing a five-year plan. Today, sales are $1,000,000. If the sales growth rate is projected to be 10 percent over the next five years, what will be the dollar...
-
Why would a financial institution's PEP customers be required to provide documentation to evidence their source of wealth and/or income? In other words, what type of fraud would PEP clients more...
-
What is the process for entering a bill for inventory purchased in the Enter Bills window?
-
Find a formula for (45) (x) if f(x) = f(45) (x) = 1 5x1
-
Find 2021 Federal Withholding Tax for an employee in VA. Weekly Gross pay Earnings are $600, weekly 401(k) deduction of 6% and $5 charitable contribution.
-
Shown in the figure below is a two-dimensional feature space corresponding to two features, and 12, with the shaded region corresponding to a class with y = +1 and the region outside as a class with...
-
An article on the website of the Financial Post, which is published in Canada, discussed the situation of Canadian teams that play in the National Hockey League (NHL). The majority of NHL teams are...
-
Solve the relation Exz:Solve therelation ne %3D
-
In Problem discuss the validity of each statement. If the statement is true, explain why. If not, give a counter example. Vx? = |x|for all real numbers x
-
A mailing service states that a rectangular package shall have the sum of its length and girth not to exceed 120 inches (see the figure on page 838). What are the dimensions of the largest (in...
-
Using the table of probabilities shown Find P(R Z). X Y Z Totals S .10 .25 .15 .50 T .05 .20 .02 .27 R .05 .15 .03 .23 Totals .20 .60 .20 1.00
-
Basic Chemicals Ltd produces a highly flammable chemical product. The company experienced a flood on 1 April 2025 that destroyed its entire work in process inventory but did not affect the raw...
-
Cold Appliances Pty Ltd makes refrigerators and is trying to determine the cost of its ending work in process. The accountant has put together the following data for the year ended 30 June 2025. Each...
-
An apparatus for measuring thermal conductivity employs an electrical heater sandwiched between two identical samples of diameter \(25 \mathrm{~mm}\) and length \(60 \mathrm{~mm}\), which are pressed...

Study smarter with the SolutionInn App