Question: Page > of 3 Quality Tools Case Study Objective: Analyze data to solve practical problems by applying appropriate mathematical and scientific techniques & perform structured
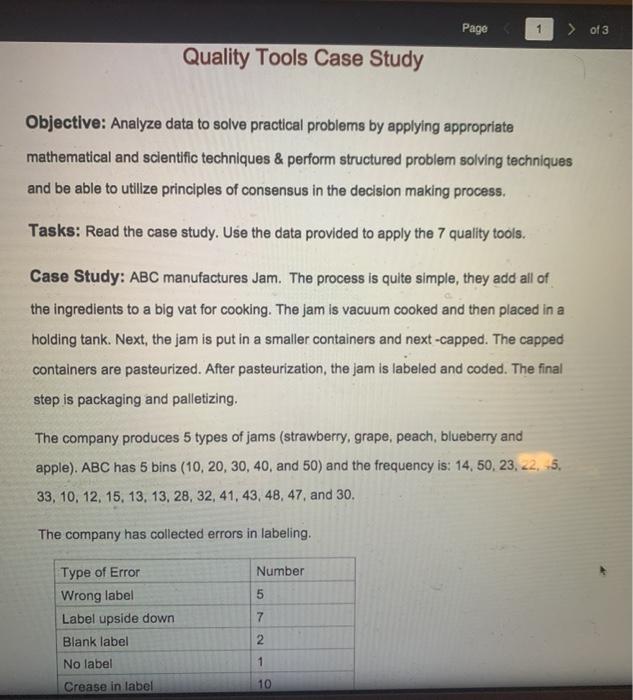
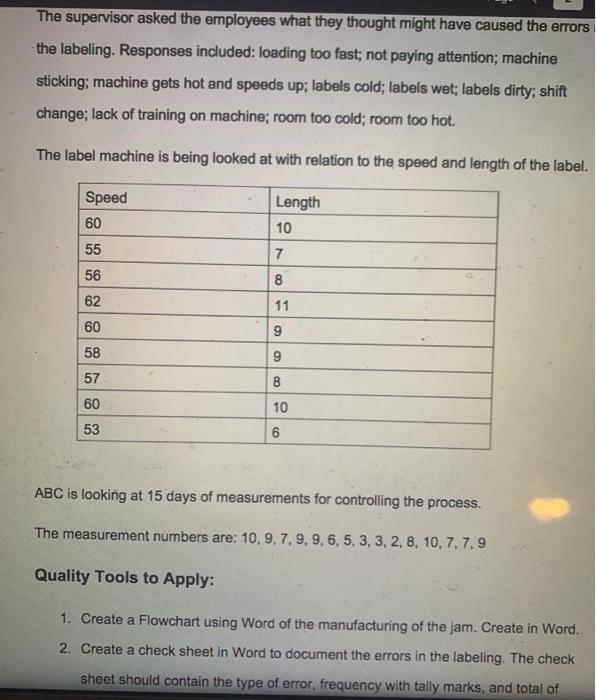
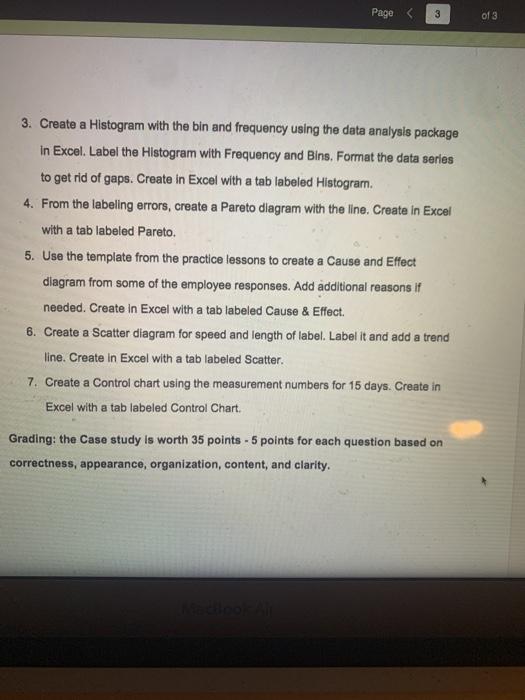
Page > of 3 Quality Tools Case Study Objective: Analyze data to solve practical problems by applying appropriate mathematical and scientific techniques & perform structured problem solving techniques and be able to utilize principles of consensus in the decision making process. Tasks: Read the case study. Use the data provided to apply the 7 quality tools. Case Study: ABC manufactures Jam. The process is quite simple, they add all of the ingredients to a big vat for cooking. The jam is vacuum cooked and then placed in a holding tank. Next, the jam is put in a smaller containers and next -capped. The capped containers are pasteurized. After pasteurization, the jam is labeled and coded. The final step is packaging and palletizing. The company produces 5 types of jams (strawberry, grape, peach, blueberry and apple). ABC has 5 bins (10, 20, 30, 40, and 50) and the frequency is: 14,50, 23, 22, 5, 33, 10, 12, 15, 13, 13, 28, 32, 41, 43, 48, 47, and 30. The company has collected errors in labeling. Number 5 7 Type of Error Wrong label Label upside down Blank label No label Crease in label 2 1 10 The supervisor asked the employees what they thought might have caused the errors the labeling. Responses included: loading too fast; not paying attention; machine sticking; machine gets hot and speeds up; labels cold; labels wet; labels dirty; shift change; lack of training on machine; room too cold; room too hot. The label machine is being looked at with relation to the speed and length of the label. Speed 60 Length 10 55 7 56 8 62 11 60 9 9 58 9 57 B 60 10 53 6 ABC is looking at 15 days of measurements for controlling the process. The measurement numbers are: 10, 9, 7, 9, 9, 6, 5, 3, 3, 2, 8, 10, 7, 7.9 Quality Tools to Apply: 1. Create a Flowchart using Word of the manufacturing of the jam. Create in Word. 2. Create a check sheet in Word to document the errors in the labeling. The check sheet should contain the type of error, frequency with tally marks, and total of Page 3 of 3 3. Create a Histogram with the bin and frequency using the data analysis package in Excel. Label the Histogram with Frequency and Bins. Format the data series to get rid of gaps. Create in Excel with a tab labeled Histogram. 4. From the labeling errors, create a Pareto diagram with the line. Create in Excel with a tab labeled Pareto. 5. Use the template from the practice lessons to create a Cause and Effect diagram from some of the employee responses. Add additional reasons if needed. Create in Excel with a tab labeled Cause & Effect. 6. Create a Scatter diagram for speed and length of label. Label it and add a trend line. Create in Excel with a tab labeled Scatter. 7. Create a Control chart using the measurement numbers for 15 days. Create in Excel with a tab labeled Control Chart. Grading: the Case study is worth 35 points - 5 points for each question based on correctness, appearance, organization, content, and clarity


