

Question: Paired Samples Statistics Std. Error Mean N Std. Deviation Mean Pair 1 Condition2 49.65 20 2.907 650 Condition1 47.20 20 3.302 .738 Paired Samples Test

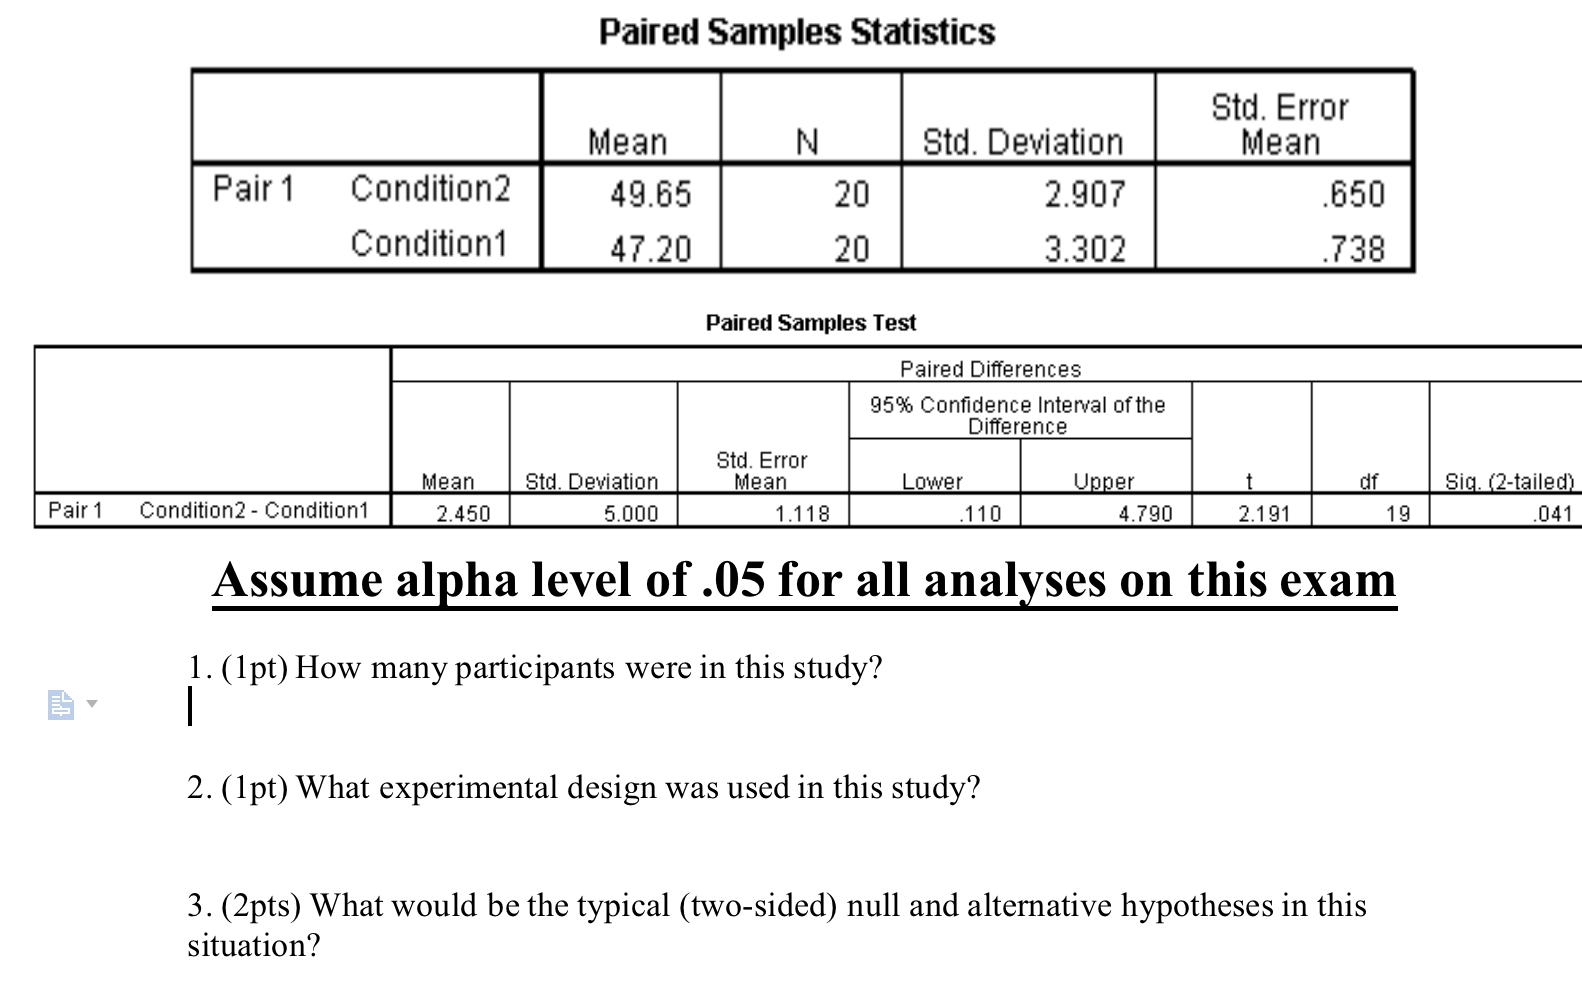

Paired Samples Statistics Std. Error Mean N Std. Deviation Mean Pair 1 Condition2 49.65 20 2.907 650 Condition1 47.20 20 3.302 .738 Paired Samples Test Paired Differences 95% Confidence Interval of the Difference Std. Error Mean Std. Deviation Mean Lower Upper df Sig. (2-tailed) Pair 1 Condition2 - Condition1 2.450 5.000 1.118 110 4.790 2.191 19 041 Assume alpha level of .05 for all analyses on this exam 1. (1pt) How many participants were in this study? 2. (1pt) What experimental design was used in this study? 3. (2pts) What would be the typical (two-sided) null and alternative hypotheses in this situation?4. (1pt) What would you conclude about the null hypothesis? 5. (1pt) What type of error might have been made? 6. (4pts) Write-up the results using formal statistical format
Step by Step Solution
There are 3 Steps involved in it

Get step-by-step solutions from verified subject matter experts