

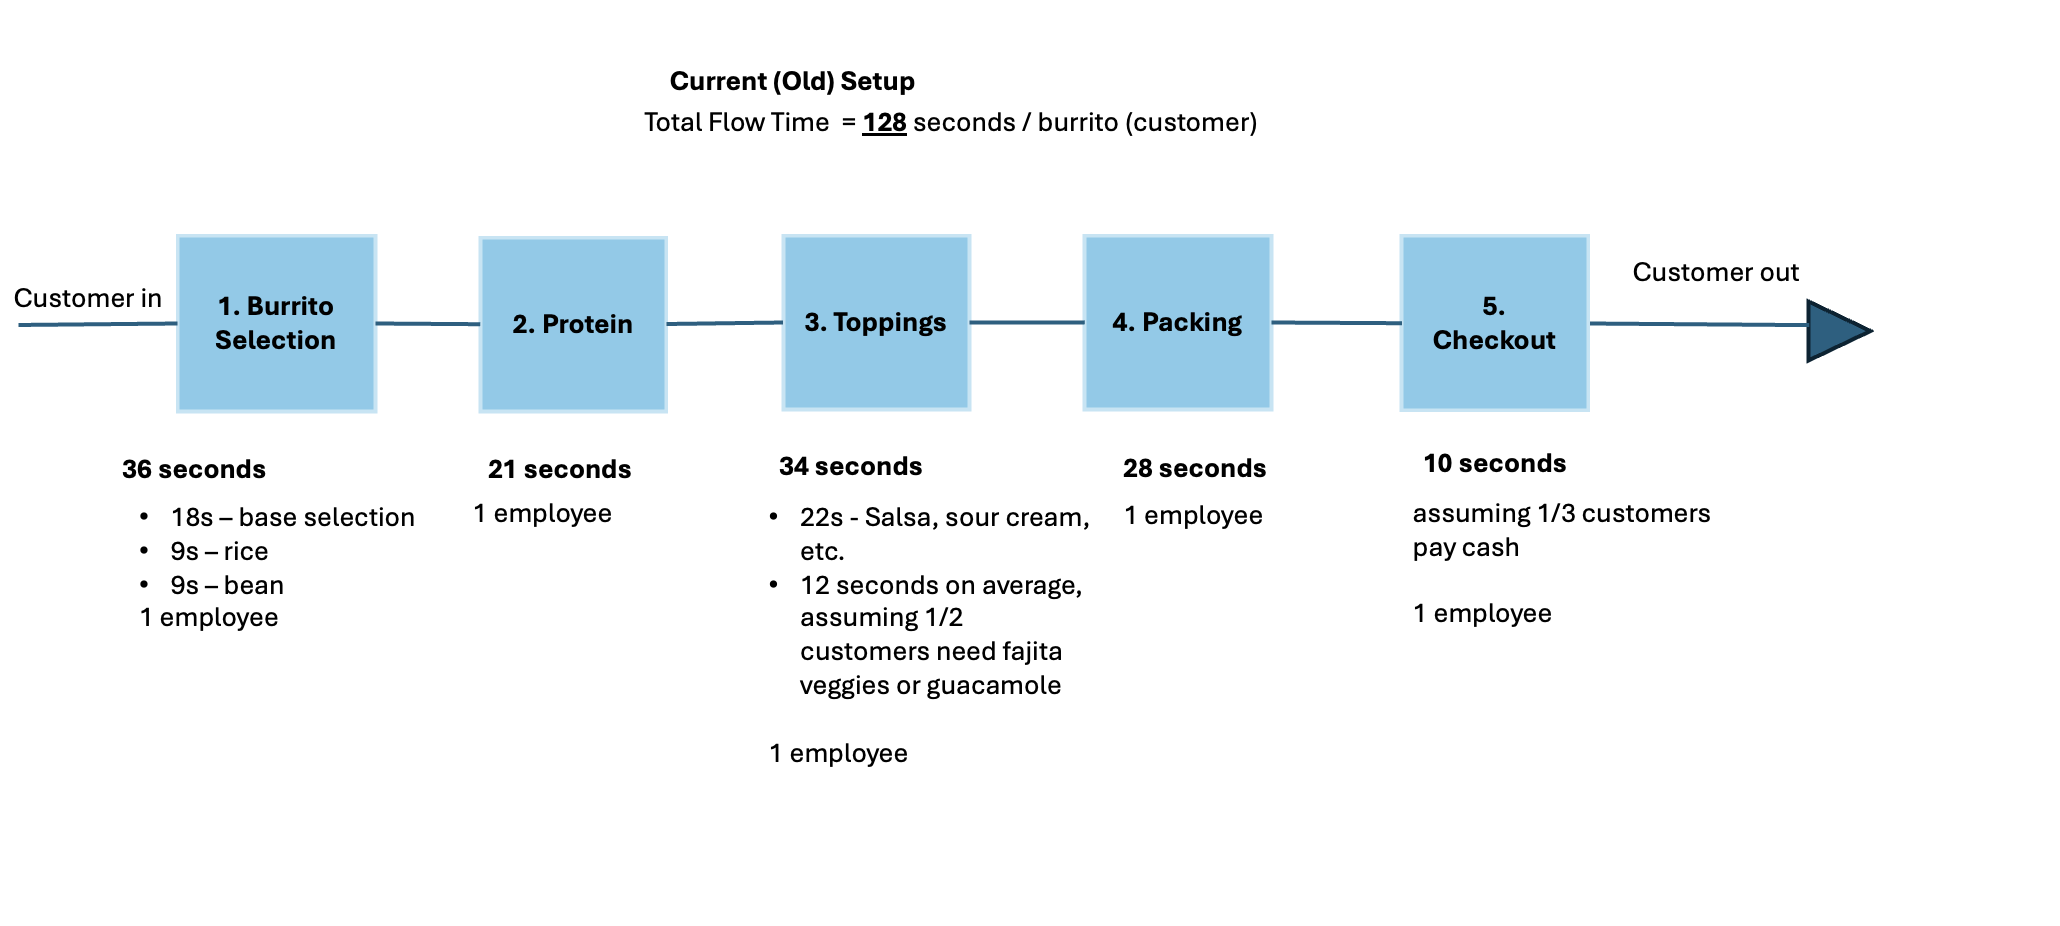
Question: pancho's burrito case study ( UVA DArden ) : currently there are 5 steps, the total flowtime being 1 2 9 seconds / burrito .
pancho's burrito case study UVA DArden : currently there are steps, the total flowtime being secondsburrito The owner wants to limit the customer wait time to minutes or less. The peak hour demand is around burritos per hour. How to improve the process to increase number of burrito produced per hour? Attached are current old set up as summarized from the case, and key case pages. Step : Checkout
The last step of the process was the customer checkout. After the order was packed and ready to go a
burrito specialist calculated the total cost of the order and received the payment from the customer. With the
current staffing plan, a dedicated burrito specialist worked the cash register. One out of three customers paid
with cash, which took an average of seconds. The remaining customers paid using credit or debit cards, and
since most transactions were under dollars, there was no need for a signature. Processing a card payment
took on average seconds per customer. Therefore, the specialist could complete a customer checkout every
seconds on average.
After about an hour of taking data, Escoba was frustrated. There was still a long line of customers. He was
pleased with the effort of his employees, but their service times were highly variable. Often, workers would
leave their stations to refill inventory needed for the production line. In addition, some workers had periods of
idle time while others were constantly busy. Escoba wanted to explore the possibility of increasing capacity by
balancing the tasks in the burritomaking process. The only constraints that limited the flexibility of balancing
the tasks were that the first step of the process had to be setting up the base and that the last two steps of the
process must be packing and then checkout.
While collecting production times, Escoba had noticed the effect that customer arrivals could have on the
line's length. Customers did not arrive in a nice, steady stream, but in clumps that tended to strain the process.
Curious to understand customer behavior and the operation of the burritomaking process as a whole, Escoba
decided to gather more data, specifically focusing on customer arrival times Exhibit Escoba hoped to use
this information to understand the effect of variability on the production process.
Next Steps
Once the restaurant closed for the night and the burrito specialists switched from making burritos to
cleaning up Escoba went back to his office. He grabbed a marker and started writing down ideas for managing
staffing at the restaurant on his whiteboard. He wondered if there might be a way to staff the restaurant
differently in order to better utilize his employees and serve more people with fewer workers, or to reduce the
number of workers during periods of lower demand. Question please breakdown this case into sub questions and show steps.
Step by Step Solution
There are 3 Steps involved in it
1 Expert Approved Answer
Step: 1 Unlock

Question Has Been Solved by an Expert!
Get step-by-step solutions from verified subject matter experts
Step: 2 Unlock
Step: 3 Unlock