

Question: Panel A and B below are two graphs extracted from previous research. The horizontal axis, serial correlation, is an indicator of illiquid portfolio holdings. Interpret
Panel A and B below are two graphs extracted from previous research. The horizontal axis, serial correlation, is an indicator of illiquid portfolio holdings. Interpret those two graphs below.
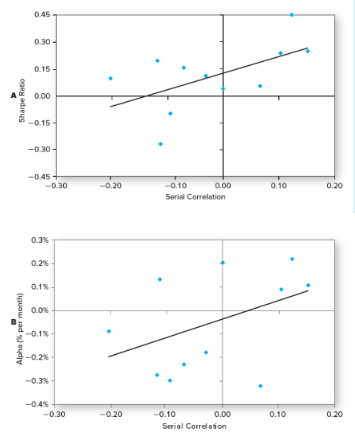
0.45 0 30 - 0.15 - 0.00 Sharpe Ratio -0.15 - OF 0- -0 45+ -0.30 -0.20 -0.10 0,00 0.10 0.20 Serial Correlation 0.3% 0.2% 0.1% 0.0% Alpha (& per month) -0.1% -0.2% -0.3% -0.4%+ -0.30 -0.20 -0.10 0.00 0.10 0.20 Serial Correlation
Step by Step Solution
There are 3 Steps involved in it
1 Expert Approved Answer
Step: 1 Unlock

Question Has Been Solved by an Expert!
Get step-by-step solutions from verified subject matter experts
Step: 2 Unlock
Step: 3 Unlock