

Question: Panel (a) Panel (b) S Price Price D. D. Quantity Quantity Panel (c) Panel (d) S, S Price Price D, D2 Quantity Quantity Refer to
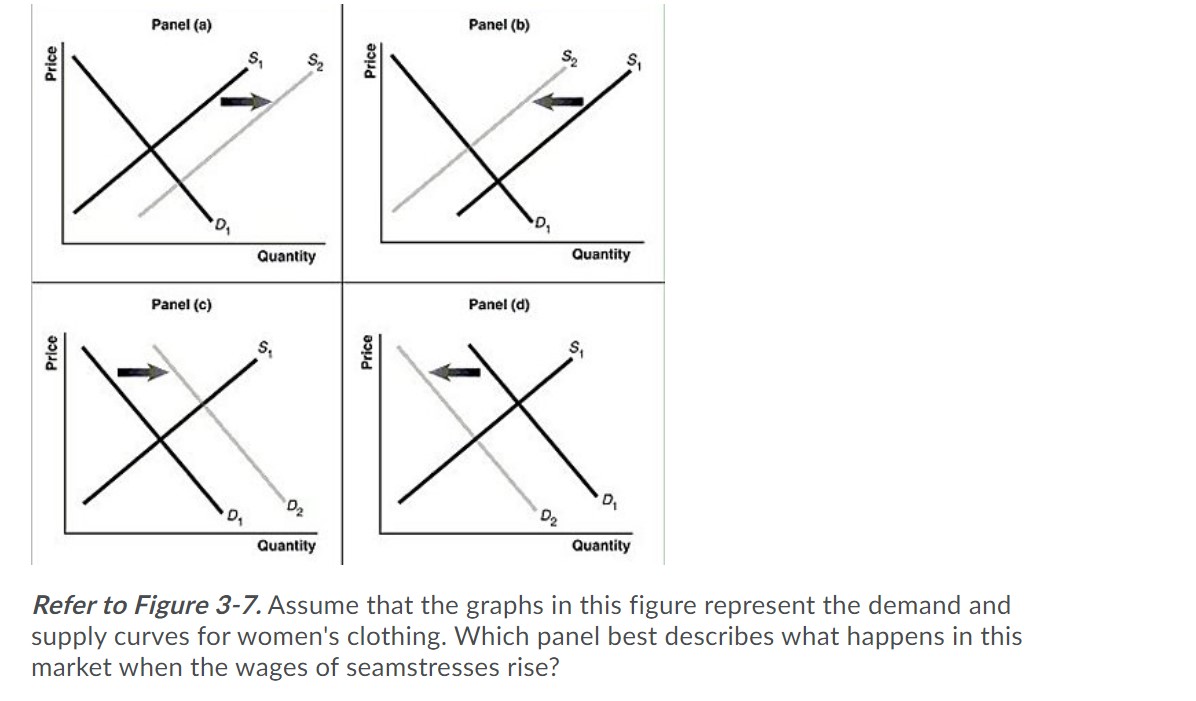
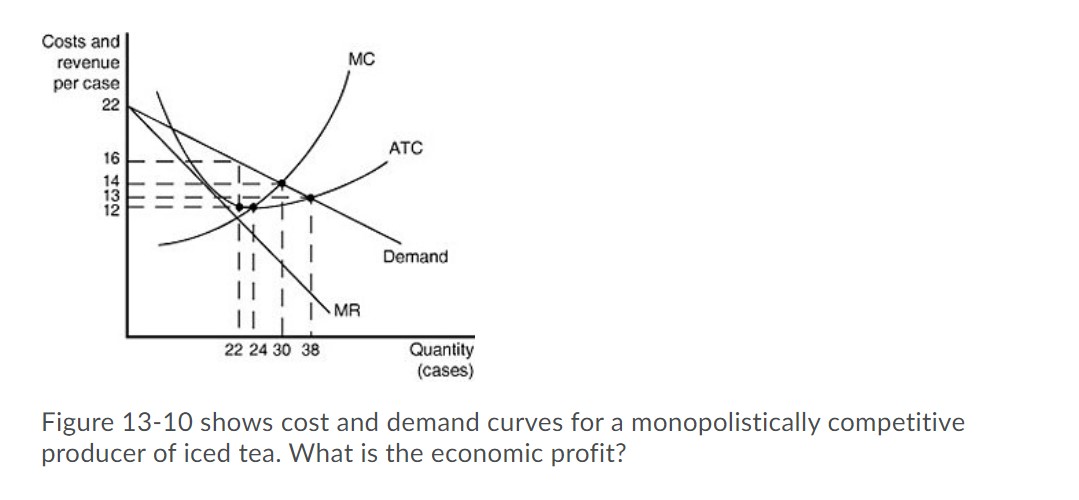
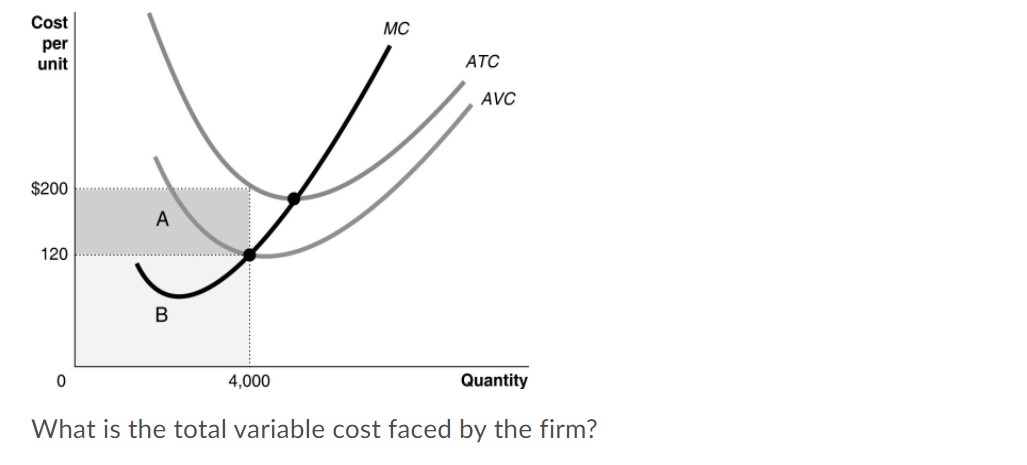
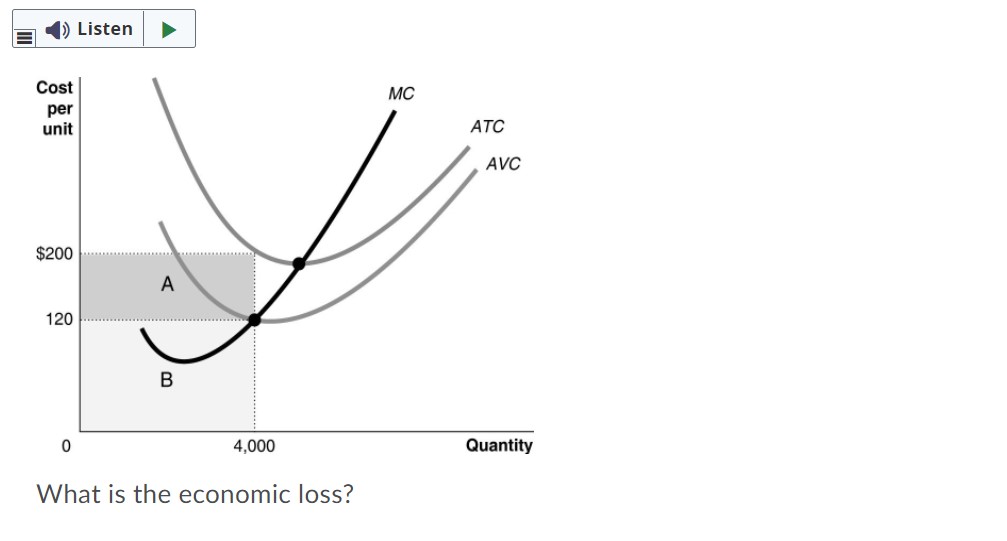
Panel (a) Panel (b) S Price Price D. D. Quantity Quantity Panel (c) Panel (d) S, S Price Price D, D2 Quantity Quantity Refer to Figure 3-7. Assume that the graphs in this figure represent the demand and supply curves for women's clothing. Which panel best describes what happens in this market when the wages of seamstresses rise?Costs and menus per case 16 '4 13 I2 Figure 13-10 shows cost and demand curves for a monopolistically competitive producer of iced tea. What is the economic profit?
Step by Step Solution
There are 3 Steps involved in it
1 Expert Approved Answer
Step: 1 Unlock

Question Has Been Solved by an Expert!
Get step-by-step solutions from verified subject matter experts
Step: 2 Unlock
Step: 3 Unlock