

Question: Panel A Panel B Wage Wage (S) Supply ($) Supply Labor (units) Labor (units) Panel C Panel D Wage Wage ($) ($) Supply Supply Labor
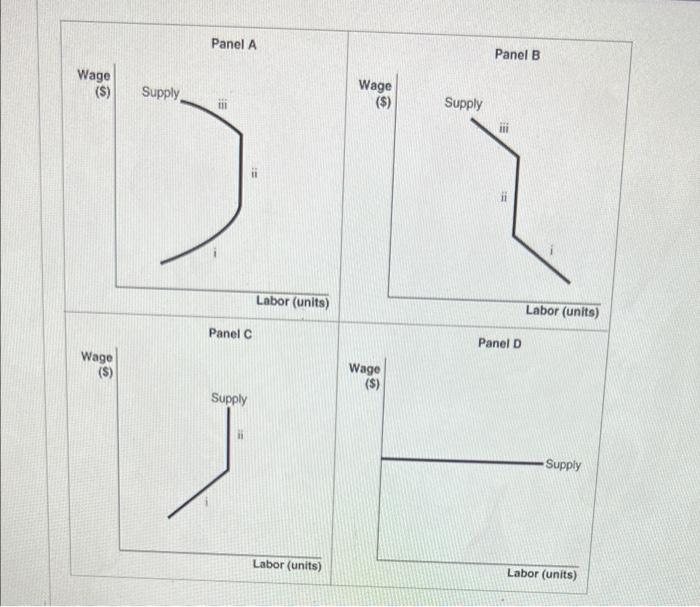
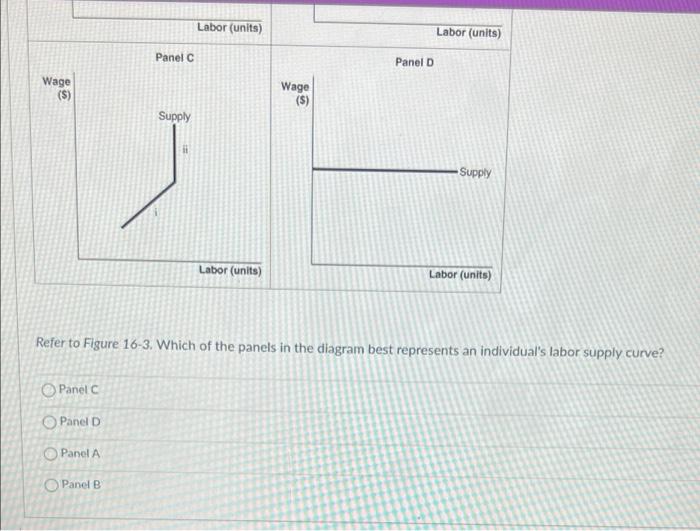
Panel A Panel B Wage Wage (S) Supply ($) Supply Labor (units) Labor (units) Panel C Panel D Wage Wage ($) ($) Supply Supply Labor (units) Labor (units)Labor (units) Labor (units) Panel C Panel D Wage Wage ($) ($) Supply Supply Labor (units) Labor (units) Refer to Figure 16-3. Which of the panels in the diagram best represents an individual's labor supply curve? Panel C Panel D Panel A Panel B
Step by Step Solution
There are 3 Steps involved in it
1 Expert Approved Answer
Step: 1 Unlock

Question Has Been Solved by an Expert!
Get step-by-step solutions from verified subject matter experts
Step: 2 Unlock
Step: 3 Unlock