

Question: Paragraph Clipboard Font Styles Then, using this row and the subsequent rows below it under Treasury Constant Maturities determine the shape of the yield curve
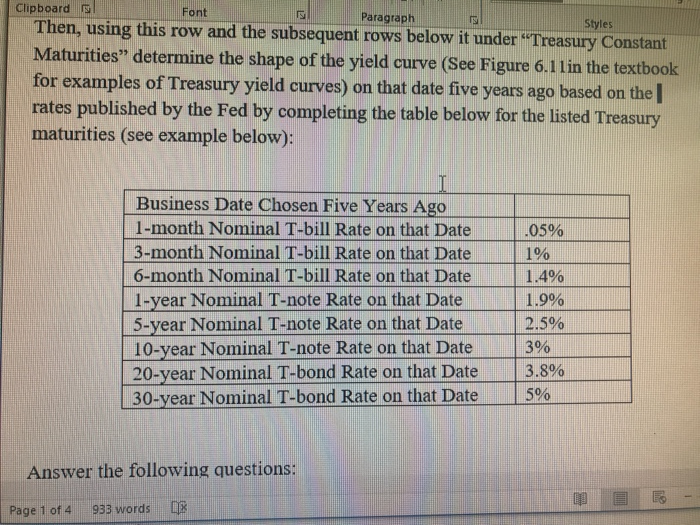
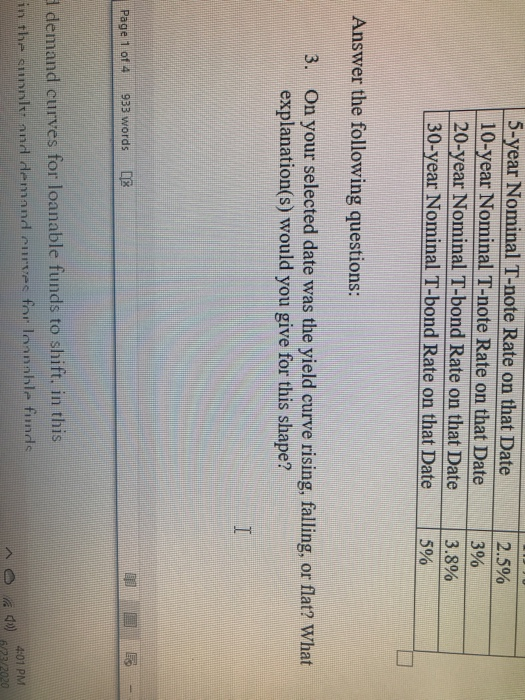
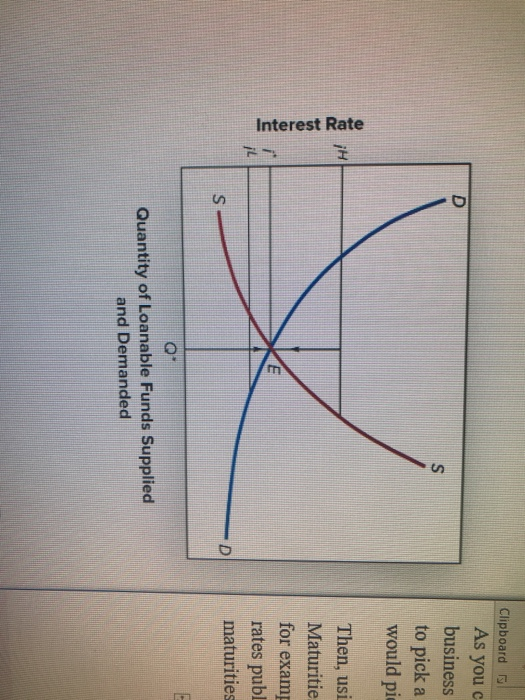
Paragraph Clipboard Font Styles Then, using this row and the subsequent rows below it under "Treasury Constant Maturities determine the shape of the yield curve (See Figure 6.1 1in the textbook for examples of Treasury yield curves) on that date five years ago based on the rates published by the Fed by completing the table below for the listed Treasury maturities (see example below): I Business Date Chosen Five Years Ago 1-month Nominal T-bill Rate on that Date 3-month Nominal T-bill Rate on that Date 6-month Nominal T-bill Rate on that Date 1-year Nominal T-note Rate on that Date 5-year Nominal T-note Rate on that Date 10-year Nominal T-note Rate on that Date 20-year Nominal T-bond Rate on that Date 30-year Nominal T-bond Rate on that Date .05% 1% 1.4% 1.9% 2.5% 3% 3.8% 5% Answer the following questions: Page 1 of 4 933 words 5-year Nominal T-note Rate on that Date 10-year Nominal T-note Rate on that Date 20-year Nominal T-bond Rate on that Date 30-year Nominal T-bond Rate on that Date 2.5% 3% 3.8% 5% Answer the following questions: 3. On your selected date was the yield curve rising, falling, or flat? What explanation(s) would you give for this shape? I Page 1 of 4 983 words demand curves for loanable funds to shift, in this in the cunnk and demand curves for lonnable funds ^ 4:01 PM 6/23/2020 D Clipboard As you c business to pick a would pid S iH Interest Rate Then, usi Maturitie for examp rates publ maturities E il s D Q" Quantity of Loanable Funds Supplied and Demanded Paragraph Clipboard Font Styles Then, using this row and the subsequent rows below it under "Treasury Constant Maturities determine the shape of the yield curve (See Figure 6.1 1in the textbook for examples of Treasury yield curves) on that date five years ago based on the rates published by the Fed by completing the table below for the listed Treasury maturities (see example below): I Business Date Chosen Five Years Ago 1-month Nominal T-bill Rate on that Date 3-month Nominal T-bill Rate on that Date 6-month Nominal T-bill Rate on that Date 1-year Nominal T-note Rate on that Date 5-year Nominal T-note Rate on that Date 10-year Nominal T-note Rate on that Date 20-year Nominal T-bond Rate on that Date 30-year Nominal T-bond Rate on that Date .05% 1% 1.4% 1.9% 2.5% 3% 3.8% 5% Answer the following questions: Page 1 of 4 933 words 5-year Nominal T-note Rate on that Date 10-year Nominal T-note Rate on that Date 20-year Nominal T-bond Rate on that Date 30-year Nominal T-bond Rate on that Date 2.5% 3% 3.8% 5% Answer the following questions: 3. On your selected date was the yield curve rising, falling, or flat? What explanation(s) would you give for this shape? I Page 1 of 4 983 words demand curves for loanable funds to shift, in this in the cunnk and demand curves for lonnable funds ^ 4:01 PM 6/23/2020 D Clipboard As you c business to pick a would pid S iH Interest Rate Then, usi Maturitie for examp rates publ maturities E il s D Q" Quantity of Loanable Funds Supplied and Demanded
Step by Step Solution
There are 3 Steps involved in it

Get step-by-step solutions from verified subject matter experts