

Question: Paragraph Editi Styles Use the data provided below on the real consumption expenditure and the real disposable income for a country for the years 2012
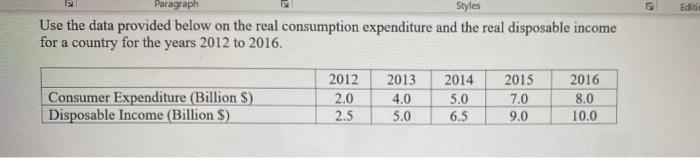
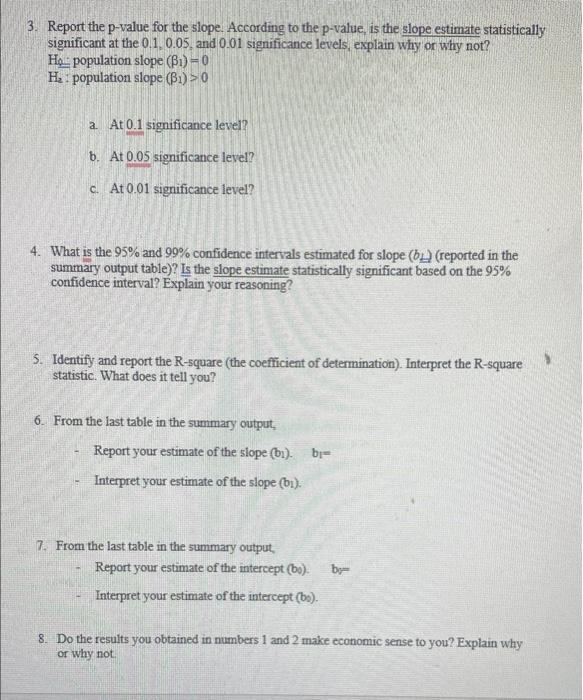
Paragraph Editi Styles Use the data provided below on the real consumption expenditure and the real disposable income for a country for the years 2012 to 2016. 2012 2.0 2.5 2013 4.0 2014 5.0 Consumer Expenditure (Billion $) Disposable Income (Billion $) 2015 7.0 9.0 2016 8.0 10.0 5.0 6.5 3. Report the p-value for the slope. According to the p-value, is the slope estimate statistically significant at the 0.1.0.05. and 0.01 significance levels, explain why or why not? Ho population slope (B1)=0 Hz : population slope (B1) > 0 a At 0.1 significance level? b. At 0.05 significance level? c. At 0.01 significance level? 4. What is the 95% and 99% confidence intervals estimated for slope() (reported in the summary output table)? Is the slope estimate statistically significant based on the 95% confidence interval? Explain your reasoning? 5. Identify and report the R-square (the coefficient of determination). Interpret the R-square statistic. What does it tell you? 6. From the last table in the summary output, Report your estimate of the slope (b). b- Interpret your estimate of the slope (61). 7. From the last table in the summary output Report your estimate of the intercept (bo). interpret your estimate of the intercept (bo). by 8. Do the results you obtained in numbers 1 and 2 make economic sense to you? Explain why or why not
Step by Step Solution
There are 3 Steps involved in it

Get step-by-step solutions from verified subject matter experts