Question: Paragraph Styles Q5. Using the information in the Balance Sheet and Profit and Loss Statement below, calenlate the following ratios and answer the questions (8
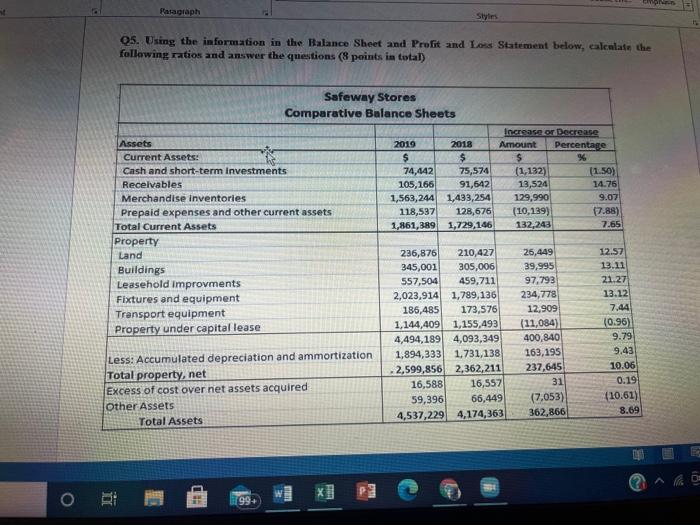
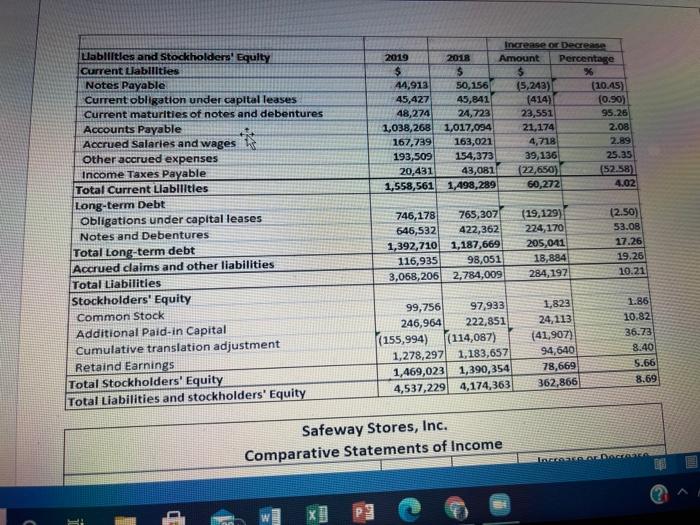
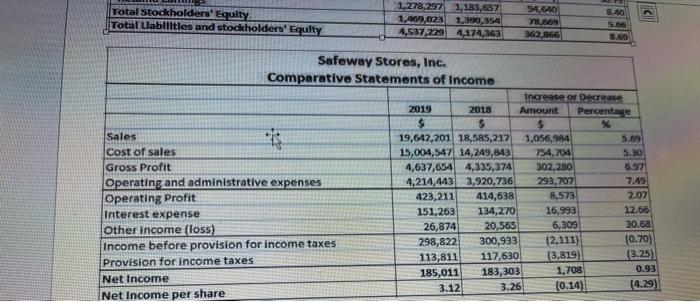
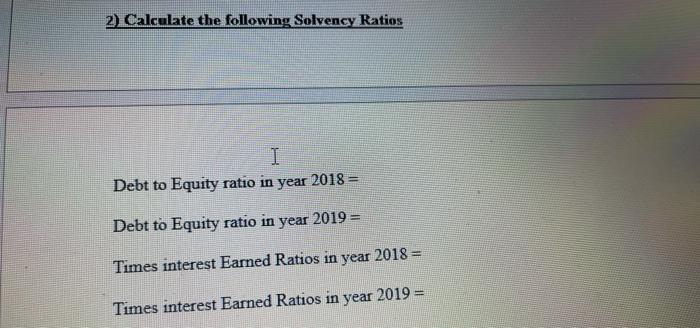
Paragraph Styles Q5. Using the information in the Balance Sheet and Profit and Loss Statement below, calenlate the following ratios and answer the questions (8 points in total) Safeway Stores Comparative Balance Sheets Increase or Decrease Assets 2019 2018 Amount Percentage Current Assets: $ $ $ Cash and short-term Investments 74,442 75,574 (1,132) (1.50) Receivables 105,166 91,642 13,524 14.76 Merchandise inventories 1,563,244 1,433,254 129,990 9.07 Prepaid expenses and other current assets 118,537 128,676 (10,139) 7.88) Total Current Assets 1,861,389 1,729,146 132,243 7.65 Property Land 236,876 210,427 26,449 12.57 Buildings 345,001 305,006 39,995 13.11 Leasehold improvments 557,504 459,711 97.793 21.27 Fixtures and equipment 2,023,914 1,789,136 234,778 13.12 Transport equipment 186,485 173,576 12,909 7.44 Property under capital lease 1,144,409 1,155,493 (11,084) (0.96) 4,494,189 4,093,349 400,840 9.79 Less: Accumulated depreciation and ammortization 1,894,333 1.731,138 163,195 9.43 2,599,856 2,362,211 237,645 10.06 Total property, net 16,588 16,557 31 0.19 Excess of cost over net assets acquired 59,396 66,449 (7,053) Other Assets (10.61) Total Assets 4,537,229 4,174,363 362,866 8.69 X o PUT In 199 Increase or Decrease 2019 2018 Amount Percentage $ $ % 44,913 50, 156 15,243) (20.45) 45,427 45,841 (414) (0.90) 48,274 24,723 23,551 95.26 1,038,268 1,017,094 21.174 2.08 167,739 163,021 4,718 2.89 193,509 154,373 39,136 25.35 20,431 43,081 (22,650) (52.58) 1,558,561 1,498,289 60,272 4.02 Llabllitles and Stockholders' Equity Current Labilities Notes Payable Current obligation under capital leases Current maturities of notes and debentures Accounts Payable Accrued Salaries and wages Other accrued expenses Income Taxes Payable Total Current Liabilities Long-term Debt Obligations under capital leases Notes and Debentures Total Long-term debt Accrued claims and other liabilities Total Liabilities Stockholders' Equity Common Stock Additional Paid-in Capital Cumulative translation adjustment Retaind Earnings Total Stockholders' Equity Total Liabilities and stockholders' Equity 746,178 765,307 646,532 422,362 1,392,710 1,187,669 116,935 98,051 3,058,206 2,784,009 (19,129) 224,170 205,011 18,884 284,197 (2.50) 53.08 17.26 19.26 10.21 99,756 97,933 246,964 222,851 (155,994) (114,087) 1,278,297 1,183,657 1,469,023 1,390,354 4,537,229 4,174,363 1,823 24,113 (41,907) 94,640 78,669 362,866 1.86 10.82 36.73 8.40 5.66 8.69 Safeway Stores, Inc. Comparative Statements of Income TODO Total Stockholders' Equity Total Uablittles and stockholders' Equity 1,278,297 1.183,657 1,409.023 1,390,254 4,537,294,174,363 94.640 78.860 362,366 8.40 5.66 Safeway Stores, Inc. Comparative Statements of incomo Increase or Decrease 2019 2018 Amount Percentage $ $ Sales 19,642,201 18,585,217 1,056,984 5.69 Cost of sales 15,004,54% 14,249,843 754,704 5.30 Gross Profit 4,637,654 4,335,374 302,280 6.97 Operating and administrative expenses 4,214,4433,920,736 293,707 7.49 Operating Profit 423,211 414,638 8,573 2.07 Interest expense 151,263 134,270 16,993 12.66 Other income (loss) 26,874 20,565 6,309 30.68 298,822 300,933 Income before provision for income taxes (2,111) (0.70) Provision for income taxes 113,811 117,630 (3,819 3.25 185,011 183,303 Net Income 1.708 3.12 3.26 (0.14) (4.29) Net Income per share 0.93 2) Calculate the following Solvency Ratios I Debt to Equity ratio in year 2018 = Debt to Equity ratio in year 2019 = Times interest Earned Ratios in year 2018 = Times interest Earned Ratios in year 2019 = 2) Calculate the following Profitability Ratios Return on Invested Capital (ROIC) ratio in year 2018 = Return on Invested Capital (ROIC) ratio in year 2019 = Return on Owner's Equity (ROE) ratio in year 2018 = Return on Owner's Equity (ROE) ratio in year 2019 = Profit as Percentage of Sales ratio in year 2018 = Profit as Percentage of Sales ratio in year 2019 = u make