

Question: Part 1: 1) Create arrays in MATLAB containing the data on growth of paramecium given in the table below. Call the array with the days
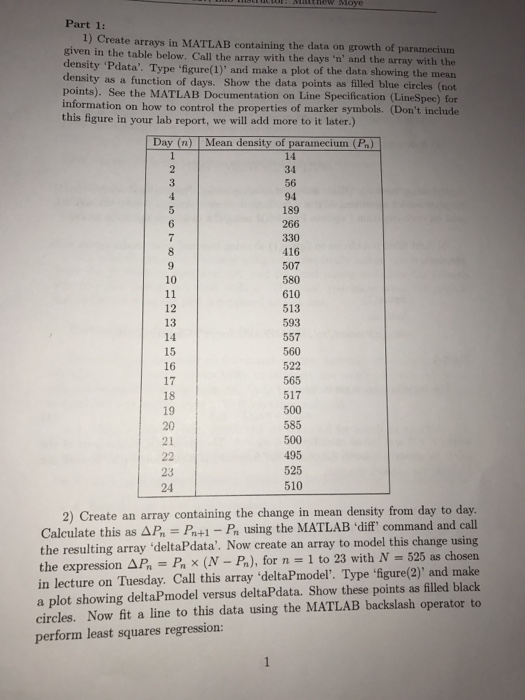
Part 1: 1) Create arrays in MATLAB containing the data on growth of paramecium given in the table below. Call the array with the days 'n' and the array with the density 'Pdata. Type figure(1)' and make a plot of the data showing the mean density as a function of days. Show the data points as filled blue circles (neot points). See the MATLAB Documentation on Line Specification (LineSpec) for information on how to control the properties of marker symbols. (Don't include this figure in your lab report, we will add more to it later.) ean 34 189 266 330 416 507 580 610 10 12 13 14 15 16 17 18 19 20 21 593 557 560 522 565 517 500 585 495 525 510 24 2) Create an array containing the change in mean density from day to day Calculate this as AP P+1 - P using the MATLAB 'diff command and call the resulting array 'deltaPdata'. Now create an array to model this change using the expression A,-F, x (N-P), for n = 1 to 23 with N-525 as chosen in lecture on Tuesday. Call this array 'deltaPmodel'. Type 'igure(2)' and make a plot showing deltaPmodel versus deltaPdata. Show these points as filled black circles. Now fit a line to this data using the MATLAB backslash operator to perform least squares regression
Step by Step Solution
There are 3 Steps involved in it

Get step-by-step solutions from verified subject matter experts