Question: Part 1 (60 Points) Multiple Choices Choose one best answer to each question. 1. (4 points) Which one of the following is a good approximation
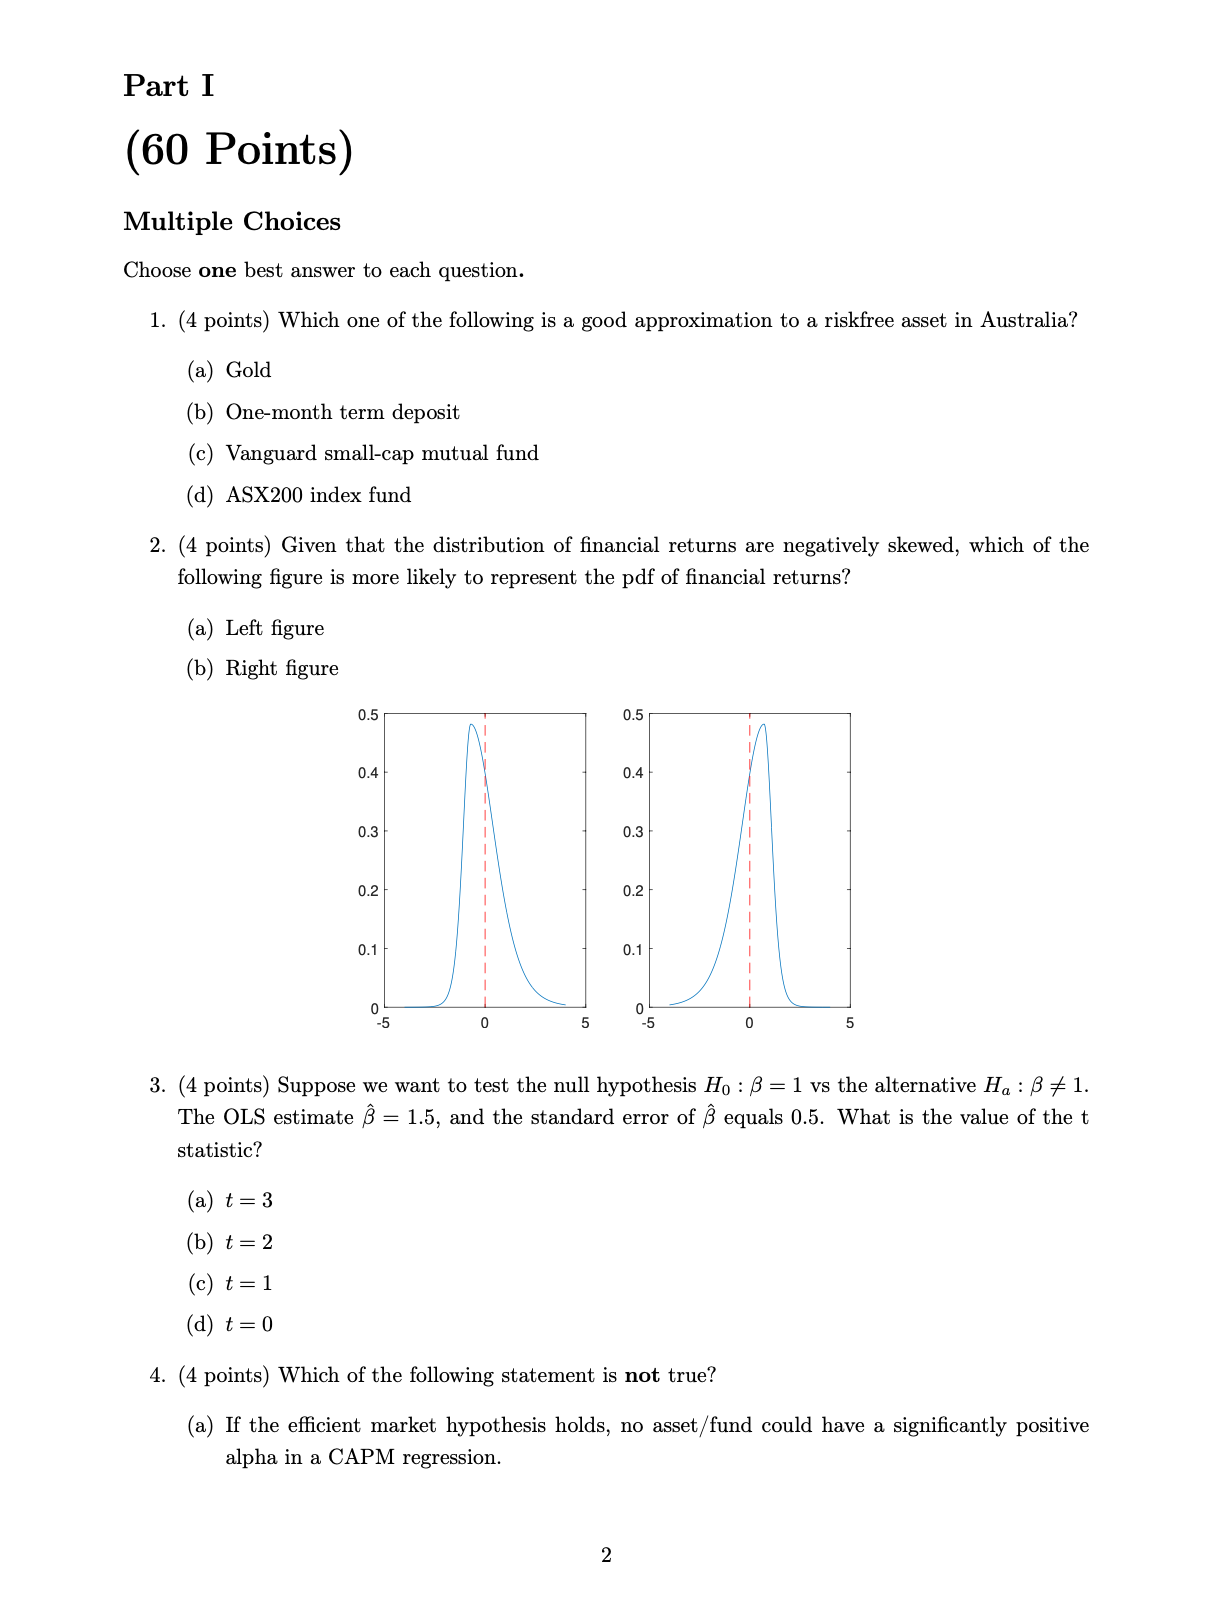
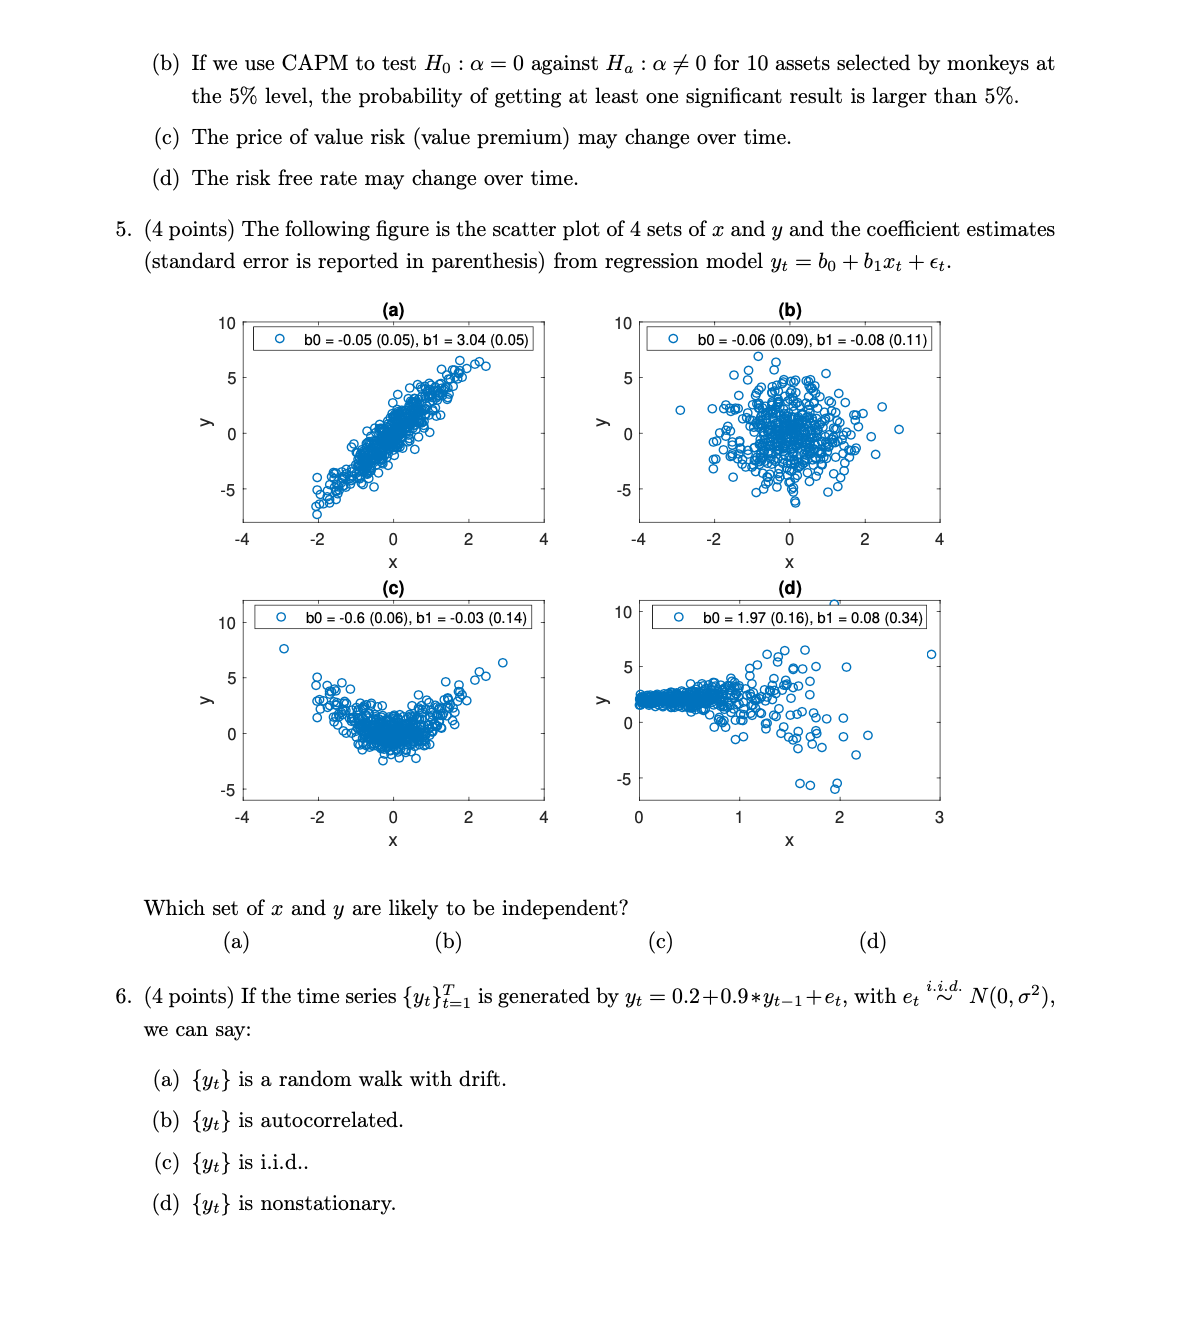
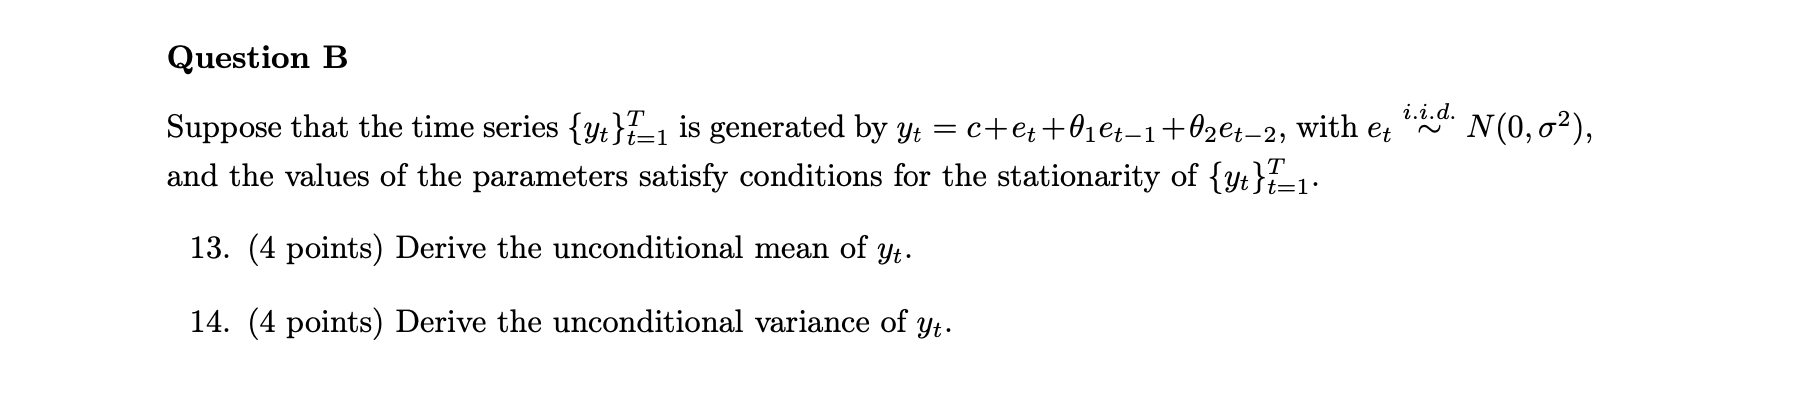
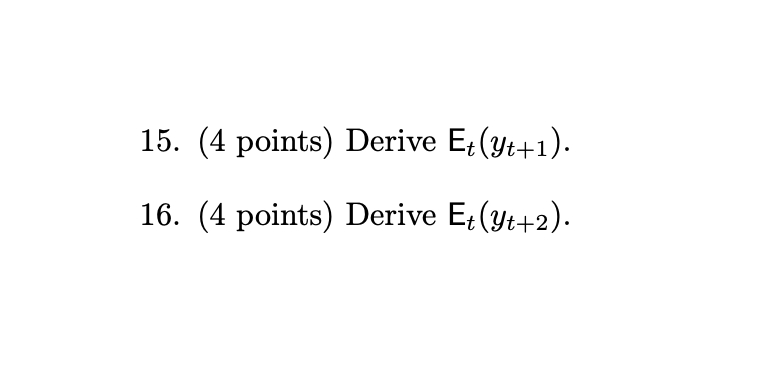
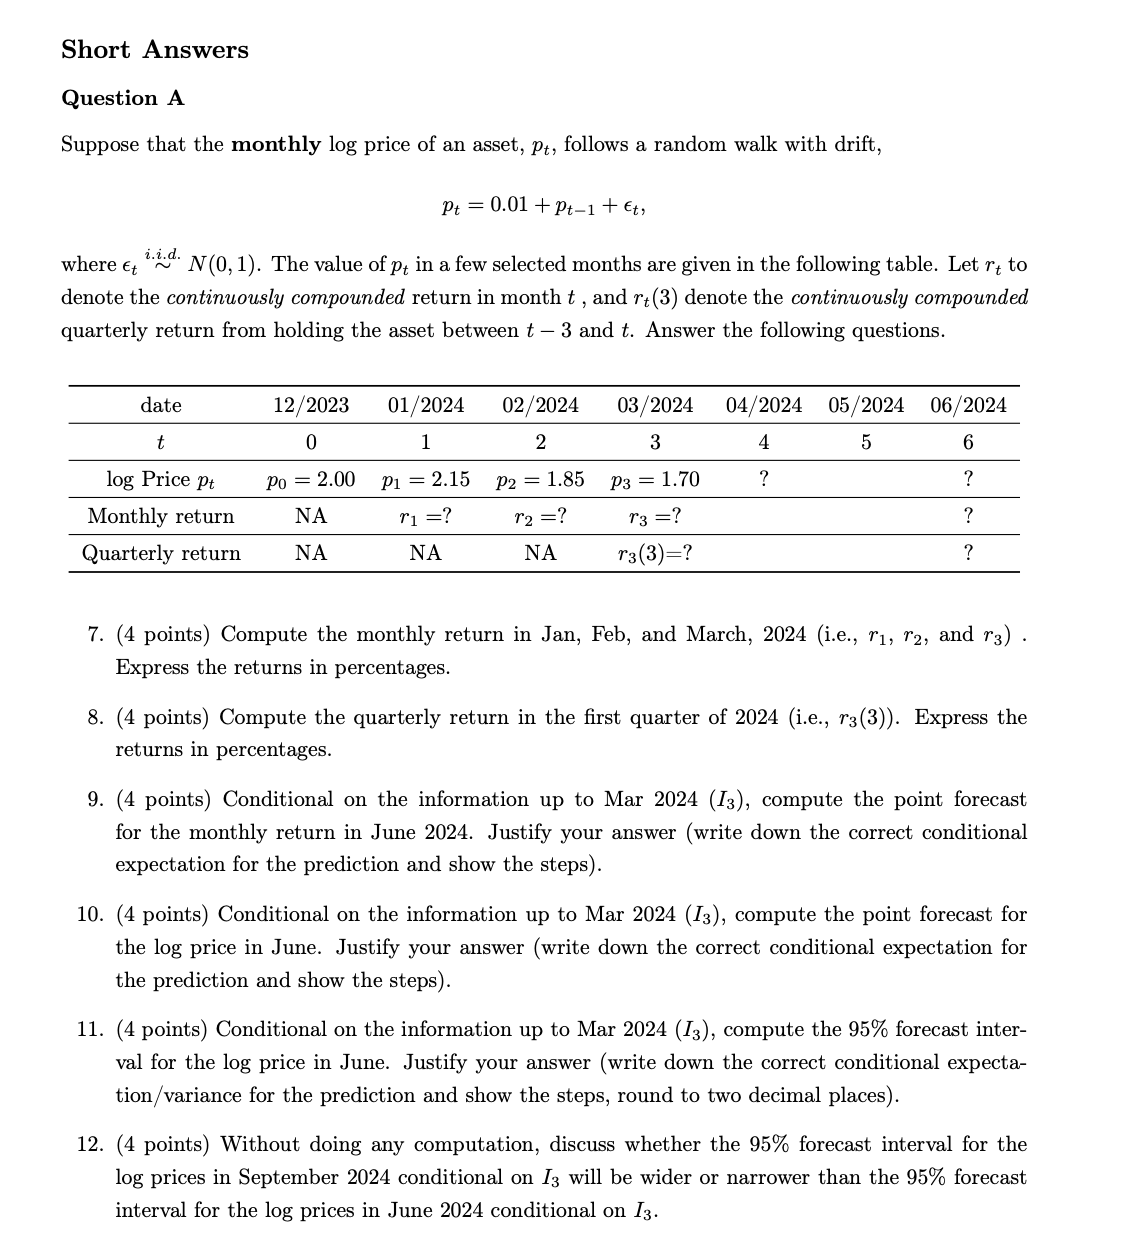
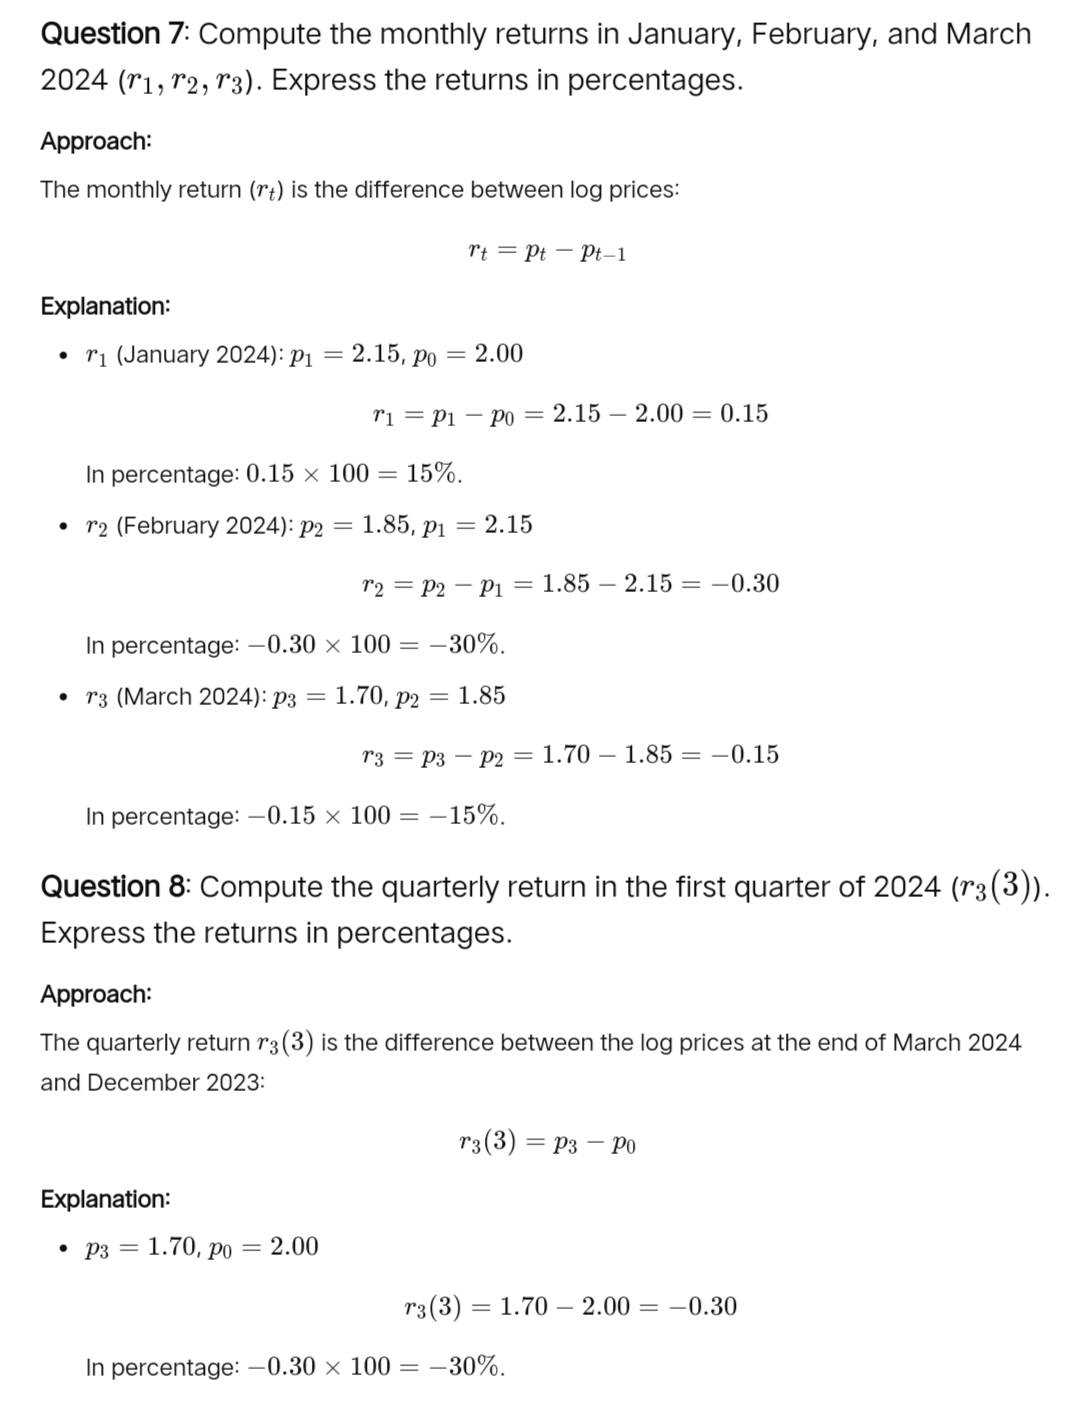
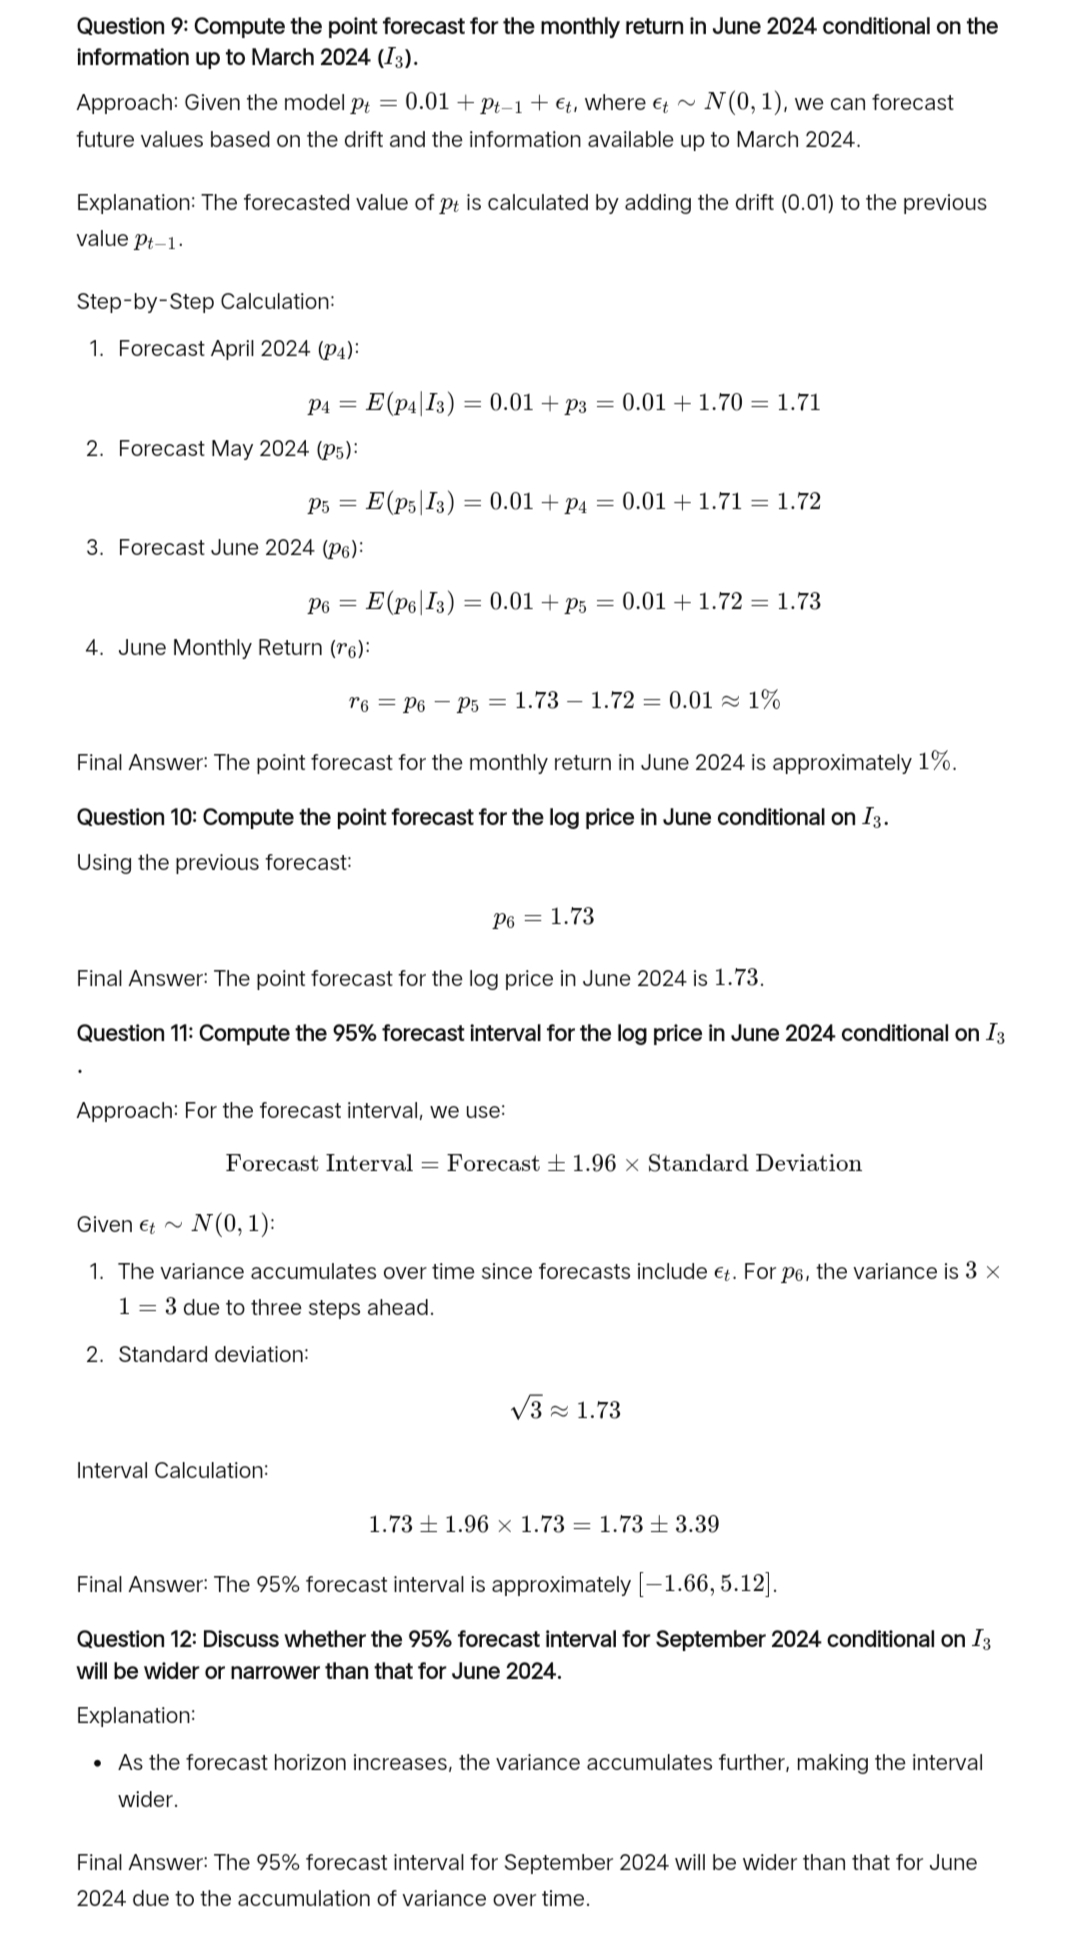
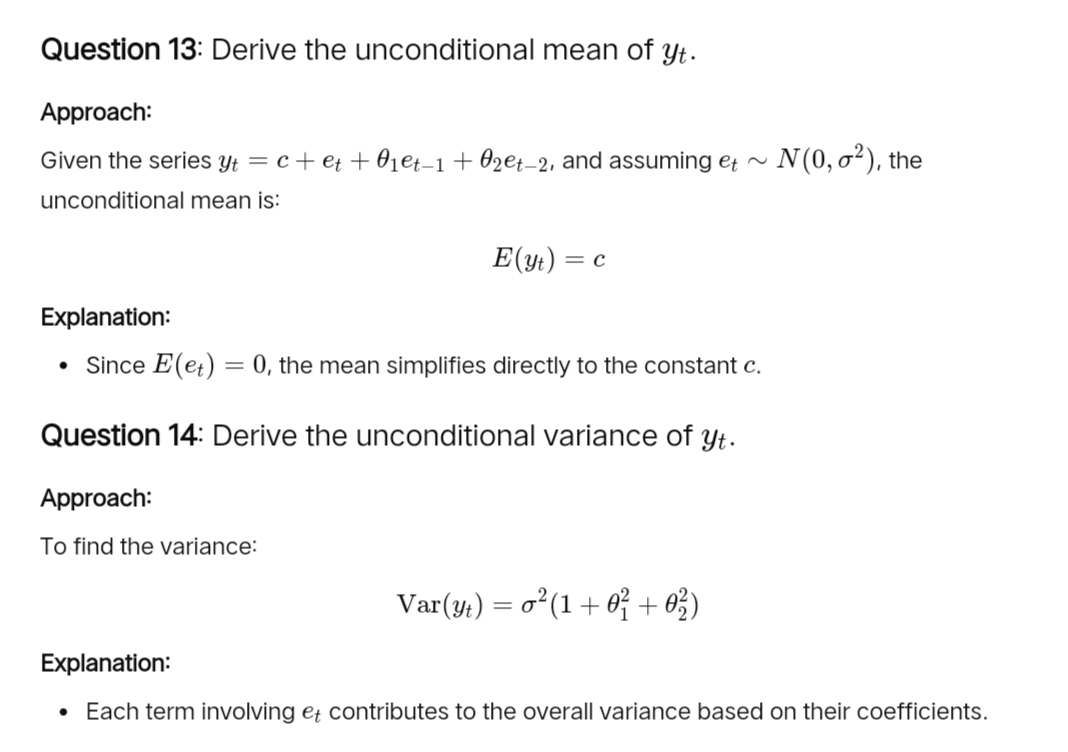
Part 1 (60 Points) Multiple Choices Choose one best answer to each question. 1. (4 points) Which one of the following is a good approximation to a riskfree asset in Australia? (a) Gold (b) One-month term deposit () Vanguard small-cap mutual fund (d) ASX200 index fund 2. (4 points) Given that the distribution of financial returns are negatively skewed, which of the following figure is more likely to represent the pdf of financial returns? (a) Left figure (b) Right figure 0.5 0.5 - | I". I | | | 0.4 [ 0.4 { | [N Co 03 Il 1 03 [ | b {1 | | I 0.2} | g 0.2 13| | I I | | | \\ f | | 0171 | 0.1 /o 0 0 : 5 0 5 -5 0 5 3. (4 points) Suppose we want to test the null hypothesis Hy : 8 = 1 vs the alternative H, : 8 # 1. The OLS estimate 3 = 1.5, and the standard error of 3 equals 0.5. What is the value of the t statistic? (a) t=3 (b) t=2 (c) t=1 (d) t=0 4. (4 points) Which of the following statement is not true? (a) If the efficient market hypothesis holds, no asset/fund could have a significantly positive alpha in a CAPM regression. (b) If we use CAPM to test Hy : = 0 against H, : a # 0 for 10 assets selected by monkeys at the 5% level, the probability of getting at least one significant result is larger than 5%. (c) The price of value risk (value premium) may change over time. (d) The risk free rate may change over time. 5. (4 points) The following figure is the scatter plot of 4 sets of z and y and the coefficient estimates (standard error is reported in parenthesis) from regression model y; = by + b1t + . a i . (a) , _ O b0 =-0.05 (0.05), b1 = 3.04 (0,05)| O 5 . = 0 -5 -4 2 0 2 X 10+ 5 = 0 L -5 -4 10 Which set of z and y are likely to be independent? (a) (b) (b) | O b0 =-0.06 (0.09), bl = -0.08 (0.11) (d) ( (d) 6. (4 points) If the time series {y;}7_, is generated by y; = 0.240.9%y;_1 +e;, with e; \"&E N(0, 02), we can say: (a) {y:} is a random walk with drift. (b) {yt} is autocorrelated. (c) {y:}isiid.. (d) {y:} is nonstationary. Short Answers Question A Suppose that the monthly log price of an asset, p;, follows a random walk with drift, pr =0.01 +p;, 1 + , where , vk N (0,1). The value of p; in a few selected months are given in the following table. Let r; to denote the continuously compounded return in month , and 74(3) denote the continuously compounded quarterly return from holding the asset between 3 and . Answer the following questions. date 12/2023 01/2024 02/2024 03/2024 04/2024 05/2024 06,2024 t 0 1 2 3 4 5 6 log Price p; po=2.00 p; =215 p:; =185 p3=170 ? ? Monthly return NA ry =7 ro =7 rq =7 ? Quarterly return NA NA NA r3(3)=" ? 10. 11. 12. . (4 points) Compute the monthly return in Jan, Feb, and March, 2024 (i.e., r1, 75, and 73) . Express the returns in percentages. . (4 points) Compute the quarterly return in the first quarter of 2024 (i.e., r3(3)). Express the returns in percentages. . (4 points) Conditional on the information up to Mar 2024 (I3), compute the point forecast for the monthly return in June 2024. Justify your answer (write down the correct conditional expectation for the prediction and show the steps). (4 points) Conditional on the information up to Mar 2024 (I3), compute the point forecast for the log price in June. Justify your answer (write down the correct conditional expectation for the prediction and show the steps). (4 points) Conditional on the information up to Mar 2024 (I3), compute the 95% forecast inter- val for the log price in June. Justify your answer (write down the correct conditional expecta- tion /variance for the prediction and show the steps, round to two decimal places). (4 points) Without doing any computation, discuss whether the 95% forecast interval for the log prices in September 2024 conditional on I3 will be wider or narrower than the 95% forecast interval for the log prices in June 2024 conditional on I3. Question B Suppose that the time series {y;}7_; is generated by y; = c+e;+601e;_1 +02e;_2, with e; bid N(0,02), and the values of the parameters satisfy conditions for the stationarity of {y:}_,. 13. (4 points) Derive the unconditional mean of y,. 14. (4 points) Derive the unconditional variance of y;. 15. (4 points) Derive Et(yt+1). 16. (4 points) Derive Et(yt+2).Short Answers Question A Suppose that the monthly log price of an asset, p;, follows a random walk with drift, pr =0.01 +p;, 1 + , where , vk N (0,1). The value of p; in a few selected months are given in the following table. Let r; to denote the continuously compounded return in month , and 74(3) denote the continuously compounded quarterly return from holding the asset between 3 and . Answer the following questions. date 12/2023 01/2024 02/2024 03/2024 04/2024 05/2024 06,2024 t 0 1 2 3 4 5 6 log Price p; po=2.00 p; =215 p:; =185 p3=170 ? ? Monthly return NA ry =7 ro =7 rq =7 ? Quarterly return NA NA NA r3(3)=" ? 10. 11. 12. . (4 points) Compute the monthly return in Jan, Feb, and March, 2024 (i.e., r1, 75, and 73) . Express the returns in percentages. . (4 points) Compute the quarterly return in the first quarter of 2024 (i.e., r3(3)). Express the returns in percentages. . (4 points) Conditional on the information up to Mar 2024 (I3), compute the point forecast for the monthly return in June 2024. Justify your answer (write down the correct conditional expectation for the prediction and show the steps). (4 points) Conditional on the information up to Mar 2024 (I3), compute the point forecast for the log price in June. Justify your answer (write down the correct conditional expectation for the prediction and show the steps). (4 points) Conditional on the information up to Mar 2024 (I3), compute the 95% forecast inter- val for the log price in June. Justify your answer (write down the correct conditional expecta- tion /variance for the prediction and show the steps, round to two decimal places). (4 points) Without doing any computation, discuss whether the 95% forecast interval for the log prices in September 2024 conditional on I3 will be wider or narrower than the 95% forecast interval for the log prices in June 2024 conditional on I3. Question B Suppose that the time series {y;}7_; is generated by y; = c+e;+601e;_1 +02e;_2, with e; bid N(0,02), and the values of the parameters satisfy conditions for the stationarity of {y:}_,. 13. (4 points) Derive the unconditional mean of y,. 14. (4 points) Derive the unconditional variance of y;. 15. (4 points) Derive Et(yt+1). 16. (4 points) Derive Et(yt+2).Question 7: Compute the monthly returns in January, February, and March 2024 (71, 12, 73). Express the returns in percentages. Approach: The monthly return (rt) is the difference between log prices: rt = Pt - Pt-1 Explanation: . "1 (January 2024): p1 = 2.15, po = 2.00 71 = P1 - po = 2.15 - 2.00 = 0.15 In percentage: 0.15 x 100 = 15%. . 72 (February 2024): p2 = 1.85, p1 = 2.15 12 = P2 - P1 = 1.85 - 2.15 = -0.30 In percentage: -0.30 x 100 = -30%. . 73 (March 2024): p3 = 1.70, p2 = 1.85 13 = p3 - p2 = 1.70 - 1.85 = -0.15 In percentage: -0.15 x 100 = -15%. Question 8: Compute the quarterly return in the first quarter of 2024 (r3 (3)). Express the returns in percentages. Approach: The quarterly return r3(3) is the difference between the log prices at the end of March 2024 and December 2023: r3(3) = P3 - Po Explanation: . p3 = 1.70, po = 2.00 13(3) = 1.70 - 2.00 = -0.30 In percentage: -0.30 x 100 = -30%.Question 9: Compute the point forecast for the monthly return in June 2024 conditional on the information up to March 2024 (I3). Approach: Given the model p; = 0.01 + p, | + , where , ~ N (0, 1), we can forecast future values based on the drift and the information available up to March 2024. Explanation: The forecasted value of p; is calculated by adding the drift (0.01) to the previous value py_1. Step-by-Step Calculation: 1. Forecast April 2024 (py): P = E(p];_l,} =0.01 +p3 = 0.01 + 1.70 = 1.71 2. Forecast May 2024 (p5): ps = E(ps|I3) = 0.01 +p; = 0.01 +1.71 = 1.72 3. Forecast June 2024 (pg): Ps = E(p(,u'_l,) =0.01+4p; =00141.72=1.73 4. June Monthly Return (rg): re =ps ps = 173 1.72 = 0.01 = 1% Final Answer: The point forecast for the monthly return in June 2024 is approximately 1%. Question 10: Compute the point forecast for the log price in June conditional on 7. Using the previous forecast: Final Answer: The point forecast for the log price in June 2024 is 1.73. Question 11: Compute the 95% forecast interval for the log price in June 2024 conditional on 1 Approach: For the forecast interval, we use: Forecast Interval = Forecast + 1.96 x Standard Deviation Given ~ N(0,1): 1. The variance accumulates over time since forecasts include ;. For pg, the variance is 3 x 1 = 3 due to three steps ahead. 2. Standard deviation: V3173 Interval Calculation: 1.73 1.96 x 1.73 = 1.73 = 3.39 Final Answer: The 95% forecast interval is approximately [1.66,5.12]. Question 12: Discuss whether the 95% forecast interval for September 2024 conditional on I3 will be wider or narrower than that for June 2024, Explanation: Asthe forecast horizon increases, the variance accumulates further, making the interval wider. Final Answer: The 95% forecast interval for September 2024 will be wider than that for June 2024 due to the accumulation of variance over time. Question 13: Derive the unconditional mean of ;. Approach: Given the series y; = + e + 01es_1 + Bae;_o, and assuming e ~ N (0, 0?), the unconditional mean is: E(y) =c Explanation: Since E(e;) = 0, the mean simplifies directly to the constant . Question 14: Derive the unconditional variance of y;. Approach: To find the variance: Var(y;) = 02(1 o+ 9? + 93) Explanation: e Each term involving e; contributes to the overall variance based on their coefficients
Step by Step Solution
There are 3 Steps involved in it
1 Expert Approved Answer
Step: 1 Unlock
Question Has Been Solved by an Expert!
Get step-by-step solutions from verified subject matter experts
Step: 2 Unlock
Step: 3 Unlock
Students Have Also Explored These Related Mathematics Questions!