

Question: Part 1 a. How many observations are in the sample data? b. Write out the null and alternate hypotheses for the t-test for Beta1. c.
Part 1
a. How many observations are in the sample data?
b. Write out the null and alternate hypotheses for the t-test for Beta1.
c. Compute the t- statistic for Beta1.
d. Compute the R-Squared value for Model 1.
e. Compute the Adjusted R-Squared value for Model 1.
f. Write out the null and alternate hypotheses for the Overall F-test.
g. Compute the F-statistic for the Overall F-test.
Part 2
h. Does Model 1 nest Model 2 or does Model 2 nest Model 1? Explain.
i. Write out the null and alternate hypotheses for a nested F-test using Model 1 and Model 2.
j. Compute the F-statistic for a nested F-test using Model 1 and Model 2.
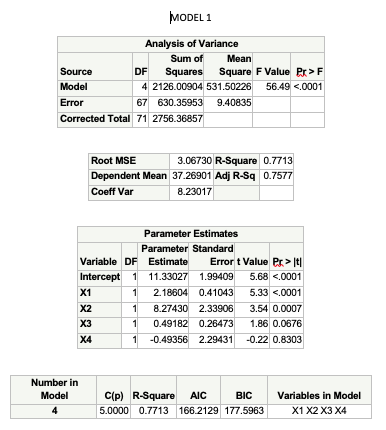
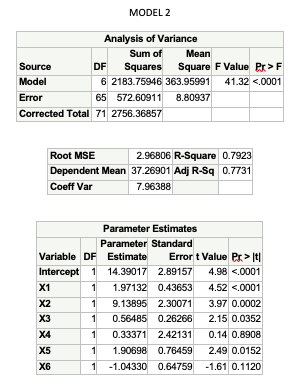
MODEL 1 Analysis of Variance Sum of Mean Source DF Squares Square F Value Pr > F Model 4 2126.00904 531.50226 56.49 <.0001 error corrected total root mse r-square dependent mean adj r-sq coeff var parameter estimates standard variable df estimate t value pr> It/ Intercept 1 11.33027 1.99409 5.68 <.0001 x1 x2 x3 x4 number in model c r-square aic bic variables x4model analysis of variance sum mean source df squares square f value pr> F Model 6 2183.75946 363.95991 41.32 <.0001 error corrected total root mse r-square dependent mean adj r-sq cooff var parameter estimates standard variable df estimate t value pr> It| Intercept 1 14.39017 2.89157 4.98 <.0001 x1 x2 x3 x4 x5 x6>
Step by Step Solution
There are 3 Steps involved in it

Get step-by-step solutions from verified subject matter experts