

Question: Part 1 Aaron Bailey is the operations manager for the call center 7 2 - Cents - Joke - - a call center that tells
Part
Aaron Bailey is the operations manager for the call center CentsJoke a call center that tells a random, highquality joke to the caller for the very reasonable rate of cents has contacted you after hearing about your expertise in forecasting. Forecasting the number of incoming calls is crucial to the call center. With its current model, staffing is the single largest cost to the call center, and staffing levels are always set based on the forecasted number of calls. "For us the manager explains, "good forecasting is not a joke!"
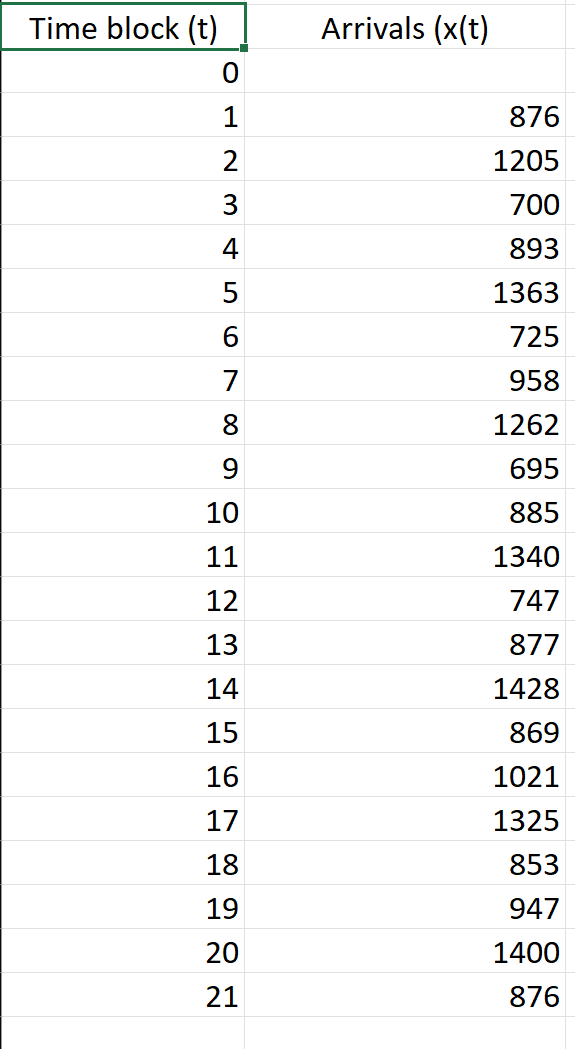
Staffing levels can be adjusted every hours. The call center is operating from pm to am so there are three hourblocks every day. The following data shows the number of incoming calls over these hourblocks for seven days: Data.
Note that the first period in the data Period is the hour block from pm to pm
As you know from before, it is always a good idea to graph the data to get an understanding of possible patterns. Graph the historical number of incoming calls. What do you notice?
Select the best answer
There seems to be a slow decrease in the demand for jokes over the phone
The waiting time to hear a joke over the phone is more than minutes on average
Jokes over the phone seem to be more popular around midnight than early evening or early morning
There is no noticeable pattern in the data
Part
Aaron Bailey wants you to start with a simple model that can be easily extended.
Build a simple exponential smoothing model for the call center's incoming calls. Use an alpha value of Assume that the forecast for period is
What is your forecast for next hour block's for t number of incoming calls? Round your answer to the nearest whole number.
What is the Mean Absolute Percentage Error MAPE of the forecast for the given data, as measured from the forecast for period to the forecast made in period Answer in percent without the percentage symbol, eg if your answer is write
Part
Aaron Bailey now wants to know how including more factors may improve the forecast.
Build a level and trend exponential smoothing model for the incoming calls. Use an alpha of a beta of a level of and a trend of Assume that the forecast for period is the sum of the level and the trend, that is
What is your forecast for next hour block's for t number of incoming calls? Round your answer to the nearest whole number.
What is the Mean Absolute Percentage Error MAPE of the forecast for the given data, as measured from the forecast for period to the forecast made in period Answer in percent without the percentage symbol, eg if your answer is write
Part
Aaron Bailey suggests you also include a trenddampening component,
Build a level and trend exponential smoothing model with damped trends for the incoming calls. Use an alpha of a beta of a level of and a trend of
What is your forecast for next hour block's for t number of incoming calls? Round your answer to the nearest whole number.
What is the Mean Absolute Percentage Error MAPE of the forecast for the given data, as measured from the forecast for period to the forecast made in period Answer in percent without the percentage symbol, eg if your answer is write
Part
The manager is surprised to learn that neither of the more complex forecast models in Part and Part provided a more accurate forecast a lower MAPE than the simple exponential forecast model in Part He asks you why this is the case?
Which of the following statements do in part, explain why the more complex models have a higher MAPE?
Select the best answer
MAPE captures forecast bias, and the more complex models are biased upwards
None of the forecast models include a seasonal component, while the incoming calls display strong seasonality
If the training data set was larger, the more complex models would be more accurate
None of the above
Step by Step Solution
There are 3 Steps involved in it
1 Expert Approved Answer
Step: 1 Unlock

Question Has Been Solved by an Expert!
Get step-by-step solutions from verified subject matter experts
Step: 2 Unlock
Step: 3 Unlock