

Question: Part 1) Bank Closings (Chapter 3- Data Visualization) U.S. bank branch closings have reached new high levels in recent years with 3324 closures in 2020.
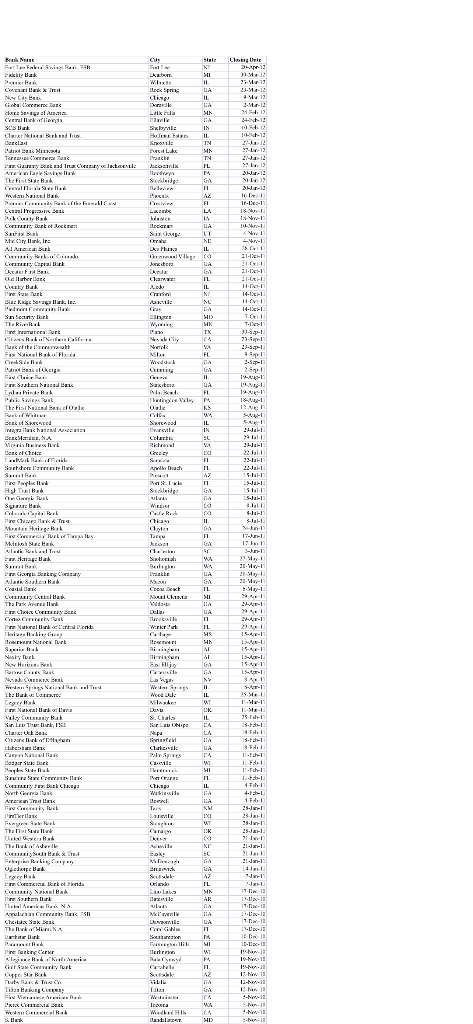
Part 1) Bank Closings (Chapter 3- Data Visualization) U.S. bank branch closings have reached new high levels in recent years with 3324 closures in 2020. This is mainly due to the fact that costumers continued to migrate to online and mobile banking with high yield savings accounts. The data of bank closings in the United States between 2004 and 2012 is given in the file Closing.xls. Using PivotTables answer the questions below (copy and paste the PivotTables from Excel to your report): a) How many bank closings occurred in the U.S. after the financial crisis (total number of closings for 2009 through 2012)? Show the top 10 states for this period. Which state shows the fourth largest number of closings for the period after the financial crisis? How many closings in that state? Which cities in that state show the second largest number of bank closings? How many? b) Show the top 5 cities in the U.S. with the largest number of bank closings for the years 2004 through 2012? c) What percentage of total bank closings happened in 2009 (of the total closings for the years 2004 through 2012)? Use a line chart to the show the percentage of bank closings from 2004 through 2012 and discuss your findings. d) Filter the PivotTable to show bank closings only in Illinois (IL), Nevada (NV), Colorado (CO), and Texas (TX) for the years 2004 through 2012. What is the total number of bank closings in these states for the years 2004 through 2012? . Part 1) Bank Closings (Chapter 3- Data Visualization) U.S. bank branch closings have reached new high levels in recent years with 3324 closures in 2020. This is mainly due to the fact that costumers continued to migrate to online and mobile banking with high yield savings accounts. The data of bank closings in the United States between 2004 and 2012 is given in the file Closing.xls. Using PivotTables answer the questions below (copy and paste the PivotTables from Excel to your report): a) How many bank closings occurred in the U.S. after the financial crisis (total number of closings for 2009 through 2012)? Show the top 10 states for this period. Which state shows the fourth largest number of closings for the period after the financial crisis? How many closings in that state? Which cities in that state show the second largest number of bank closings? How many? b) Show the top 5 cities in the U.S. with the largest number of bank closings for the years 2004 through 2012? c) What percentage of total bank closings happened in 2009 (of the total closings for the years 2004 through 2012)? Use a line chart to the show the percentage of bank closings from 2004 through 2012 and discuss your findings. d) Filter the PivotTable to show bank closings only in Illinois (IL), Nevada (NV), Colorado (CO), and Texas (TX) for the years 2004 through 2012. What is the total number of bank closings in these states for the years 2004 through 2012
Step by Step Solution
There are 3 Steps involved in it

Get step-by-step solutions from verified subject matter experts